No turnover for now…
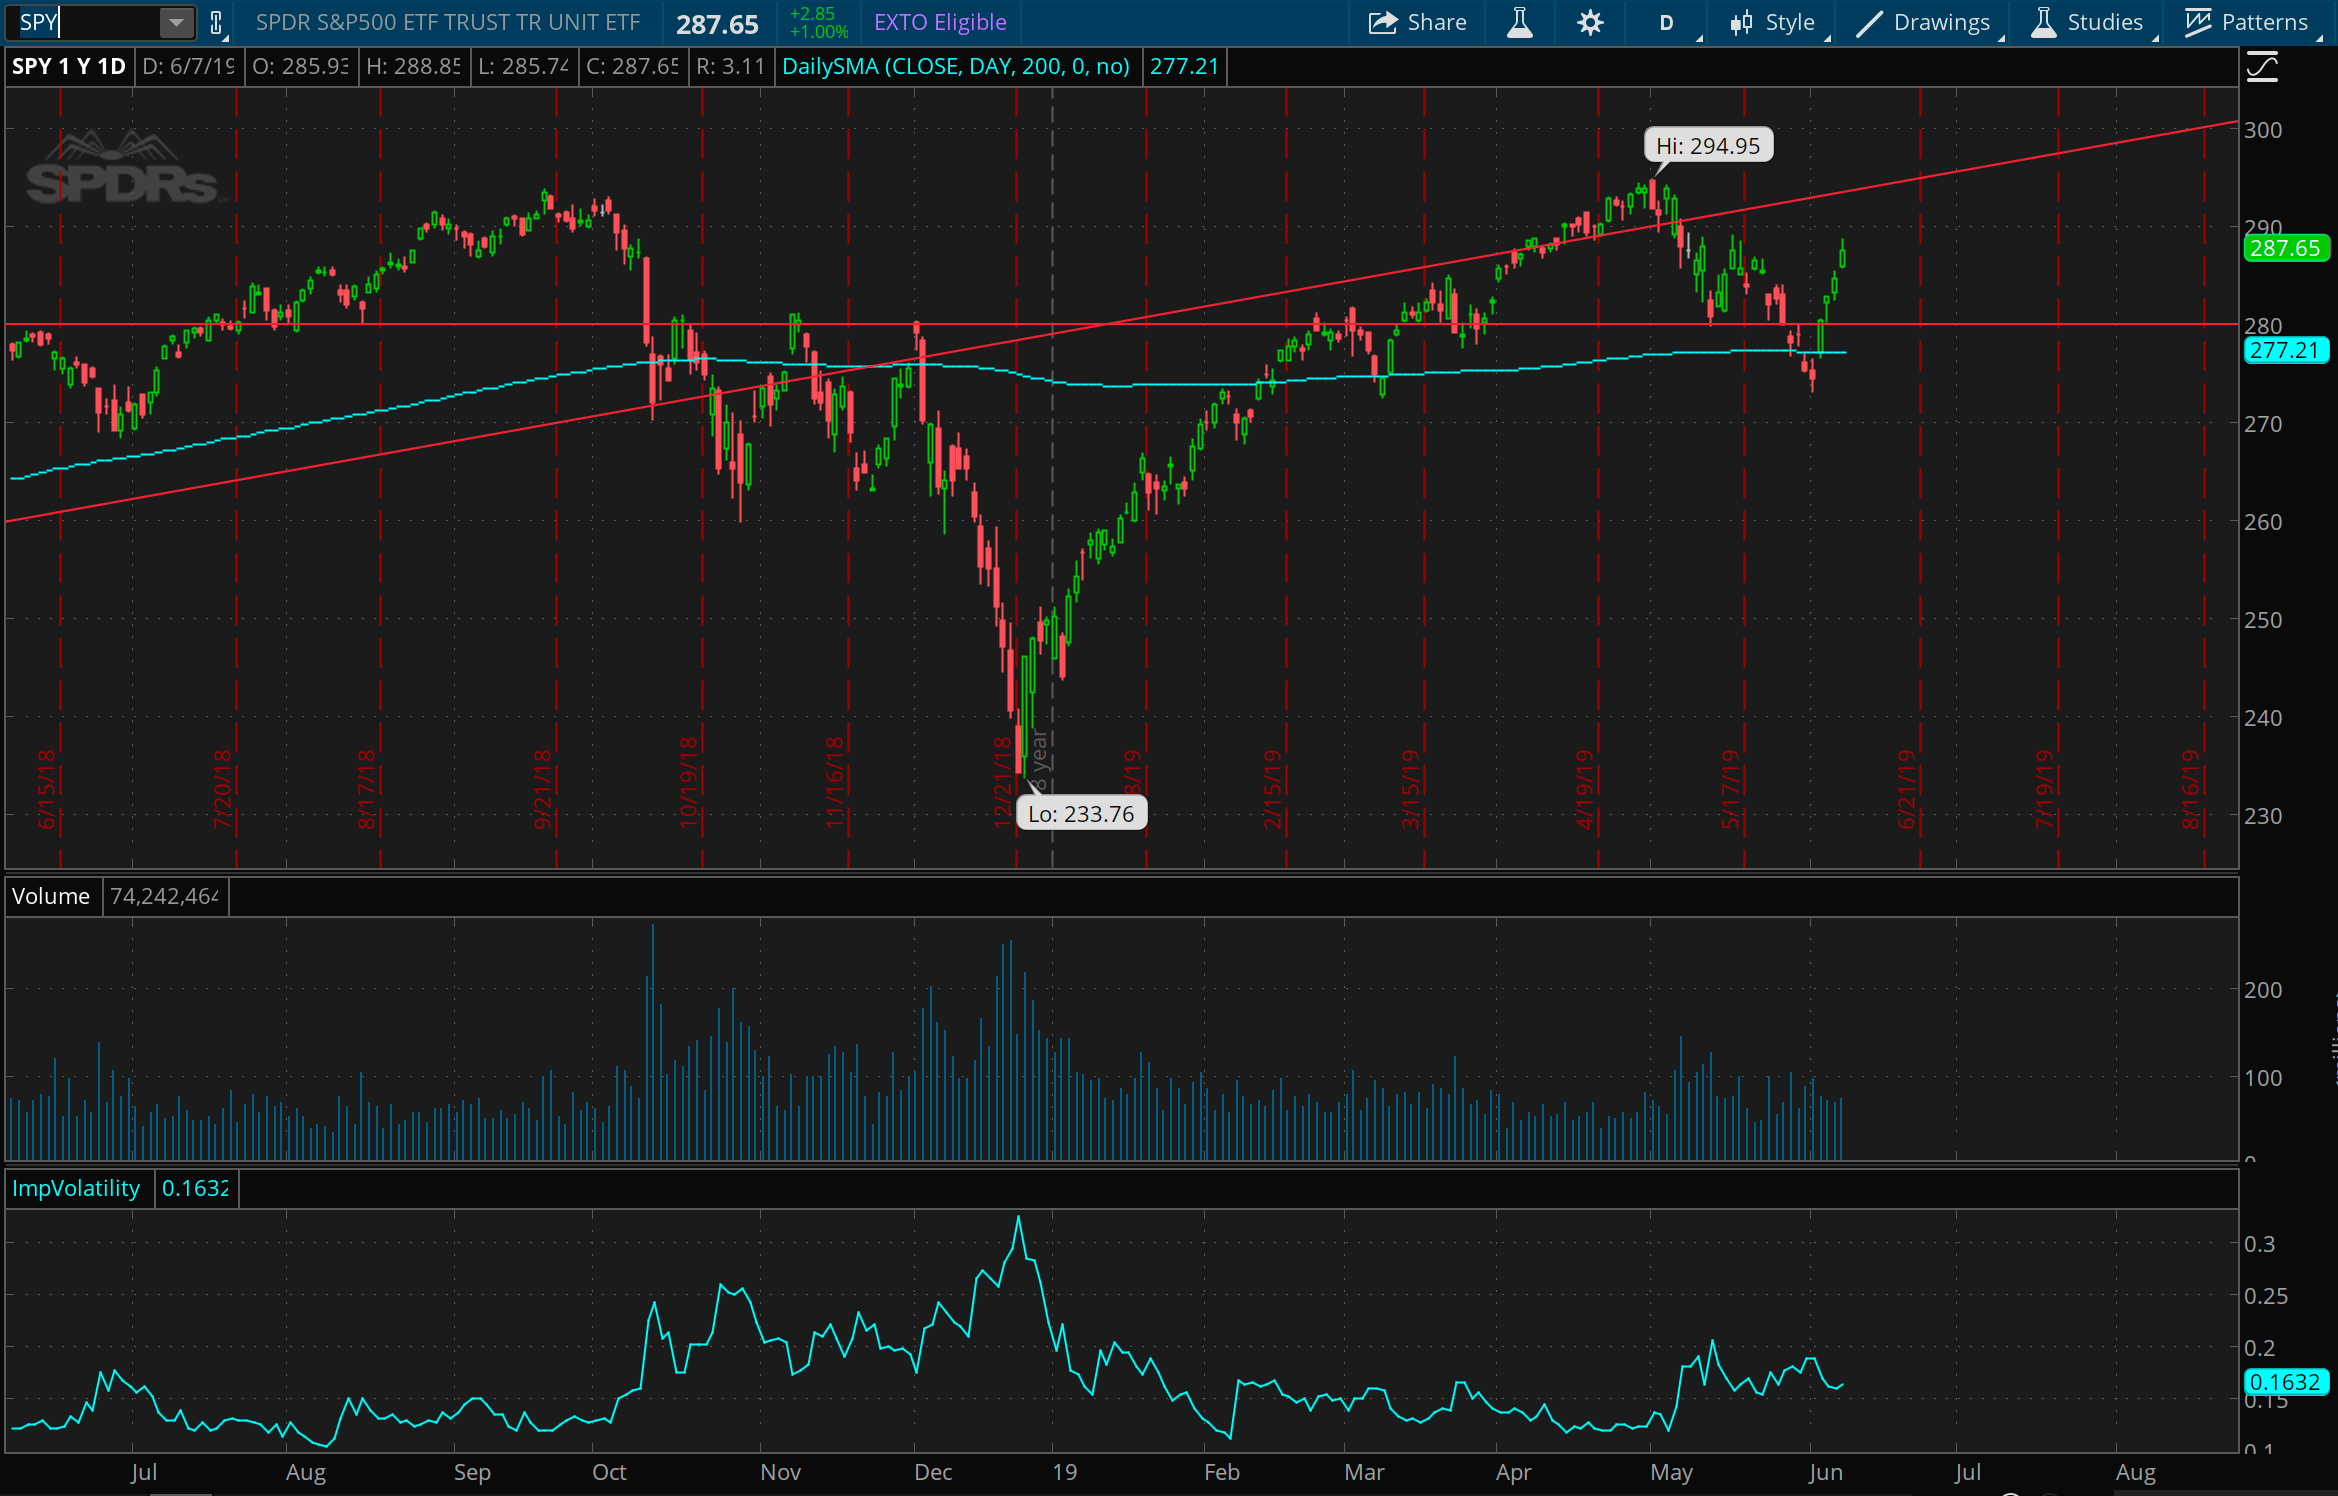
What an absolute rip. The SP 500 gained over 4% in just this week. This was a major head fake after it fell under the major 280 level we’ve been talking about for the past few weeks, as well as the 200 day moving average. The end of last week looked like it spelled certain doom for the markets, and here you get a vicious rally. At this point it seems like it should continue bouncing and bumbling along between 275-280 and perhaps 300. My general sentiment after this huge rally is short, expecting to see this pull back, but it could very well meander along sideways as well. Seems less likely to see more exuberance up, but the market is a good trickster too.
V bottom, but sketchy?
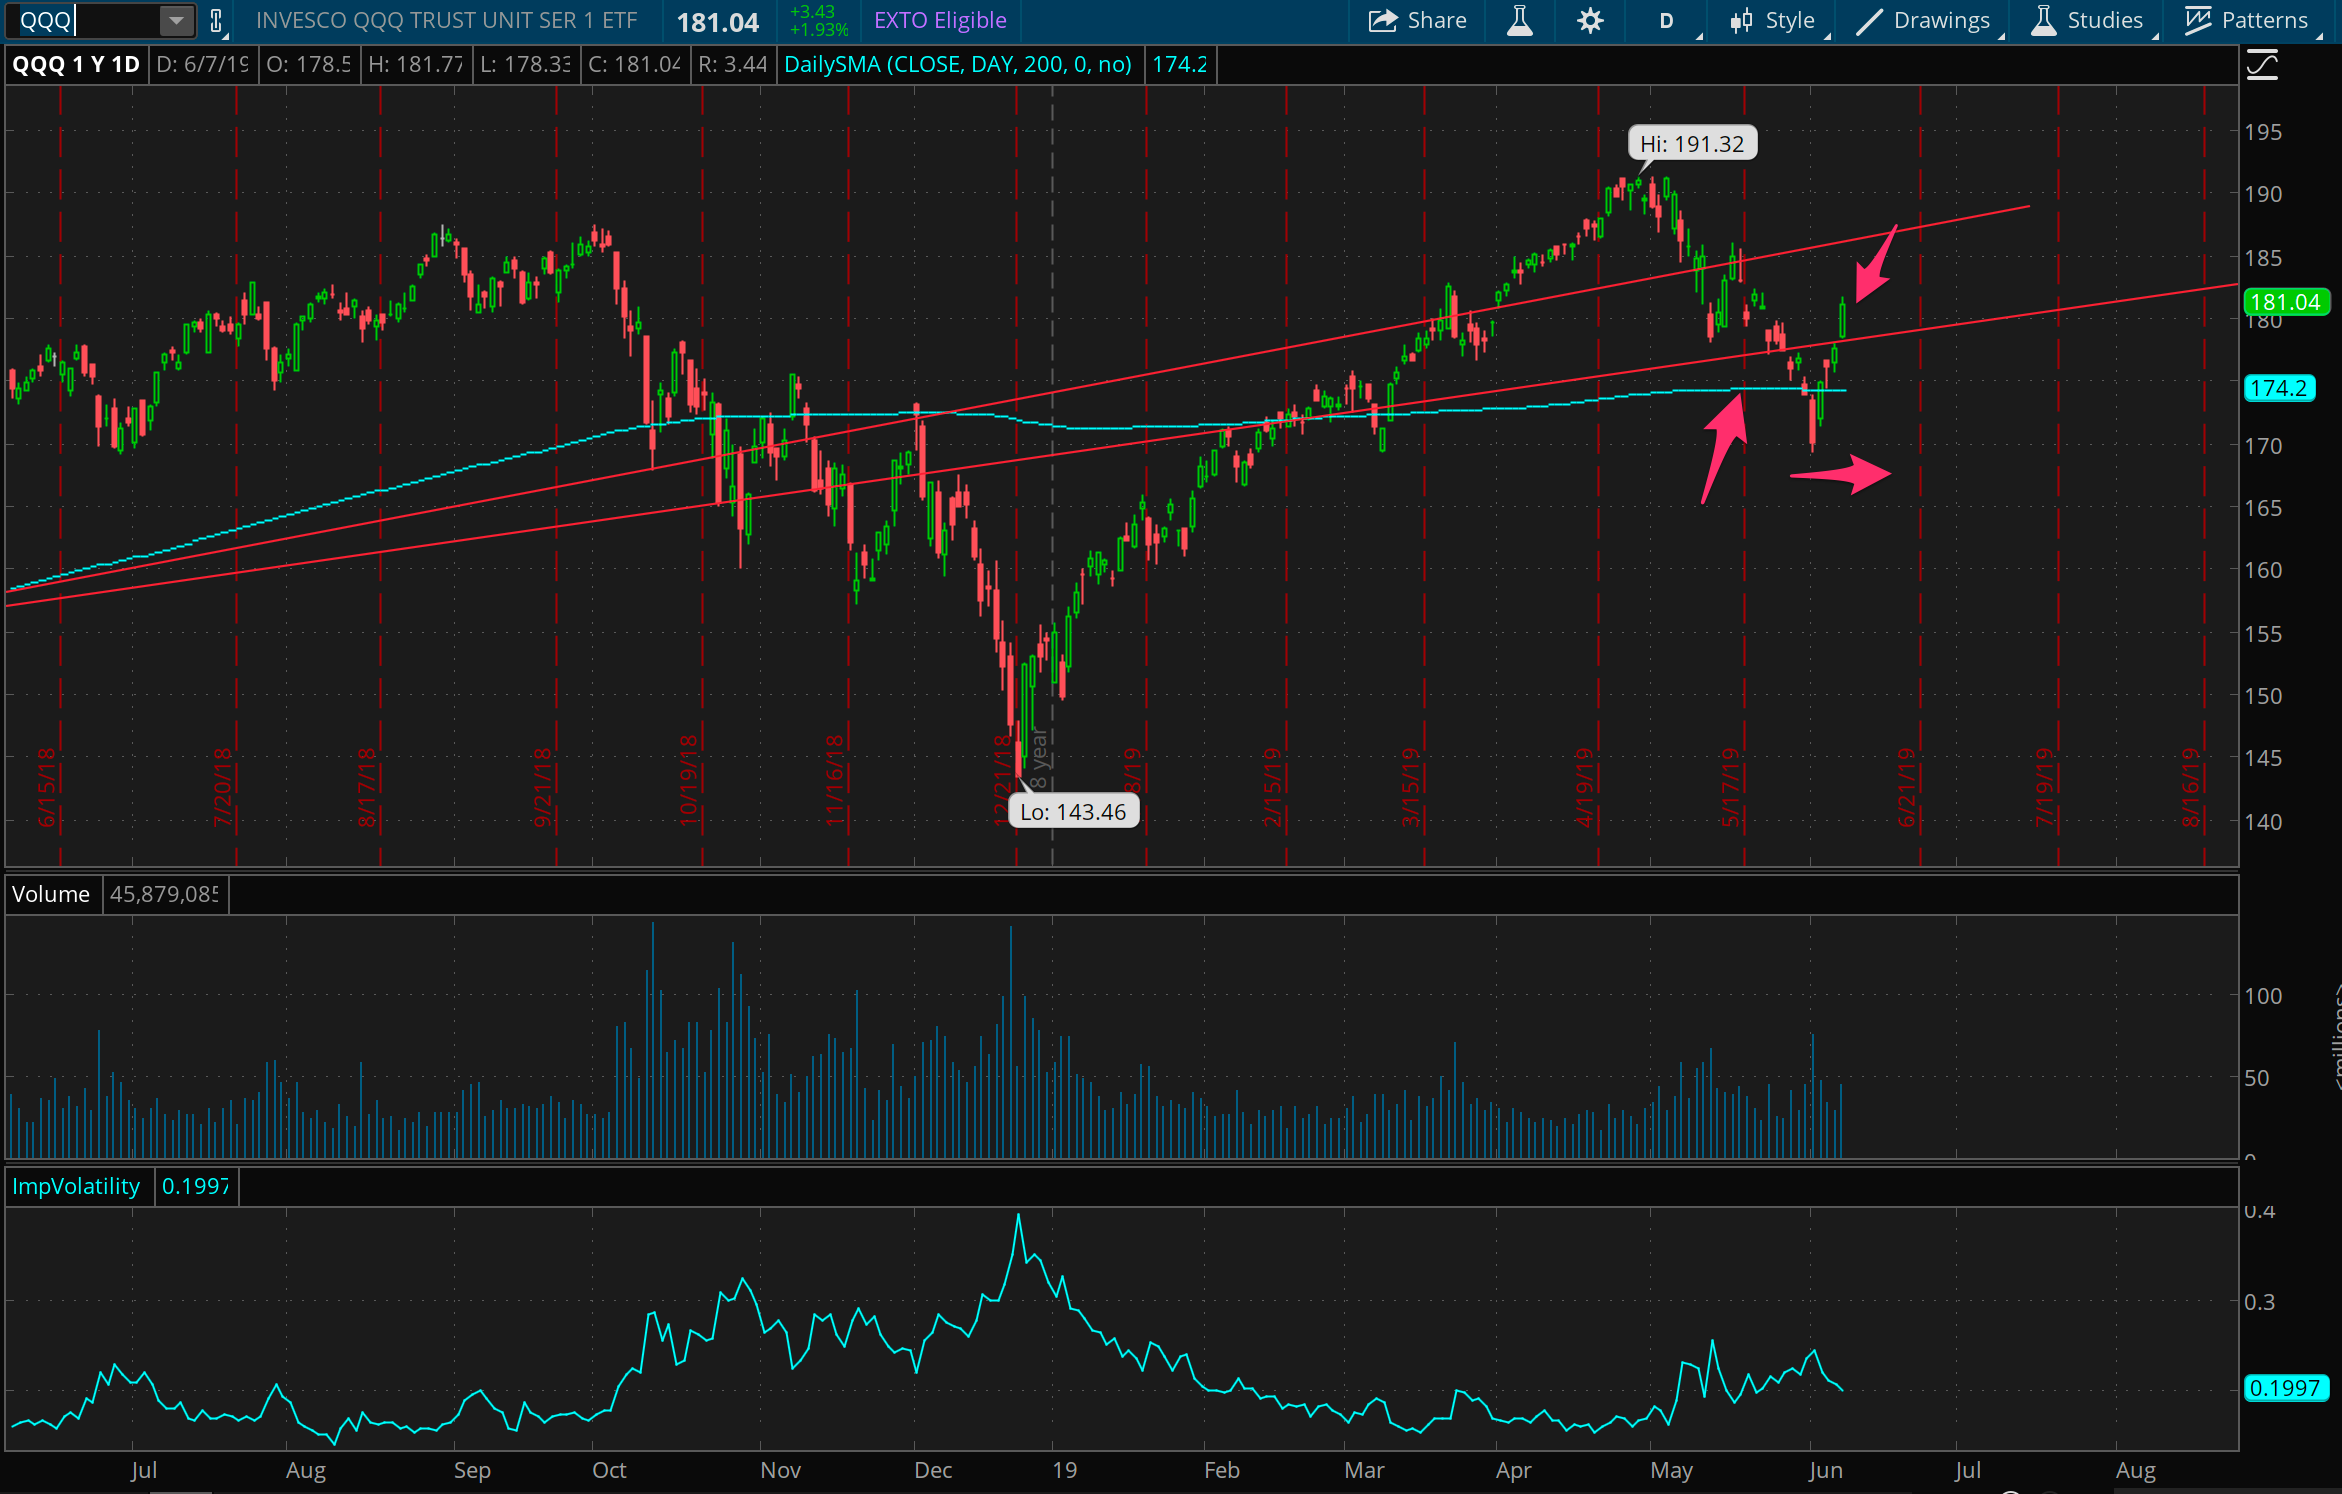
Same as the broader market, the Nasdaq had a massive bounce over the week, around 4% as well. However, tech generally seems a little bit heavier vs the overall market. After putting on a support trade 2 weeks ago, I did some finagling last week to take some risk out and buy time, and then decided to get out of it today for an even scratch (no loss, no gain).
VXX, how do I love thee
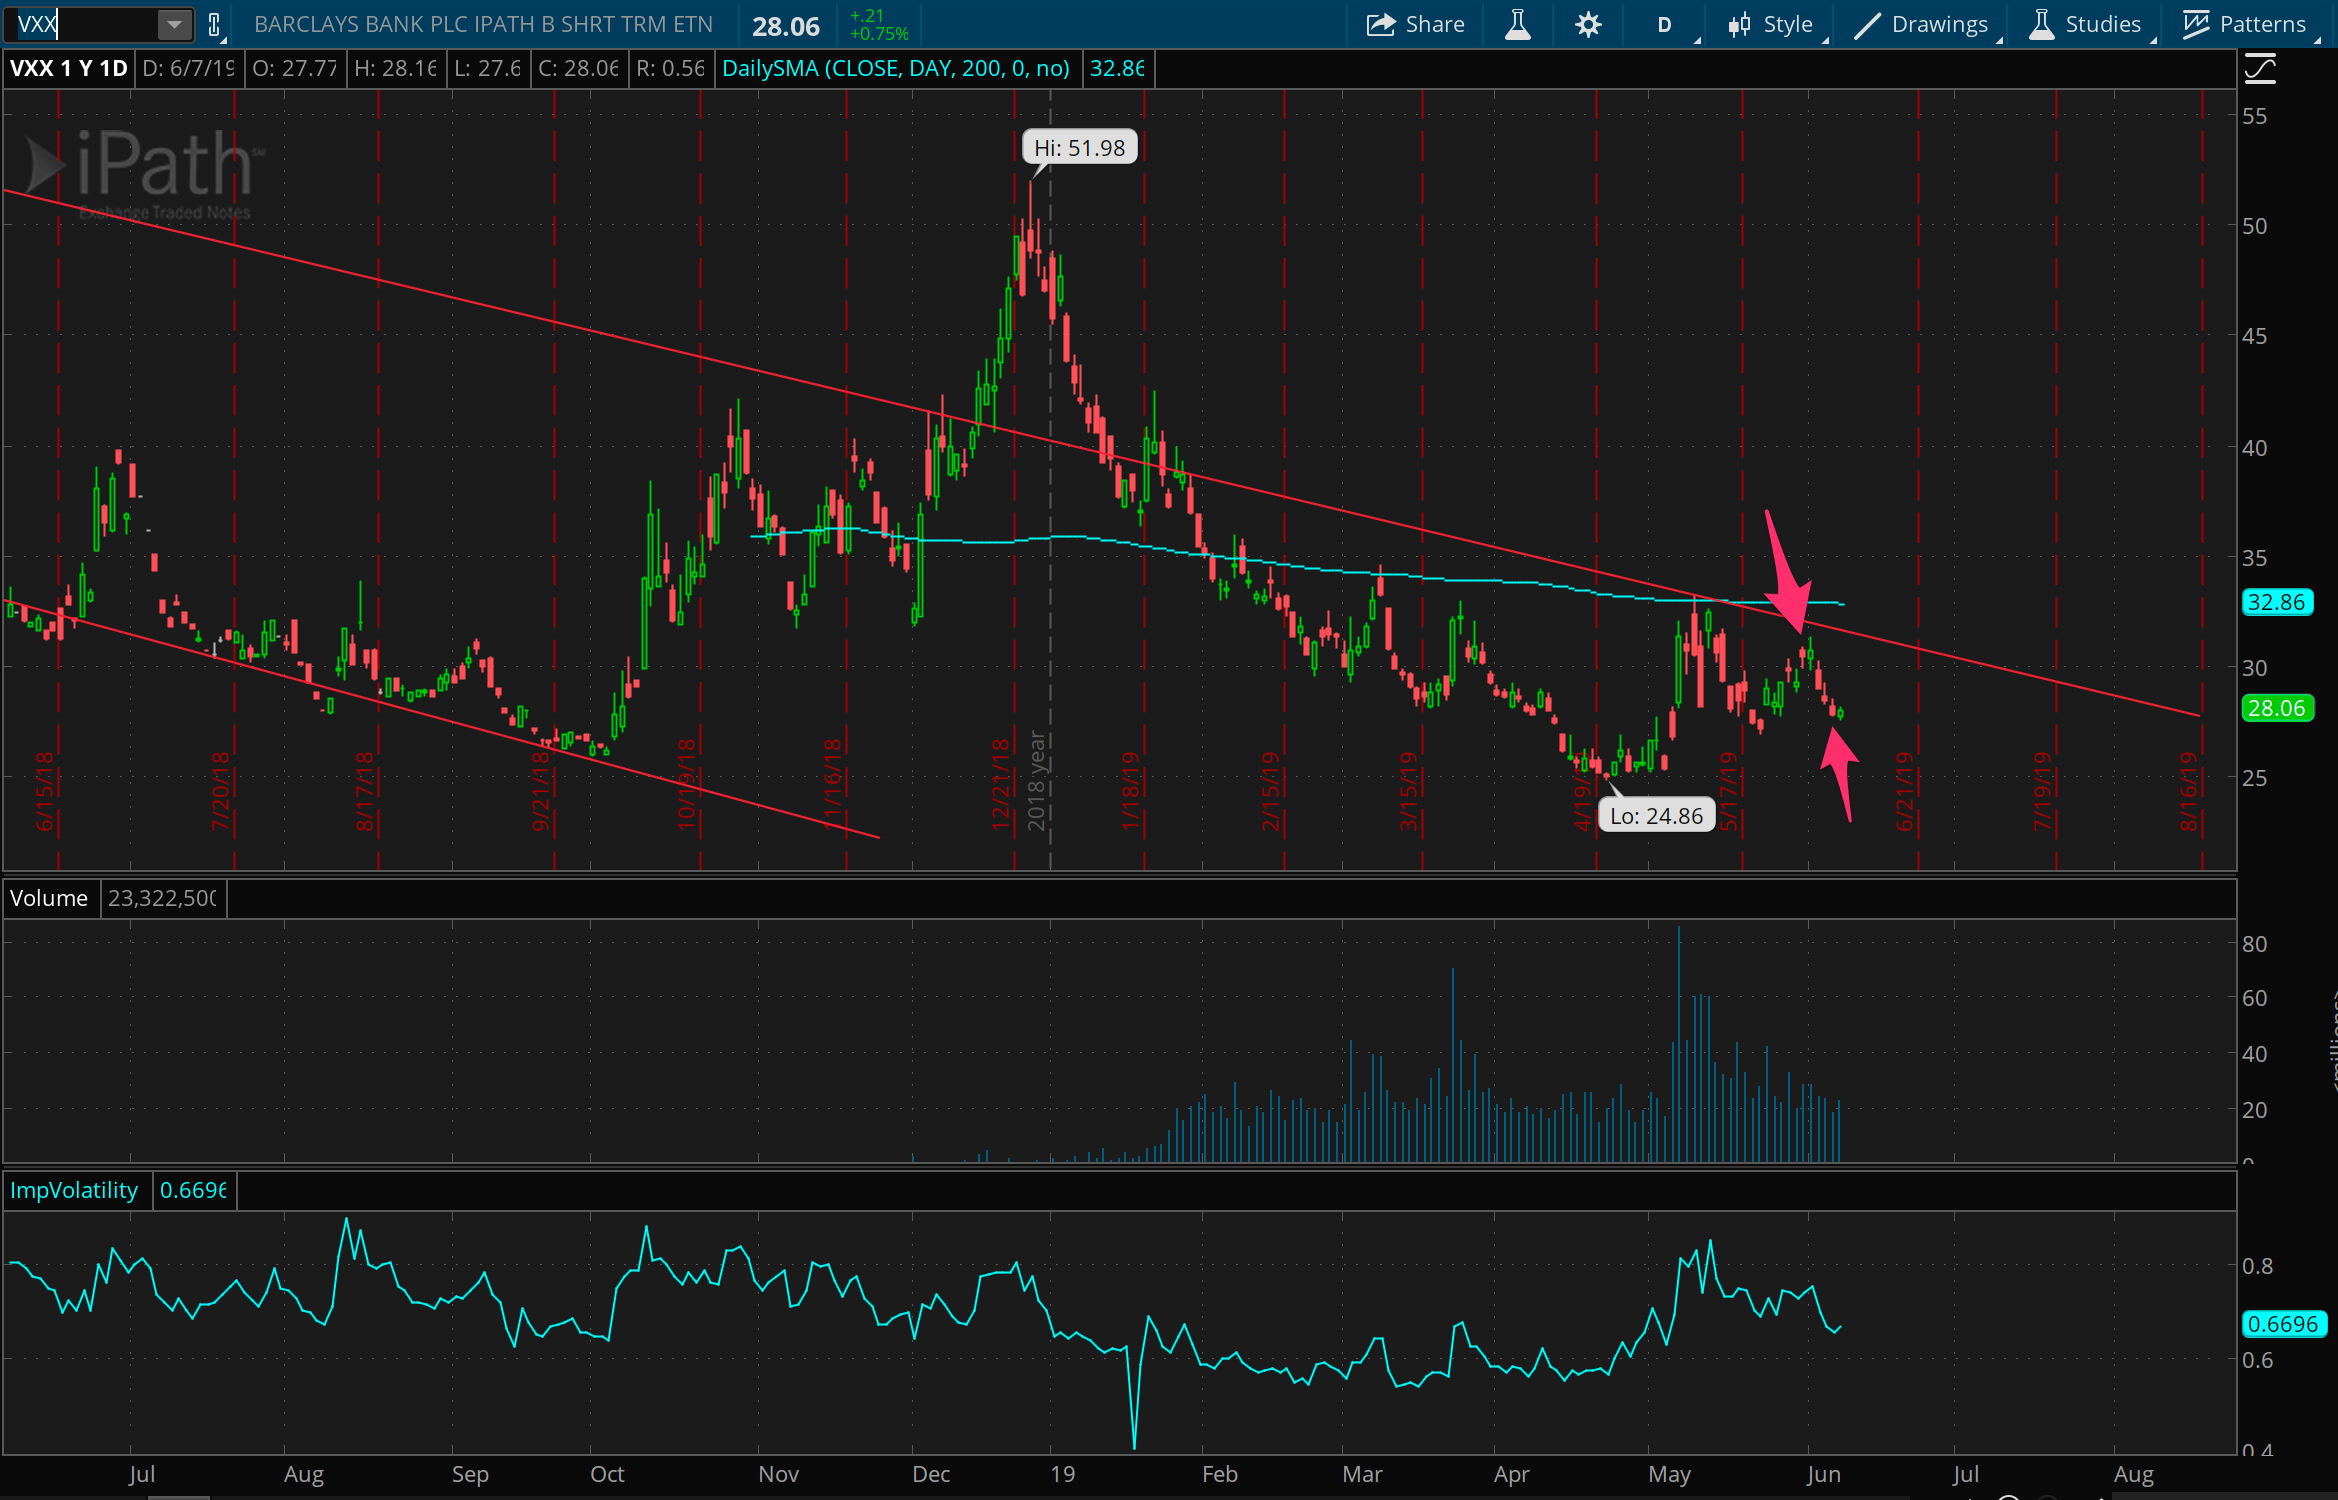
I completed my second round trip on this in three weeks after exiting the new trade I put on at the end of last week. As I said then, I’m happy to just continue taking little chunks out of this, until one day it really explodes, at which point I’ll scale into it and sit tight.
Oil is messy
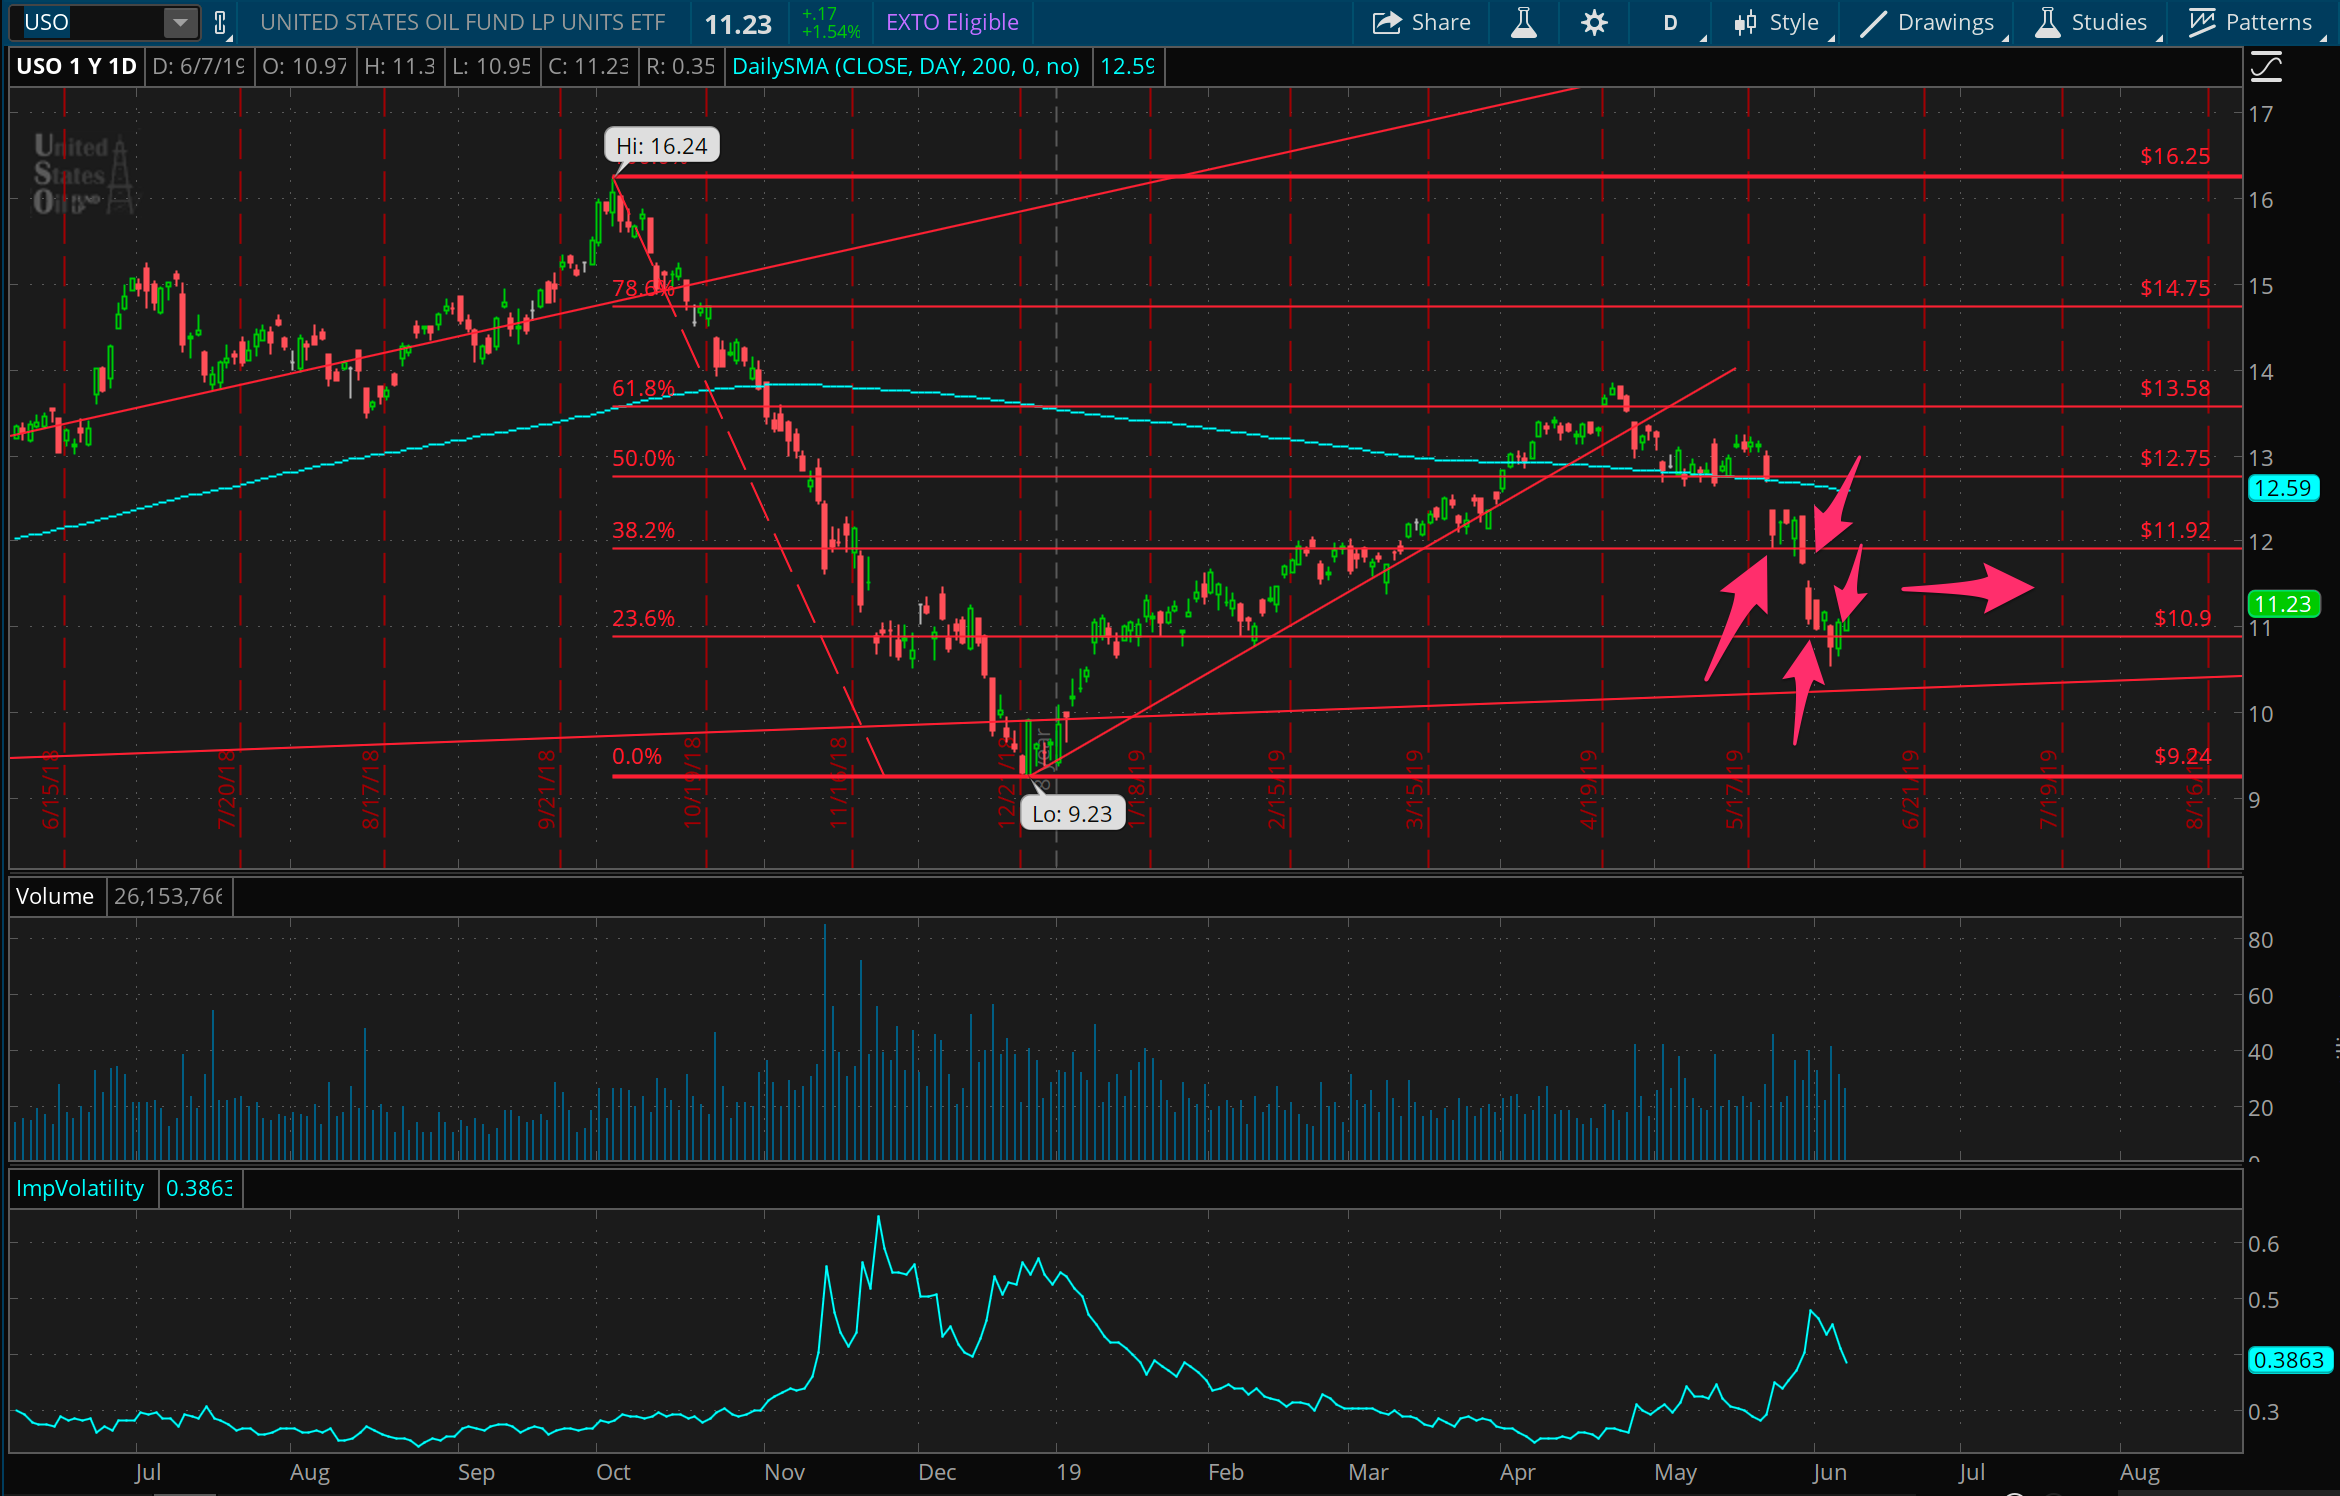
I should stop trading USO. It’s not exactly worth it. I had actually started this trade using open positions that weren’t risk capped, since the product is small (it’s a low price). I thought it would be a good way to learn how to work with a trade as it moved around, and it’s certainly doing that. The arrows above indicate where I put on: support at 12, balancing at 12 and support at 11, then balancing at 11. At this point, I want to see USO float along between 11 and 12 for quite a while. Otherwise I’ll just move along with the trade and hope to get out at a scratch somewhere.
TSLA relief
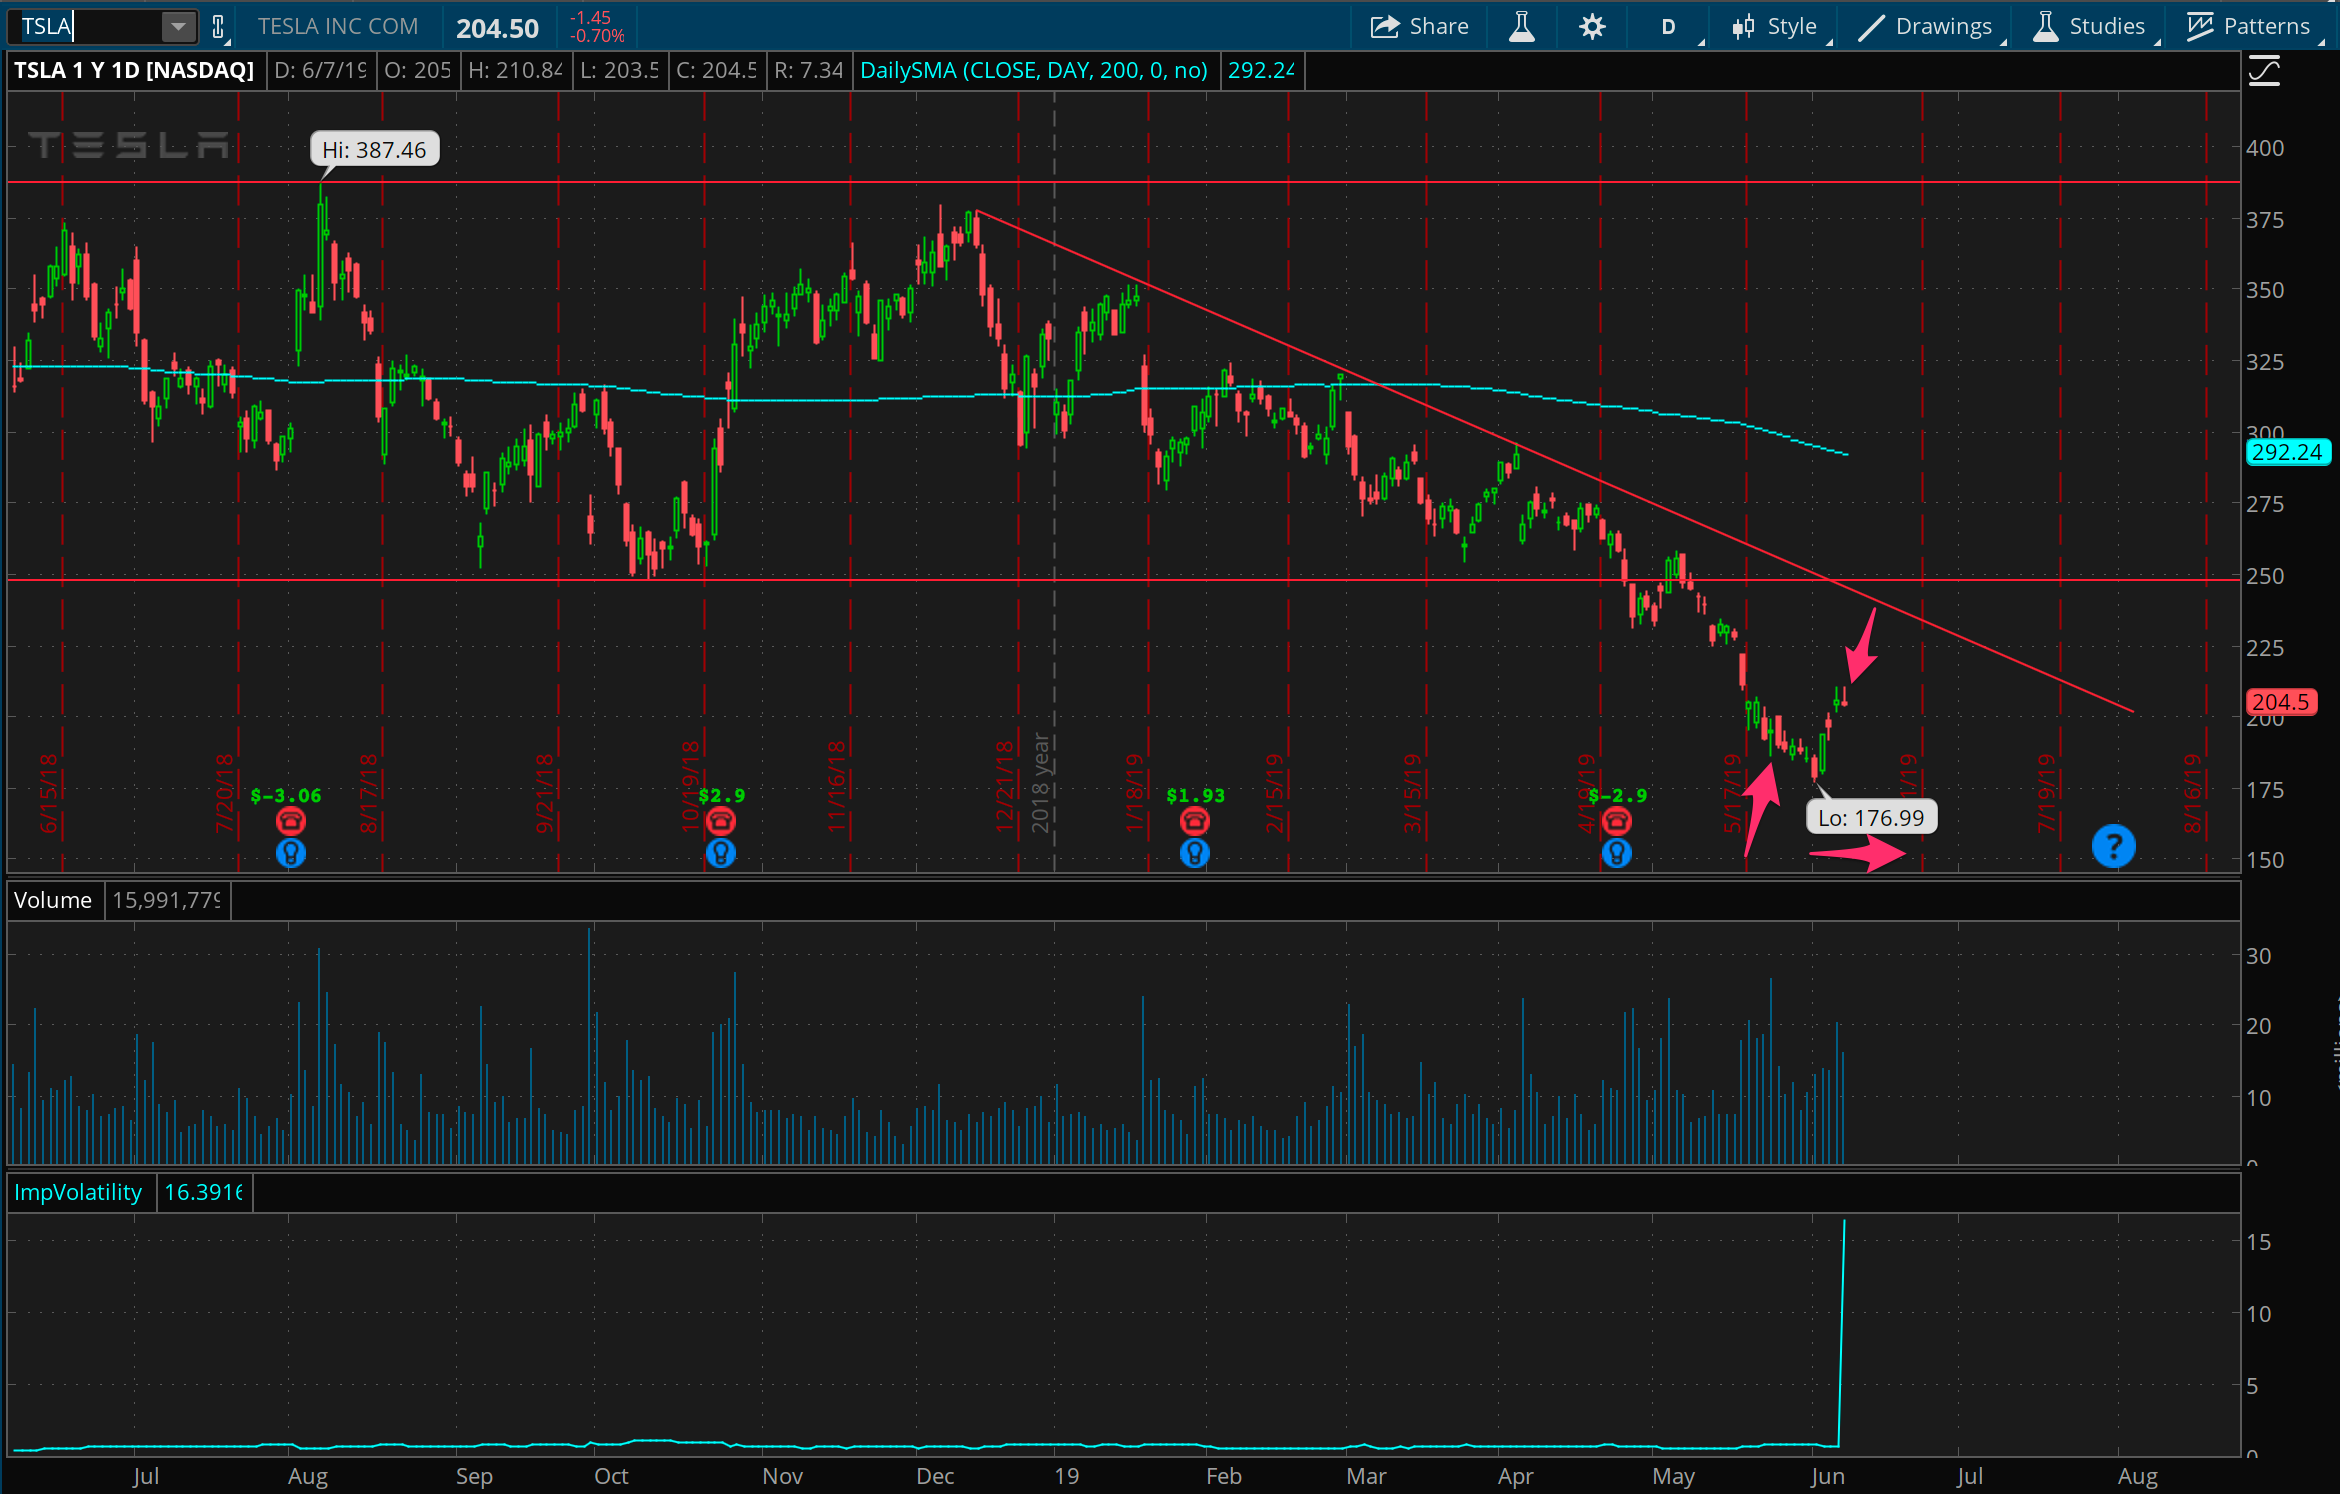
Finally got the bounce I’d hoped for after putting on a support trade 2 weeks ago for around 175. Things continued falling and so I rolled out in time last week, and decided that there was enough exuberance this week to go ahead and exit the trade for a nice win this week. It’s getting closer to a point to contemplate shorting around 250, ugly as it is. Though it’s a scary short, that Tesla.
Dare to Square
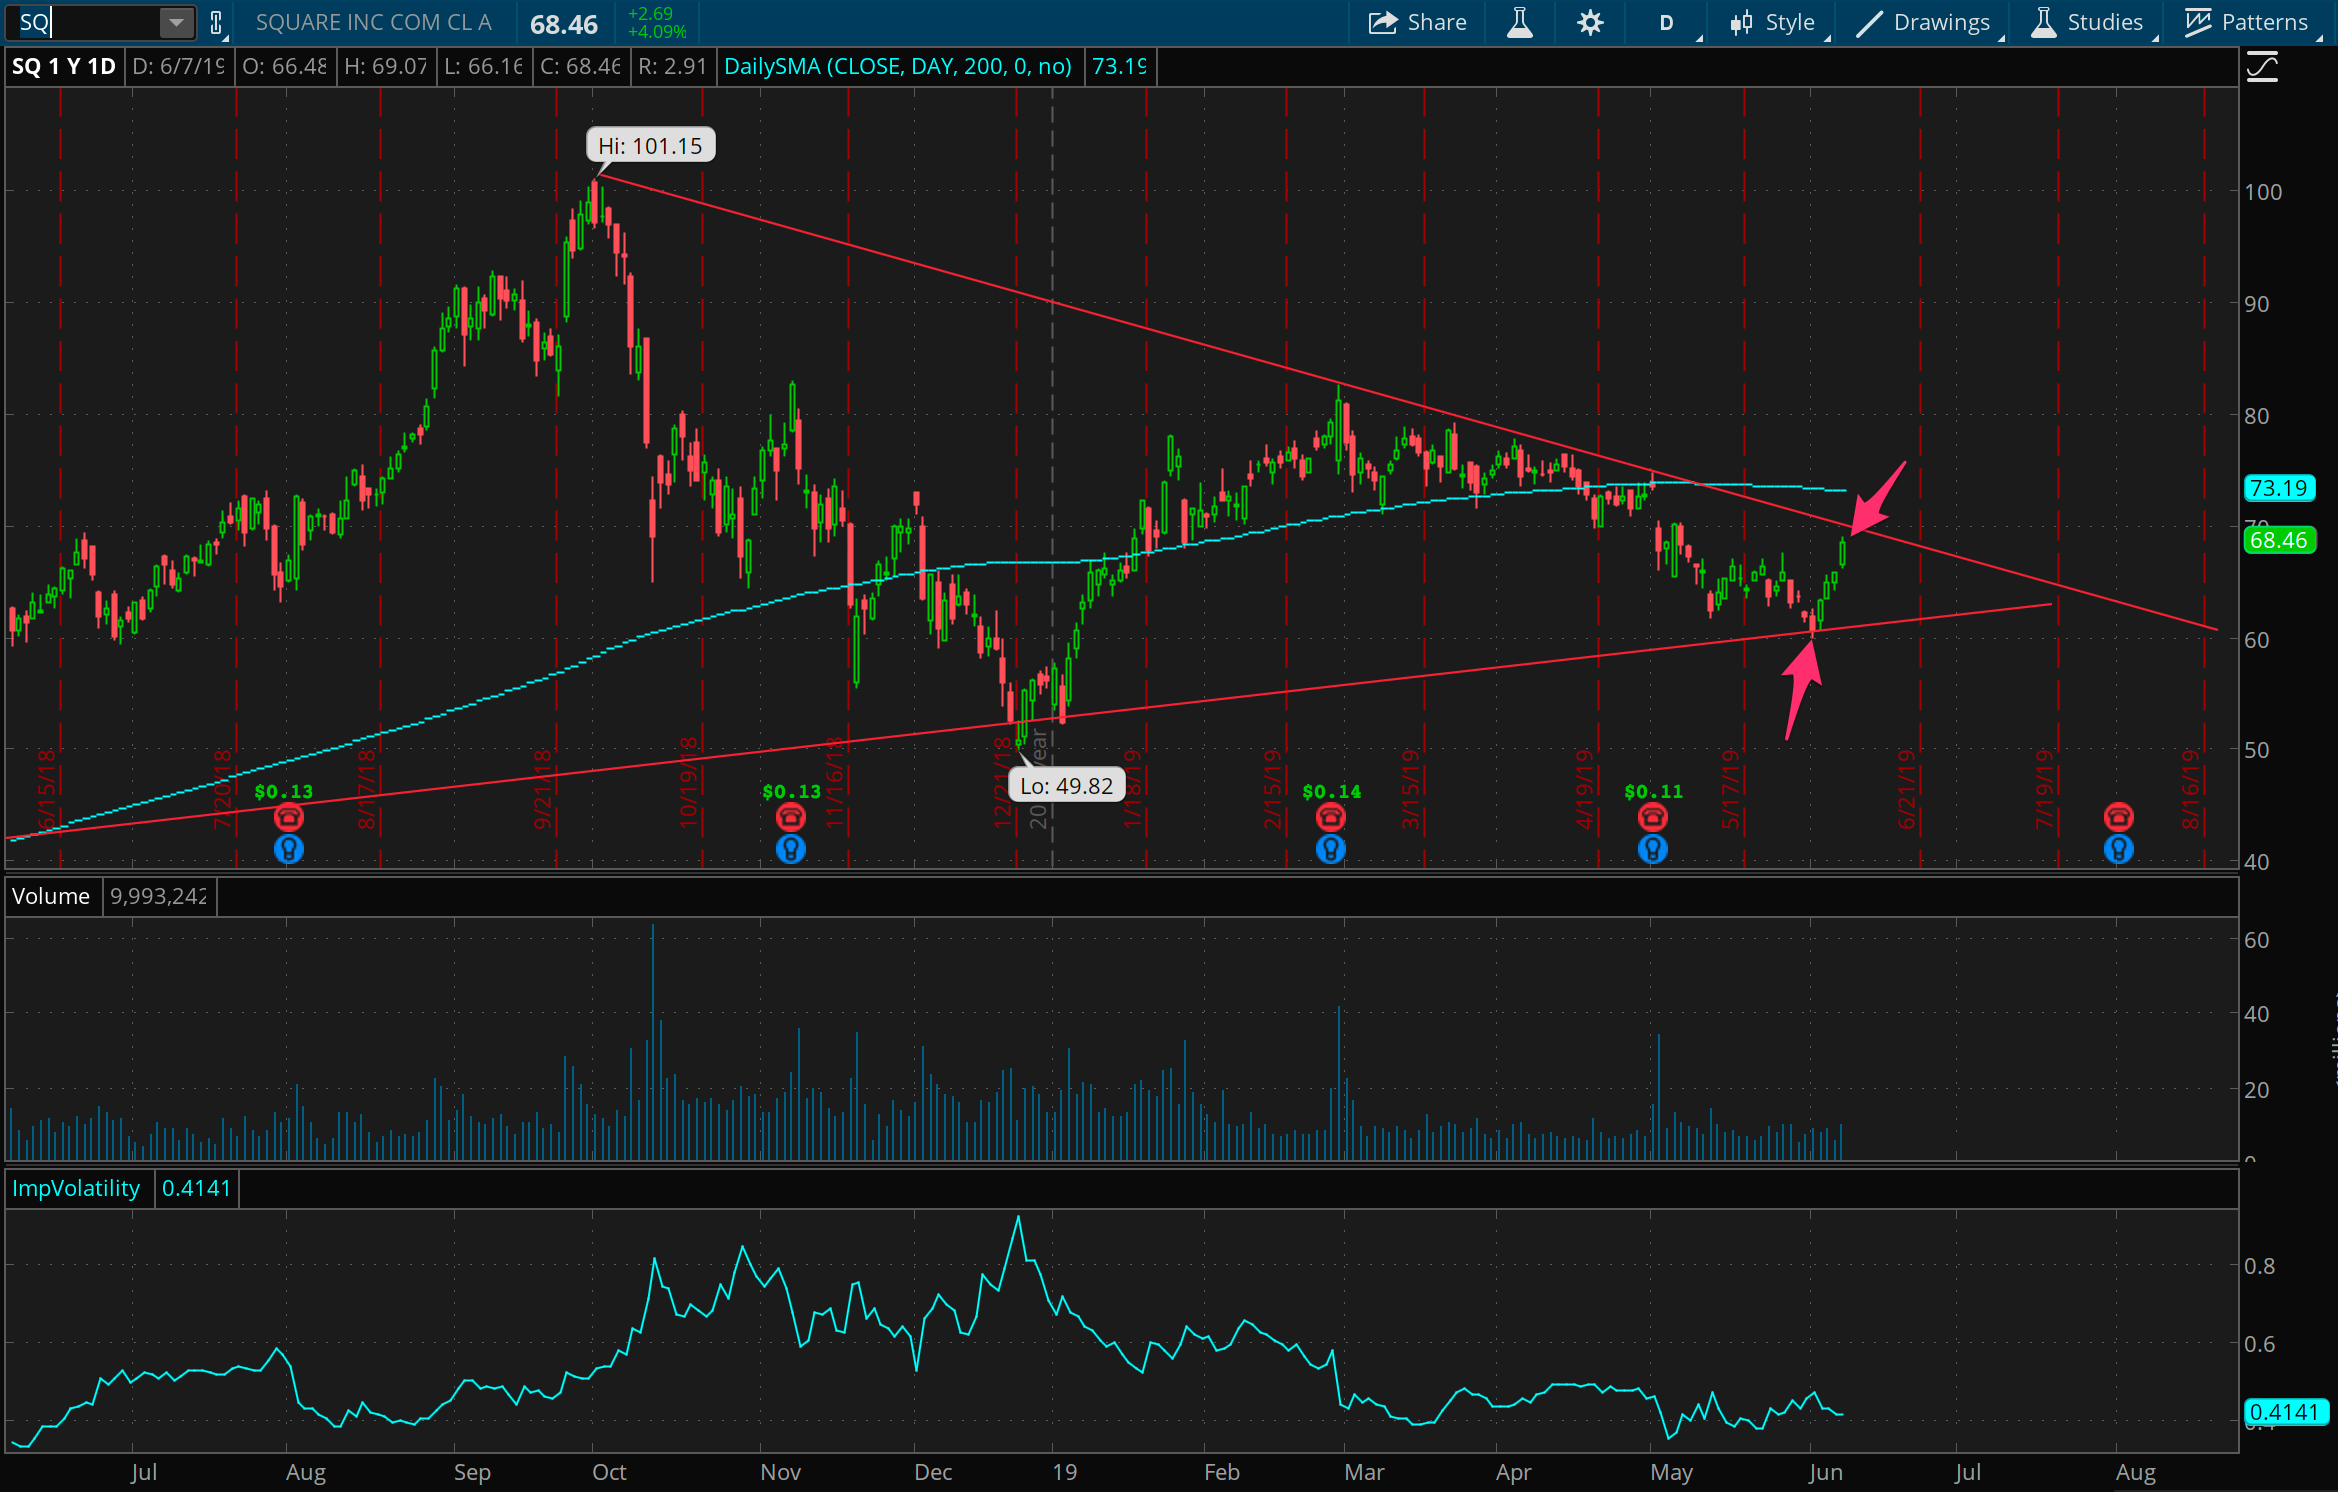
I’ve been stalking this support level in Square for a couple weeks, and just completed a round trip on it last week. As mentioned then, I was looking to reload on it for a trade on support around 60, and I found my chance right at the beginning of this week, with a very helpful market upswing helping me close it out by the end of the week. This looks like a really textbook good trade, but it may just be the direction of the market winds on this one. Will be interesting to see how the support here and resistance above resolve over the next couple weeks.
Netflix bounce
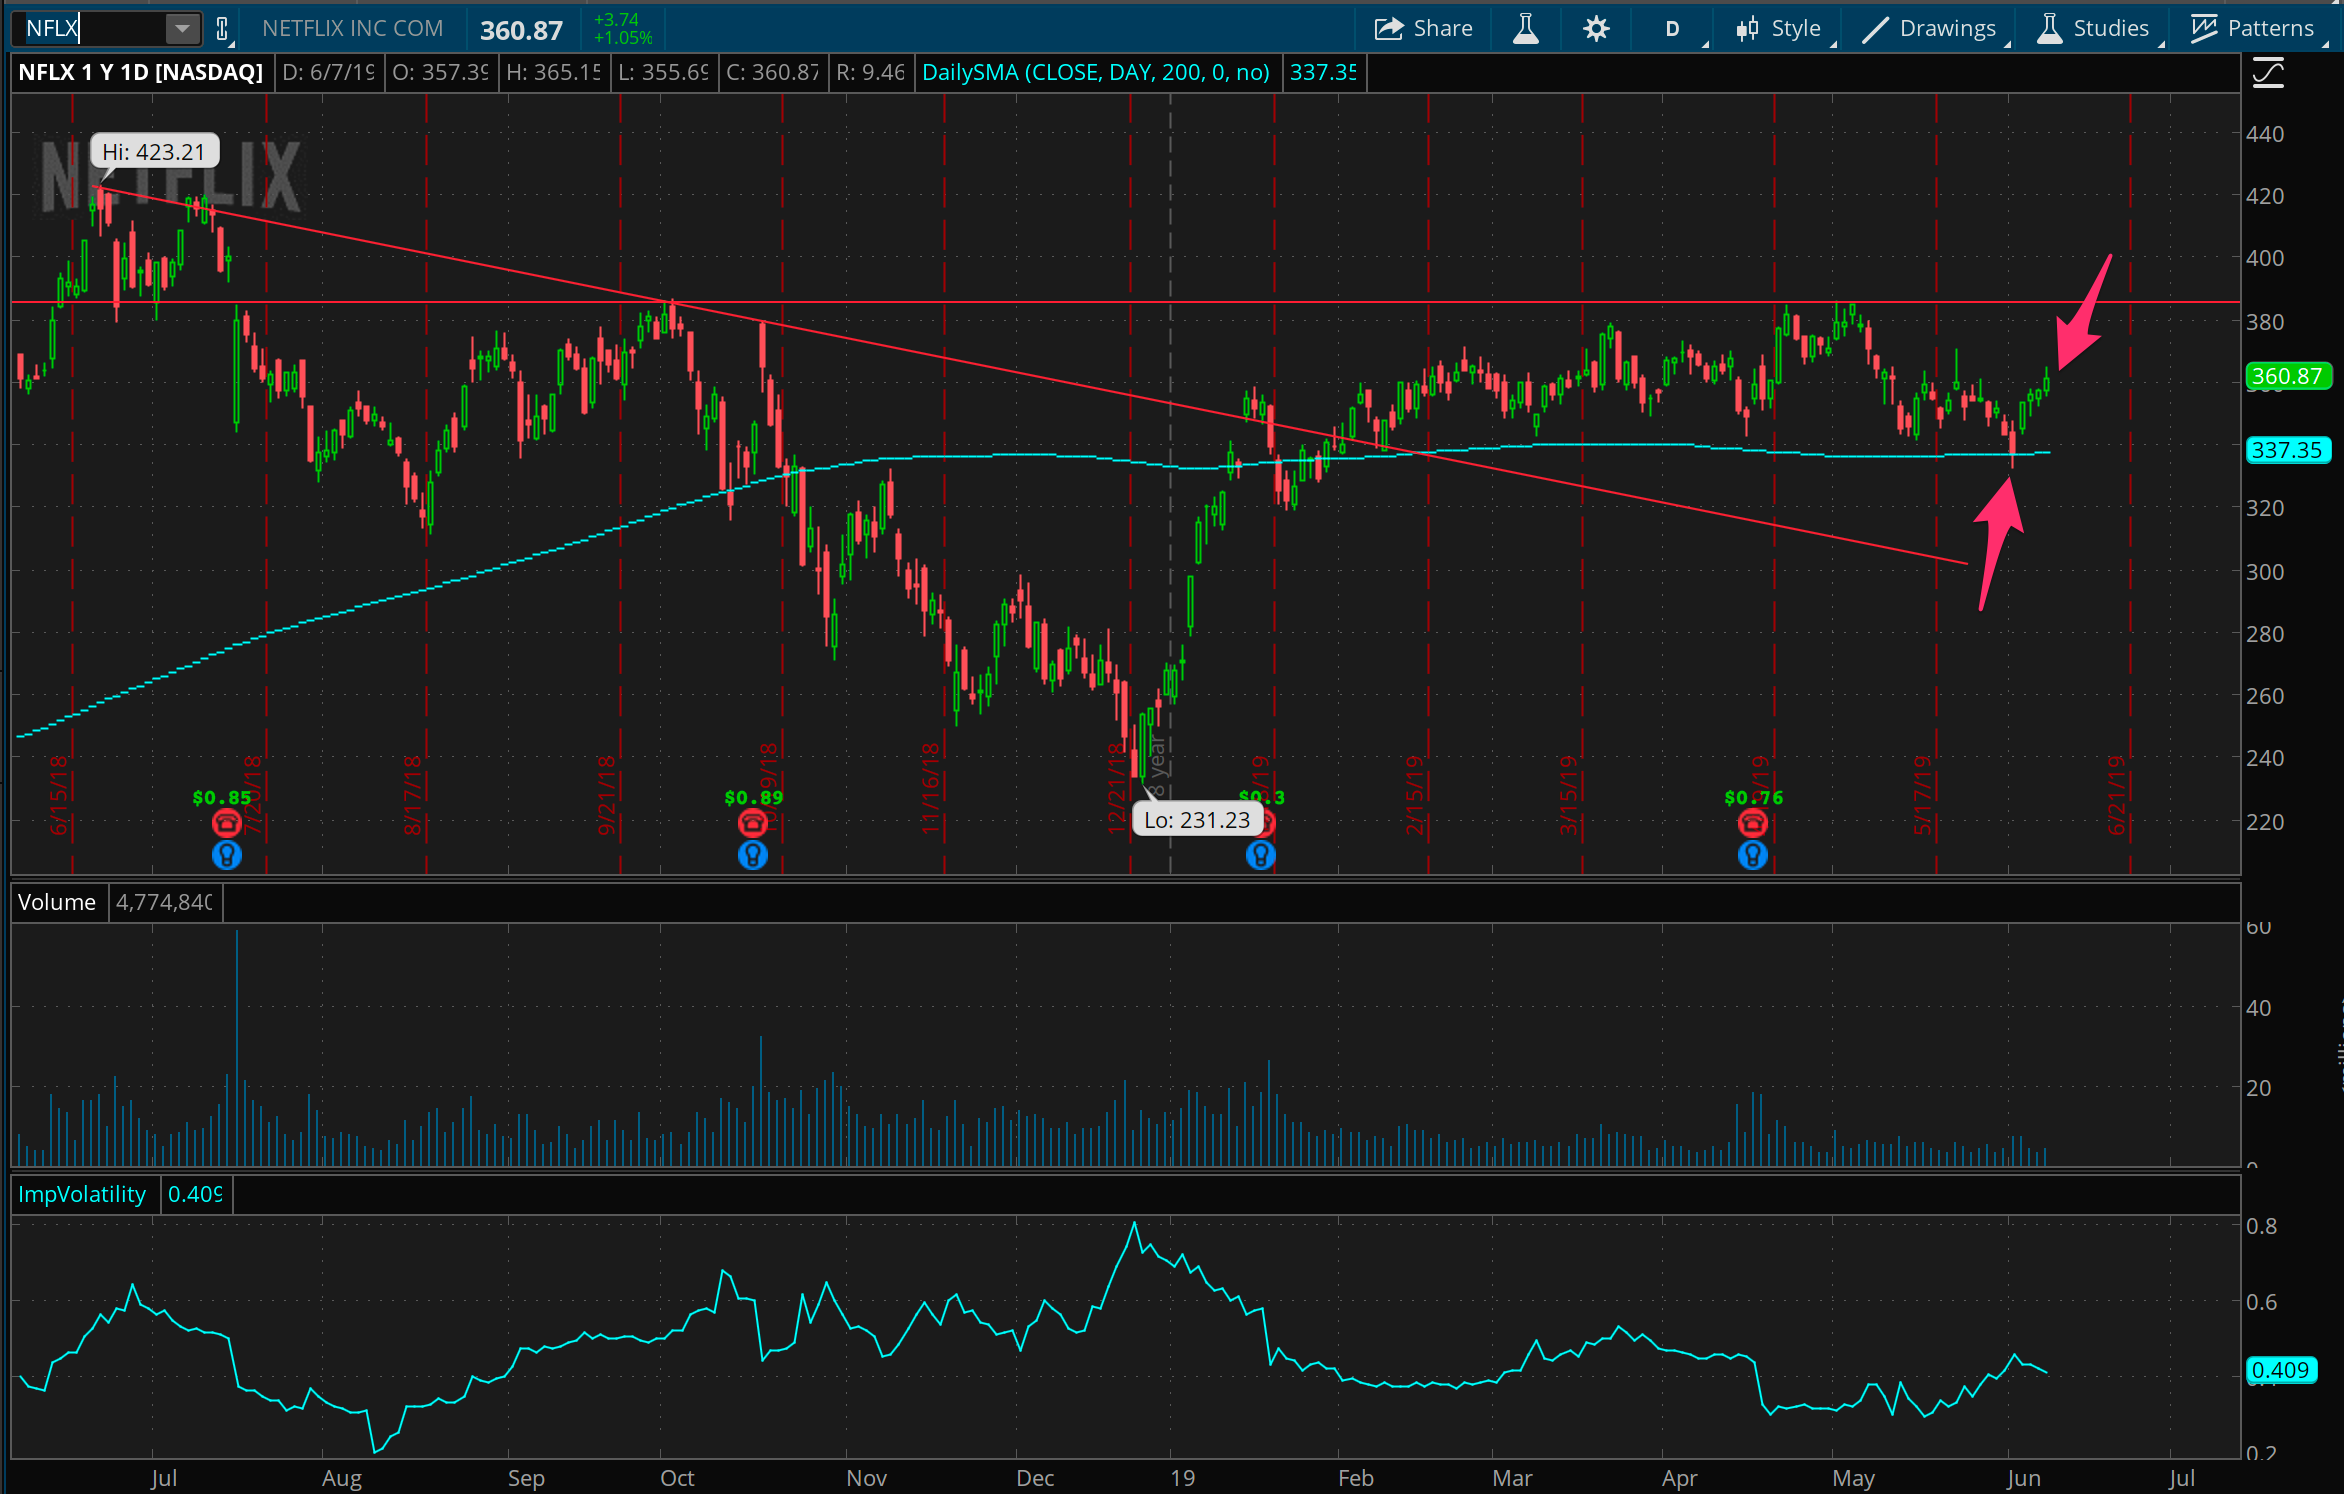
Similar story to Square above, I’ve been watching 340 as a support level for Netflix and found my chance to put a trade in for it at the beginning of this week. A cooperative market gave me a quick win by the end of the week. It’s now around the middle of this range between 340 and 390 that it’s been in for almost all year.
Twitter back above support
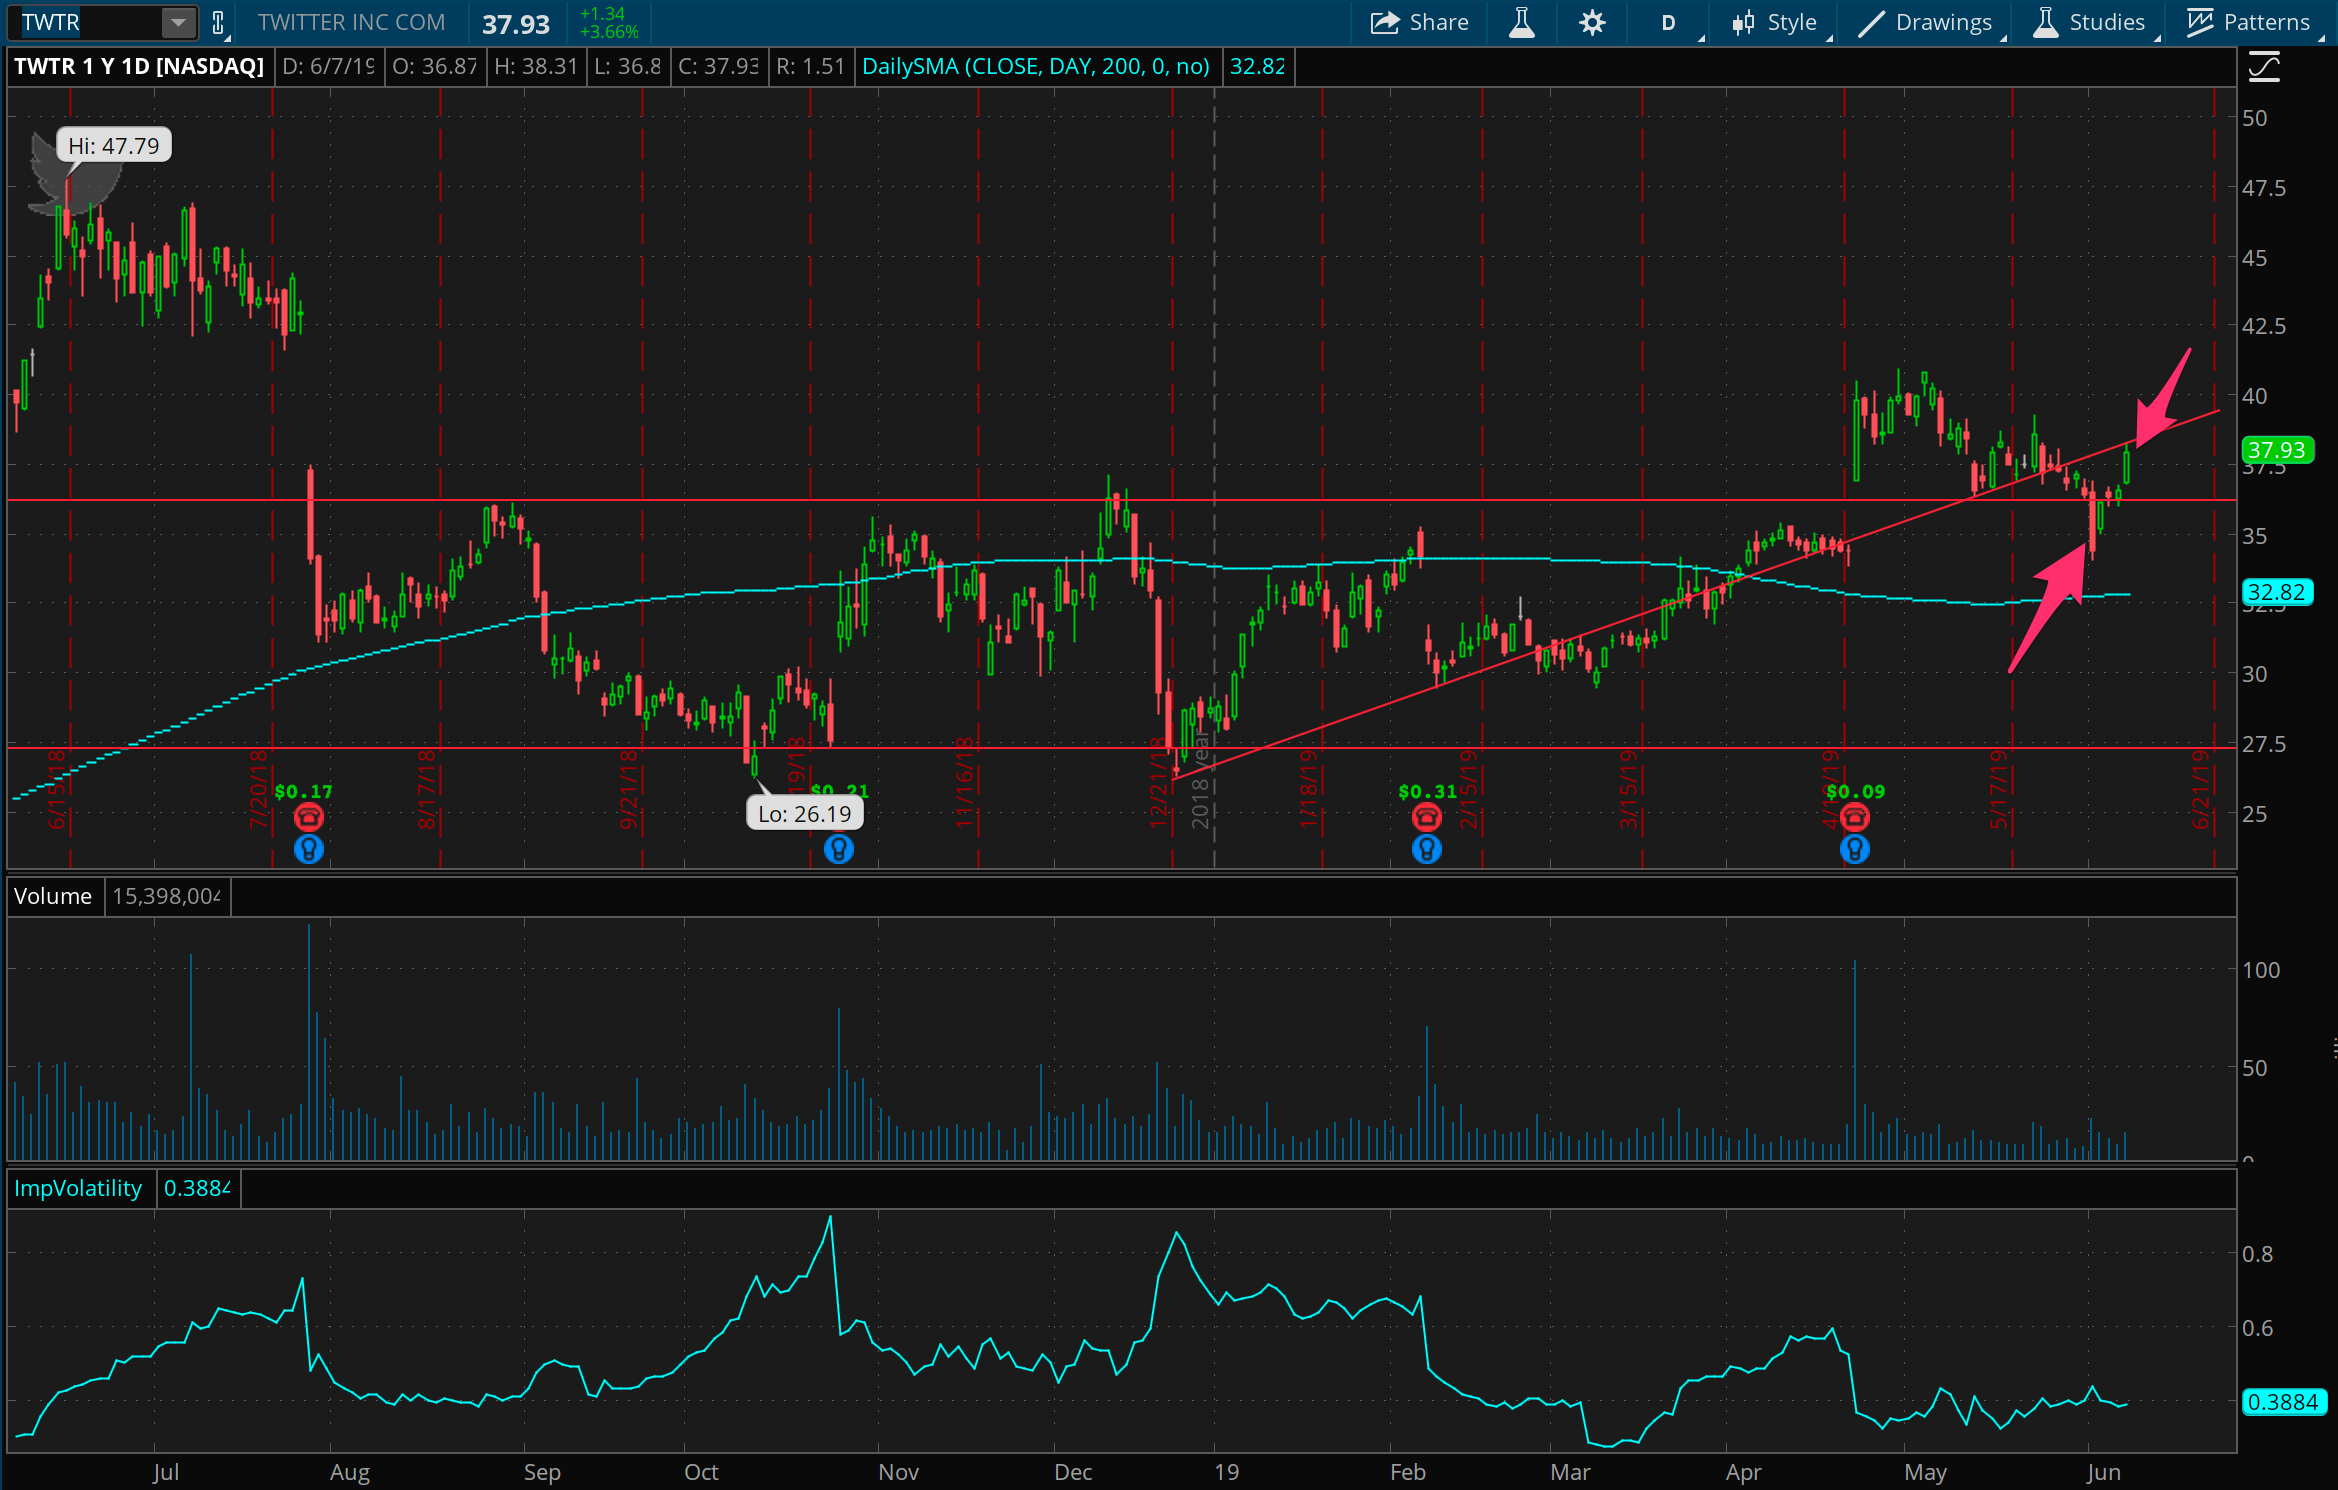
In some ways, I put on the same trade three times between this, Netflix, and Square. Similar to those two, this had some support it was close to at the beginning of the week, and I entered a trade around that time. It then bounced back from there along with the rest of the market, but generally I have less faith about that support level now, as it really damaged it in Monday’s move. Feels like it’s more likely to see 35 before 40 at this point.
XLB, finally
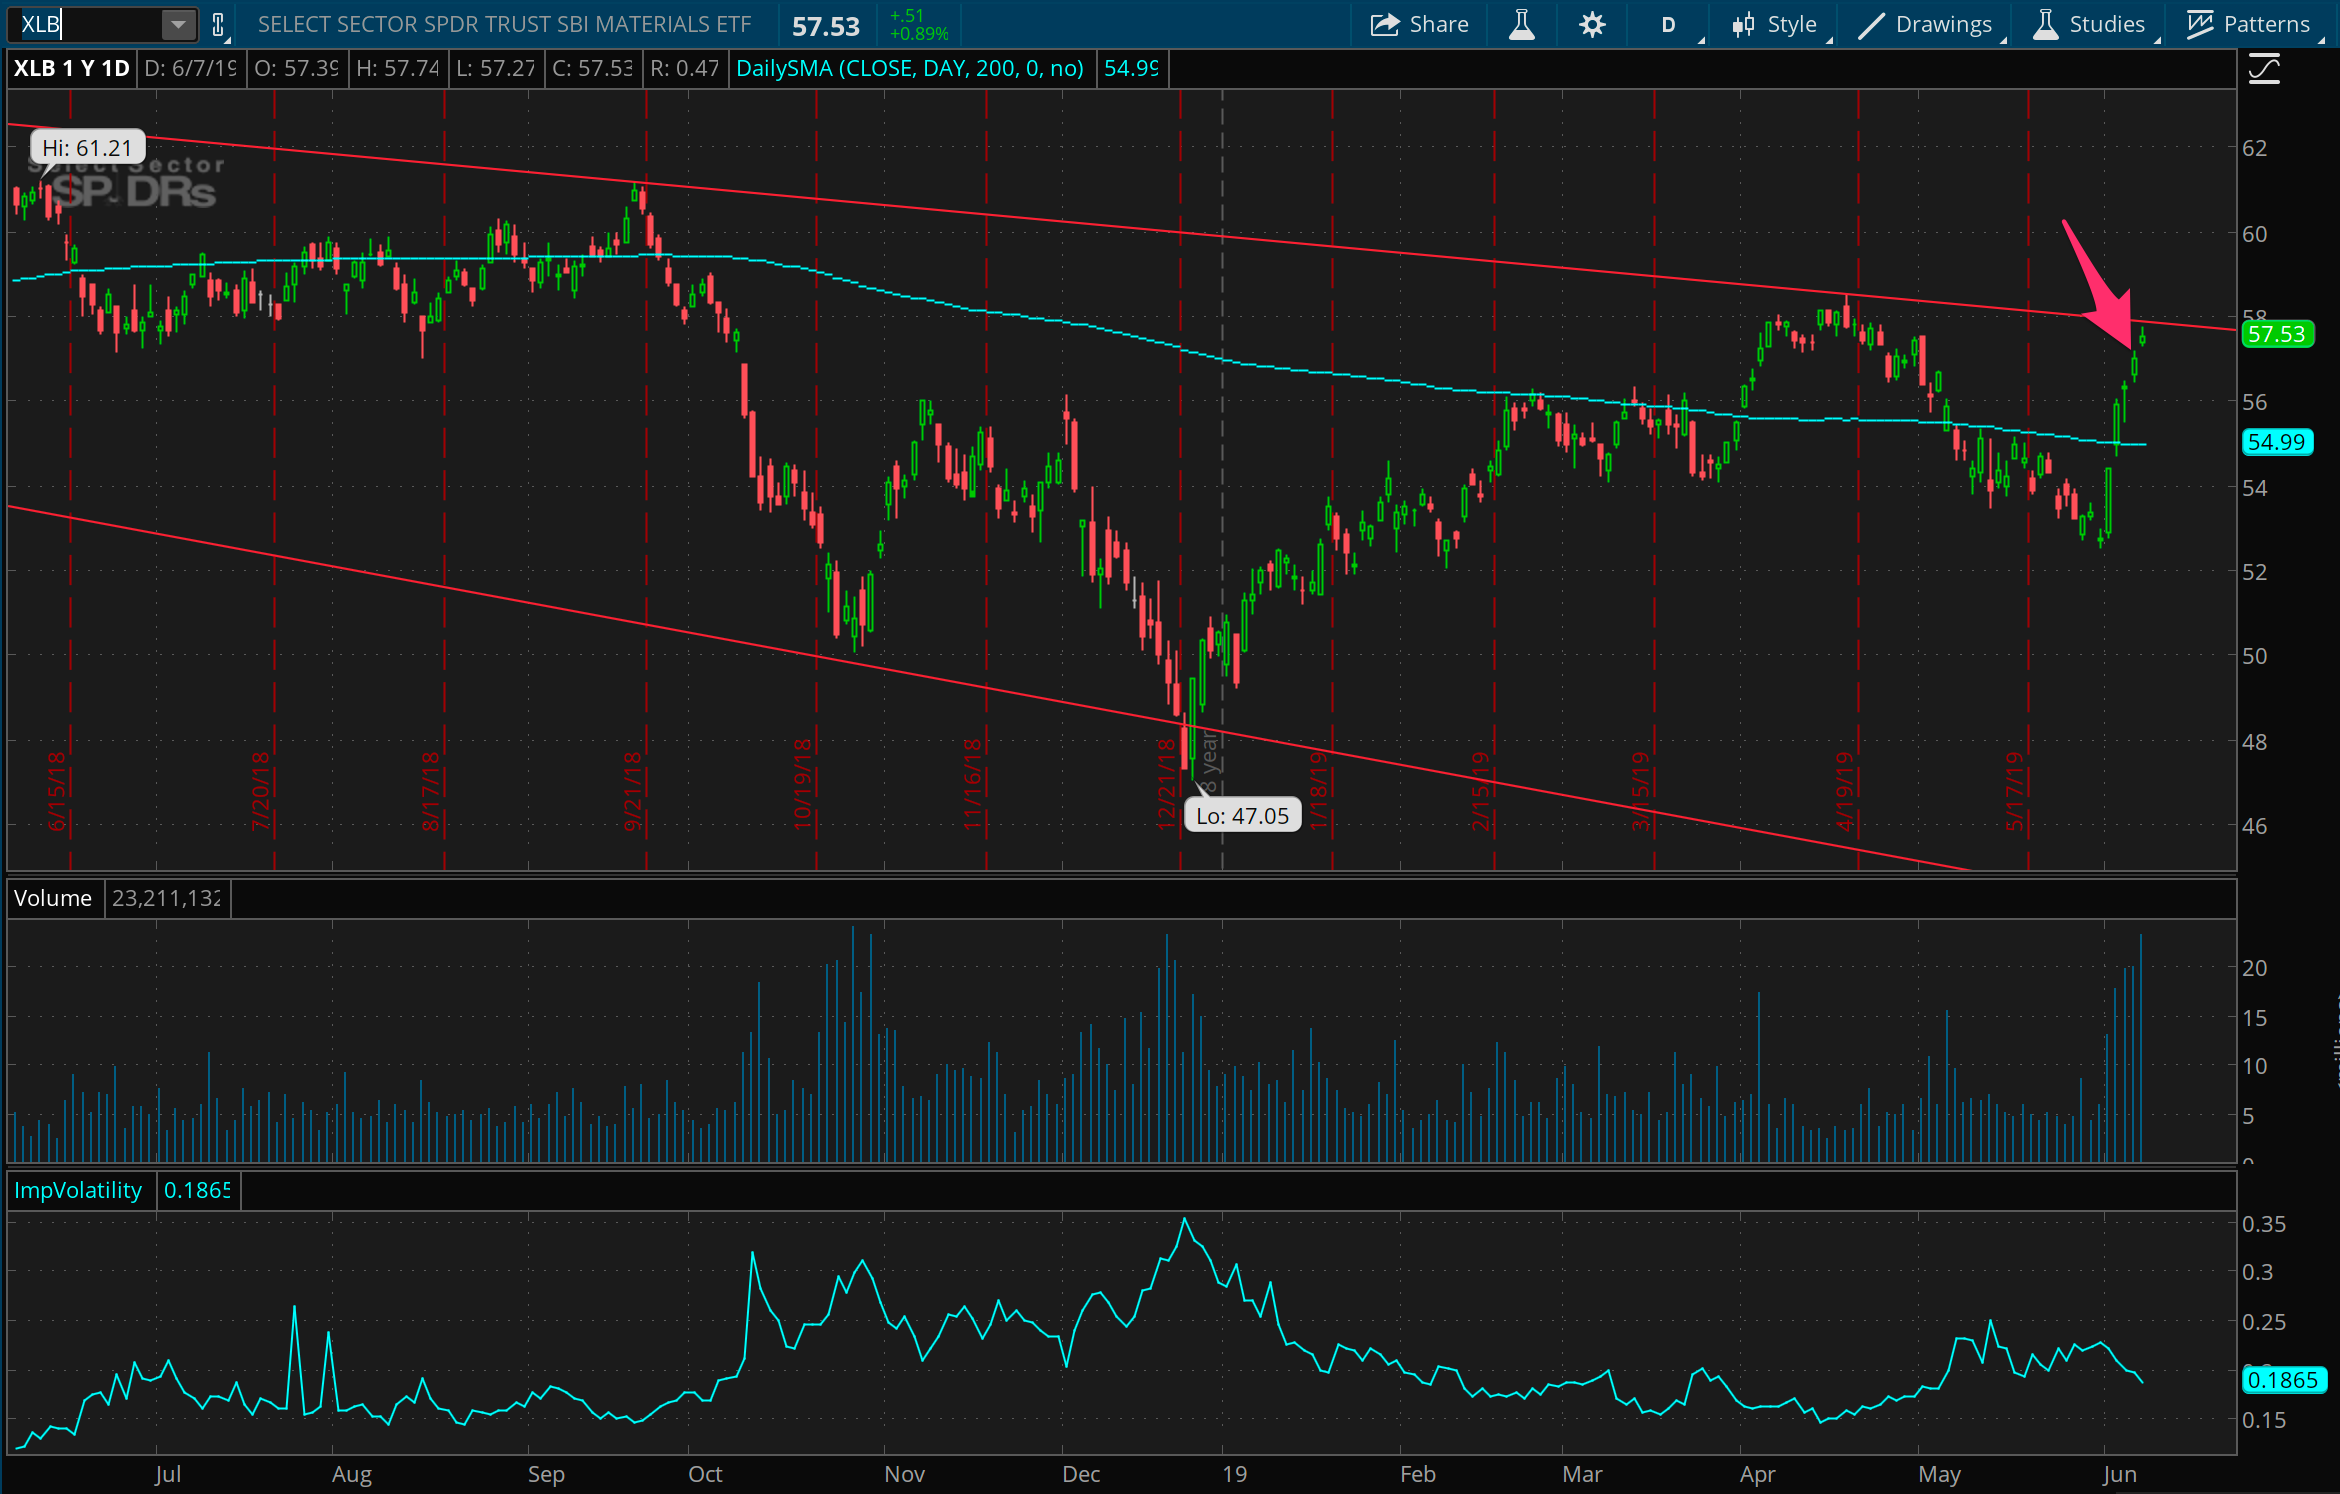
I started eyeing the SPDR materials ETF for a short three weeks ago and was tempted to get short right then, but left it sitting, and I’m glad I did, as it’s taken a wild ride this week of almost 10%, a rather crazy move. But look where it’s at, right here around this longer term resistance line. It’s a fantastic place to try out a short here, looking for a pullback to 54, or maybe even quite further. Will be watching this one keenly.
Shorting the sickly XLF
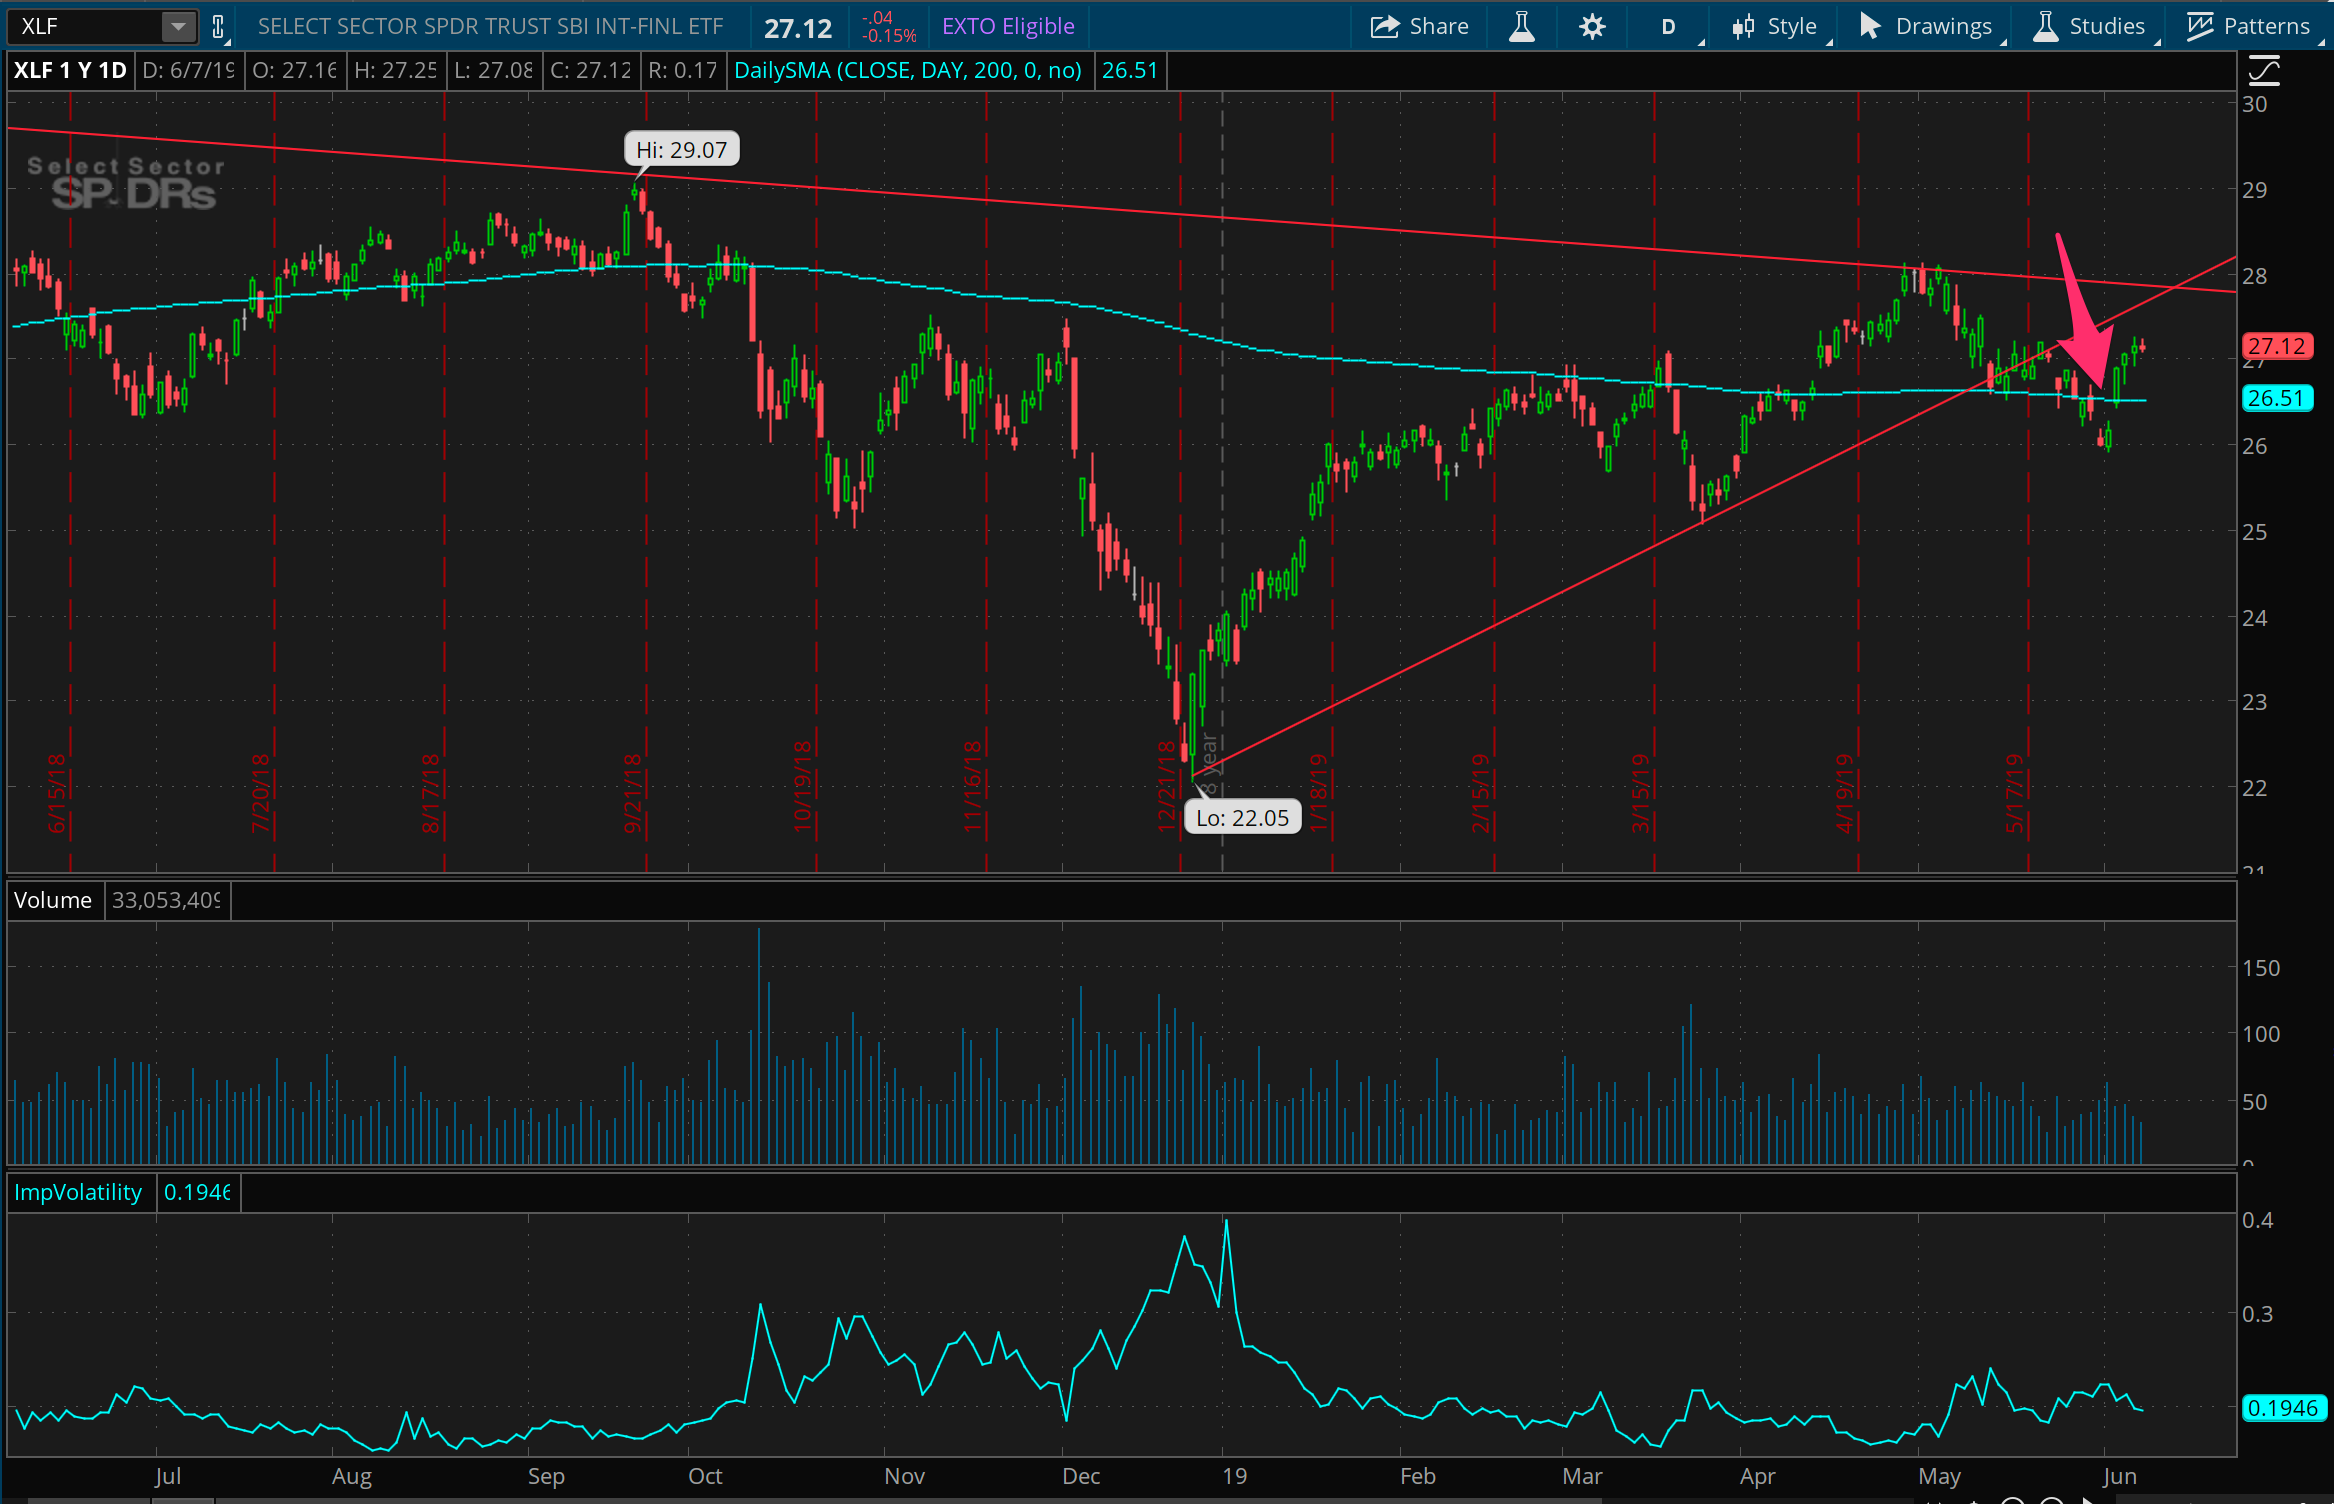
The financials sector clearly looked worse below the 200 day moving average at the beginning of this week than it does now, but it still looks like it has a big uphill battle to move into an uptrend. It did underpace the overall market a bit, especially today, being down while the broad market rose 1%. I entered a short trade on this around Monday, with some defined risk, and it’s moved against me with a strong market this week, but this could definitely drop further and faster if we move lower across the board next week.
Bitcoin, still, WTF?
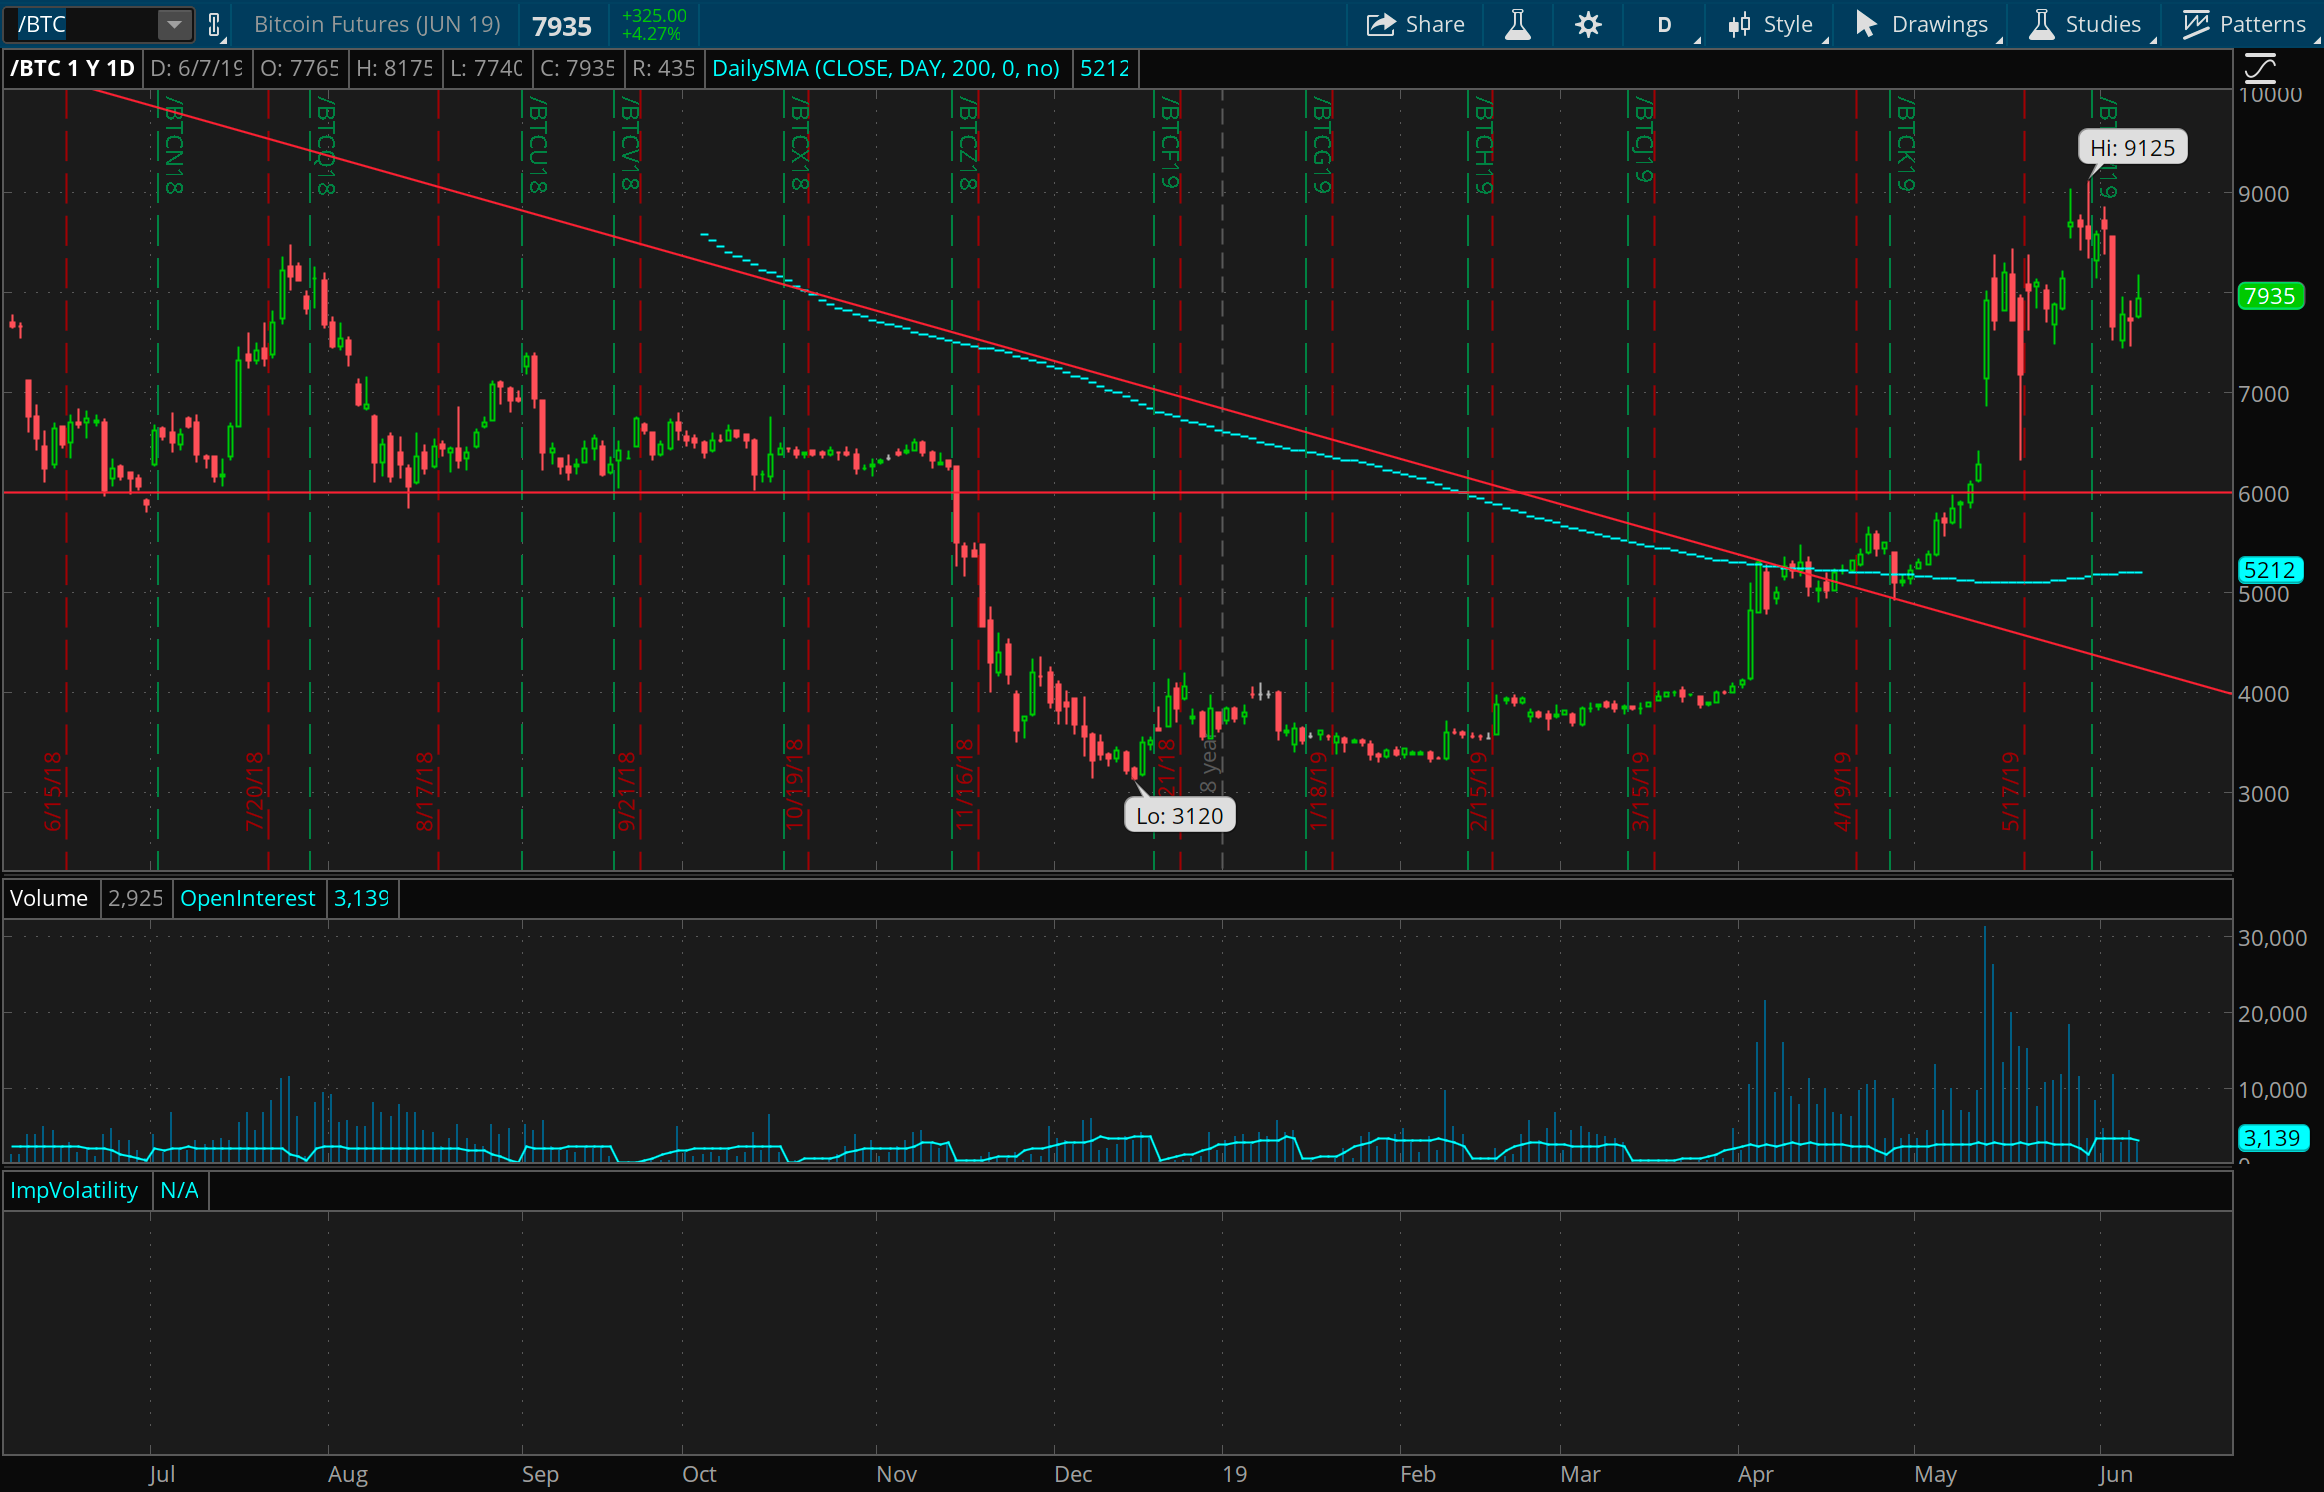
I thought it would be interesting to check back in on Bitcoin here. The really big thing of note here is the increased volume in the futures market for Bitcoin. That’s actually a very promising sign for the future of Bitcoin in my eyes, if there is a more active and liquid market for it on a public futures exchange. Who knows, maybe there will be even be options on Bitcoin futures at some point, which makes it a more plausible place to come place some trades for me. In the meantime, I would just note that there’s a ton of short term actual volatility here, which could mean a lot of good scalping opportunities for traders braver than I.
AAPL, where are you going?
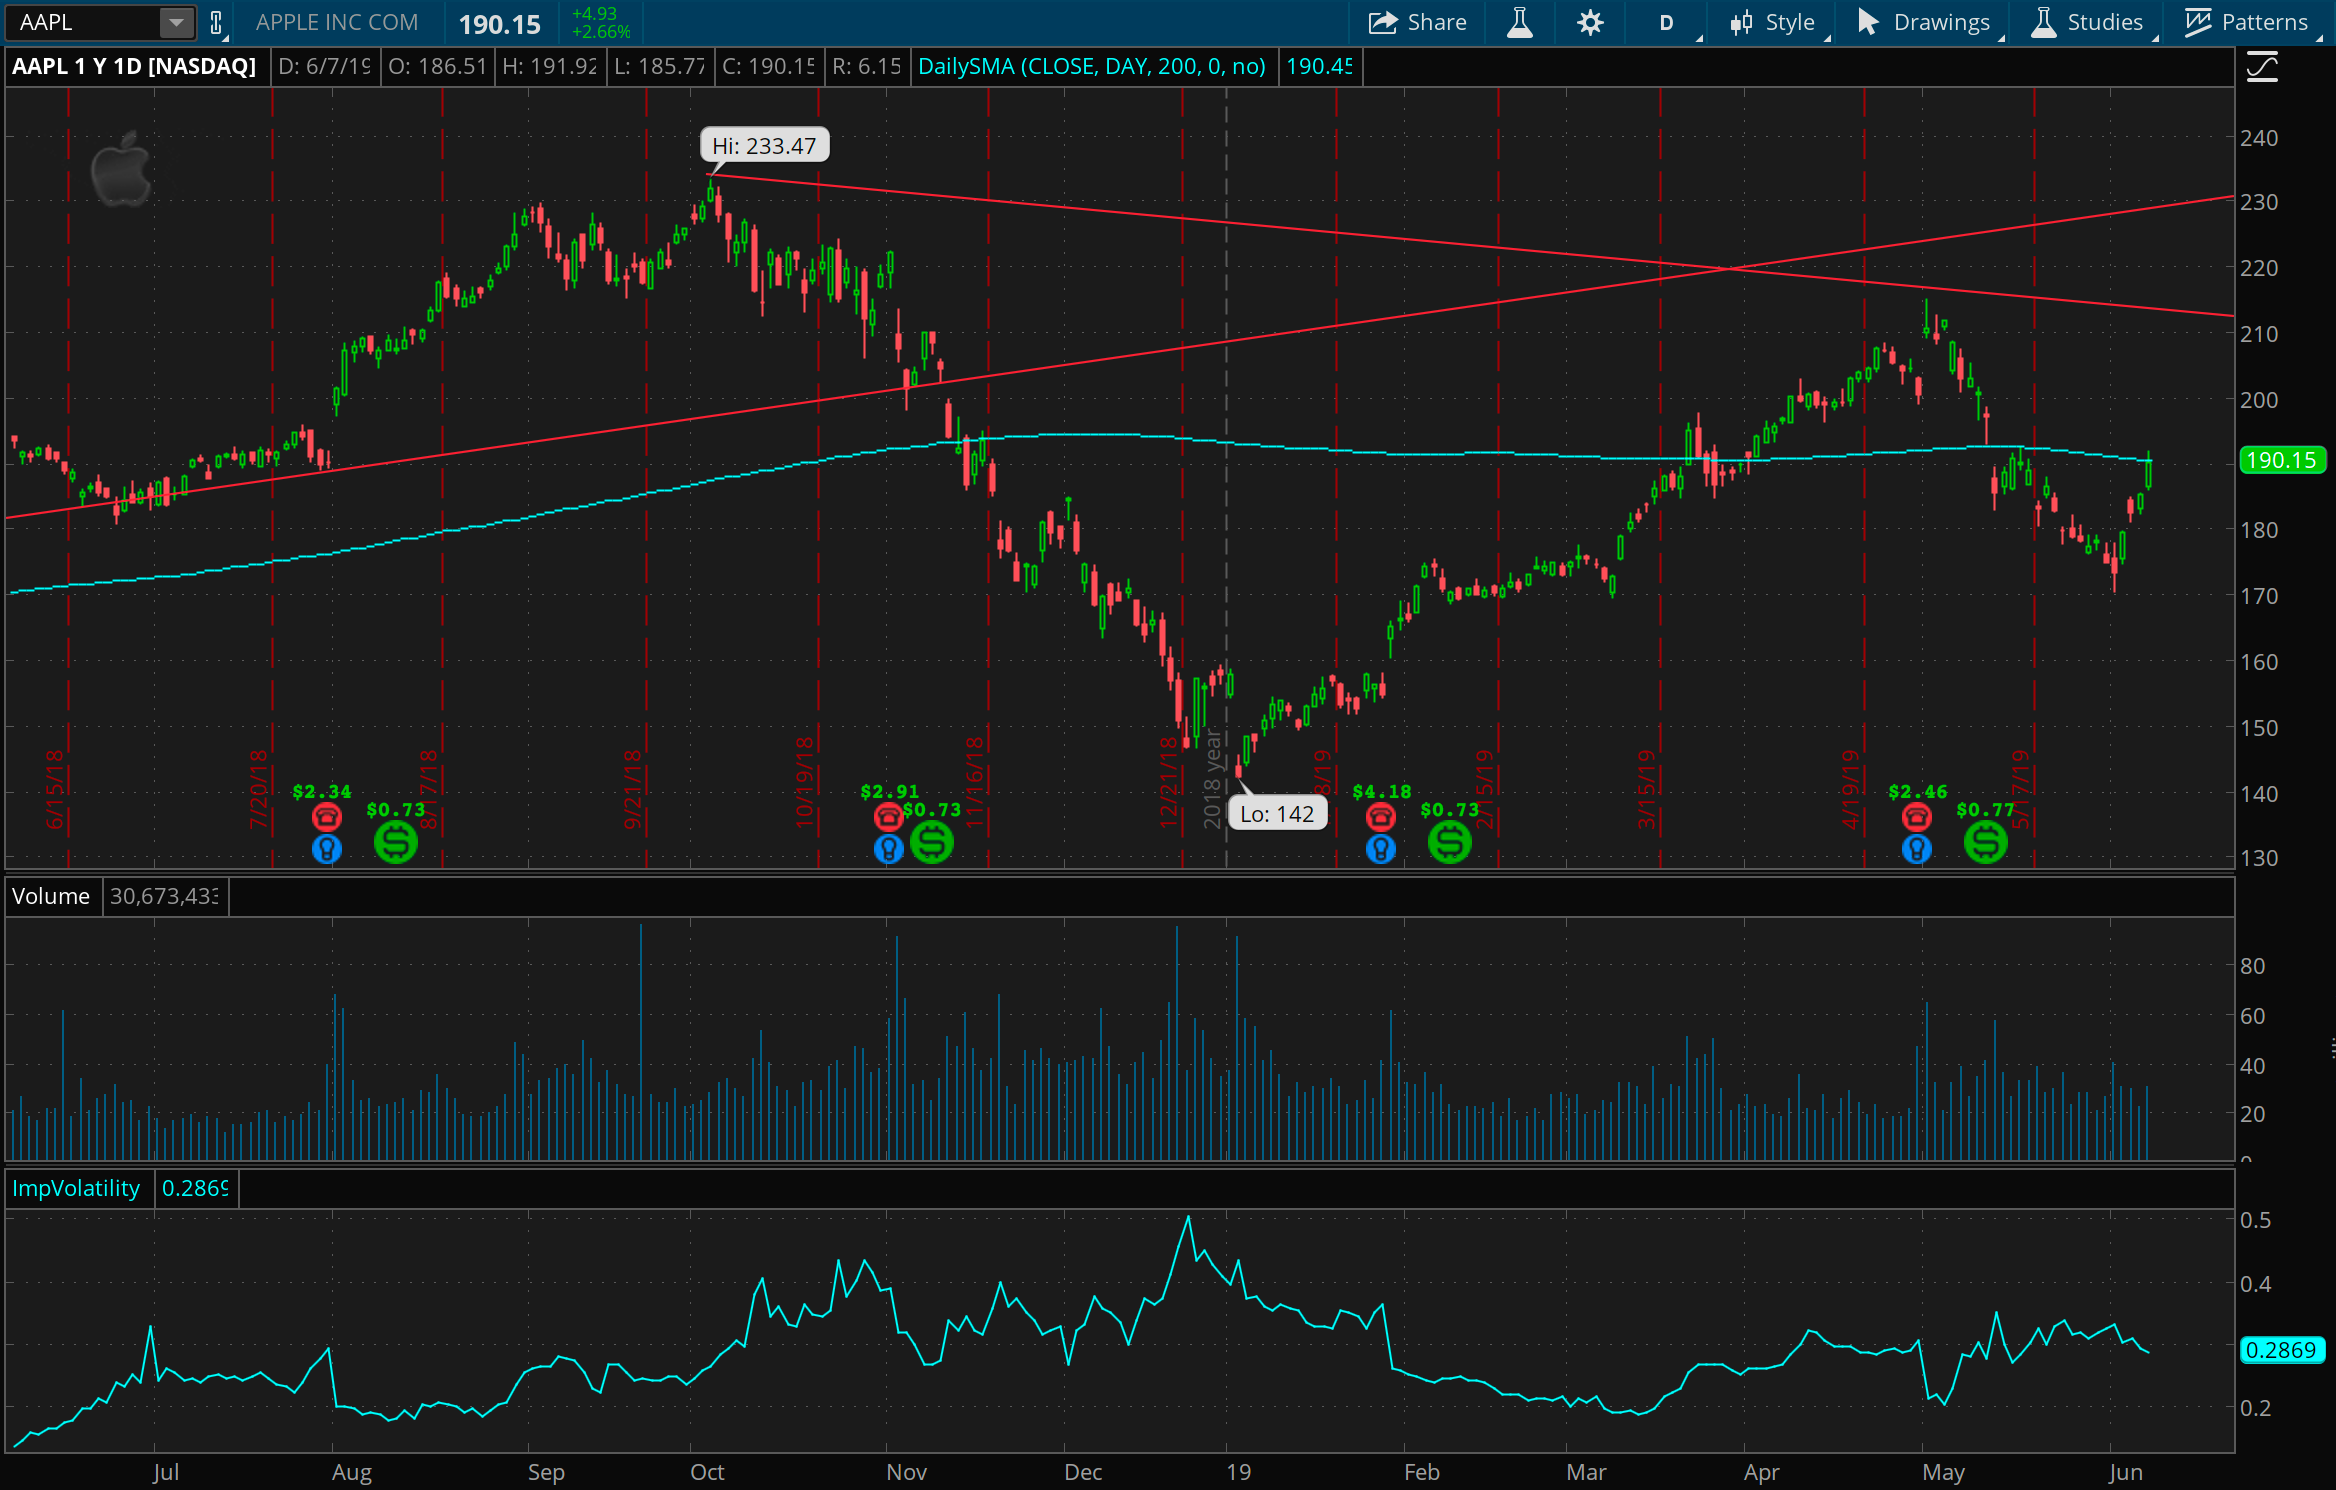
Apple is a harder read than I thought it would be back at 190. I still think Apple has a troubled outlook for the next many months, but in the immediate term, it feels more like it’s anyone’s guess whether it’s headed up towards 210 first, or 170. Maybe it’s worth putting on something neutral here if that’s true, but I think I’d rather see it rise first and put on a new short trade then.