The SPY’s lofty lull
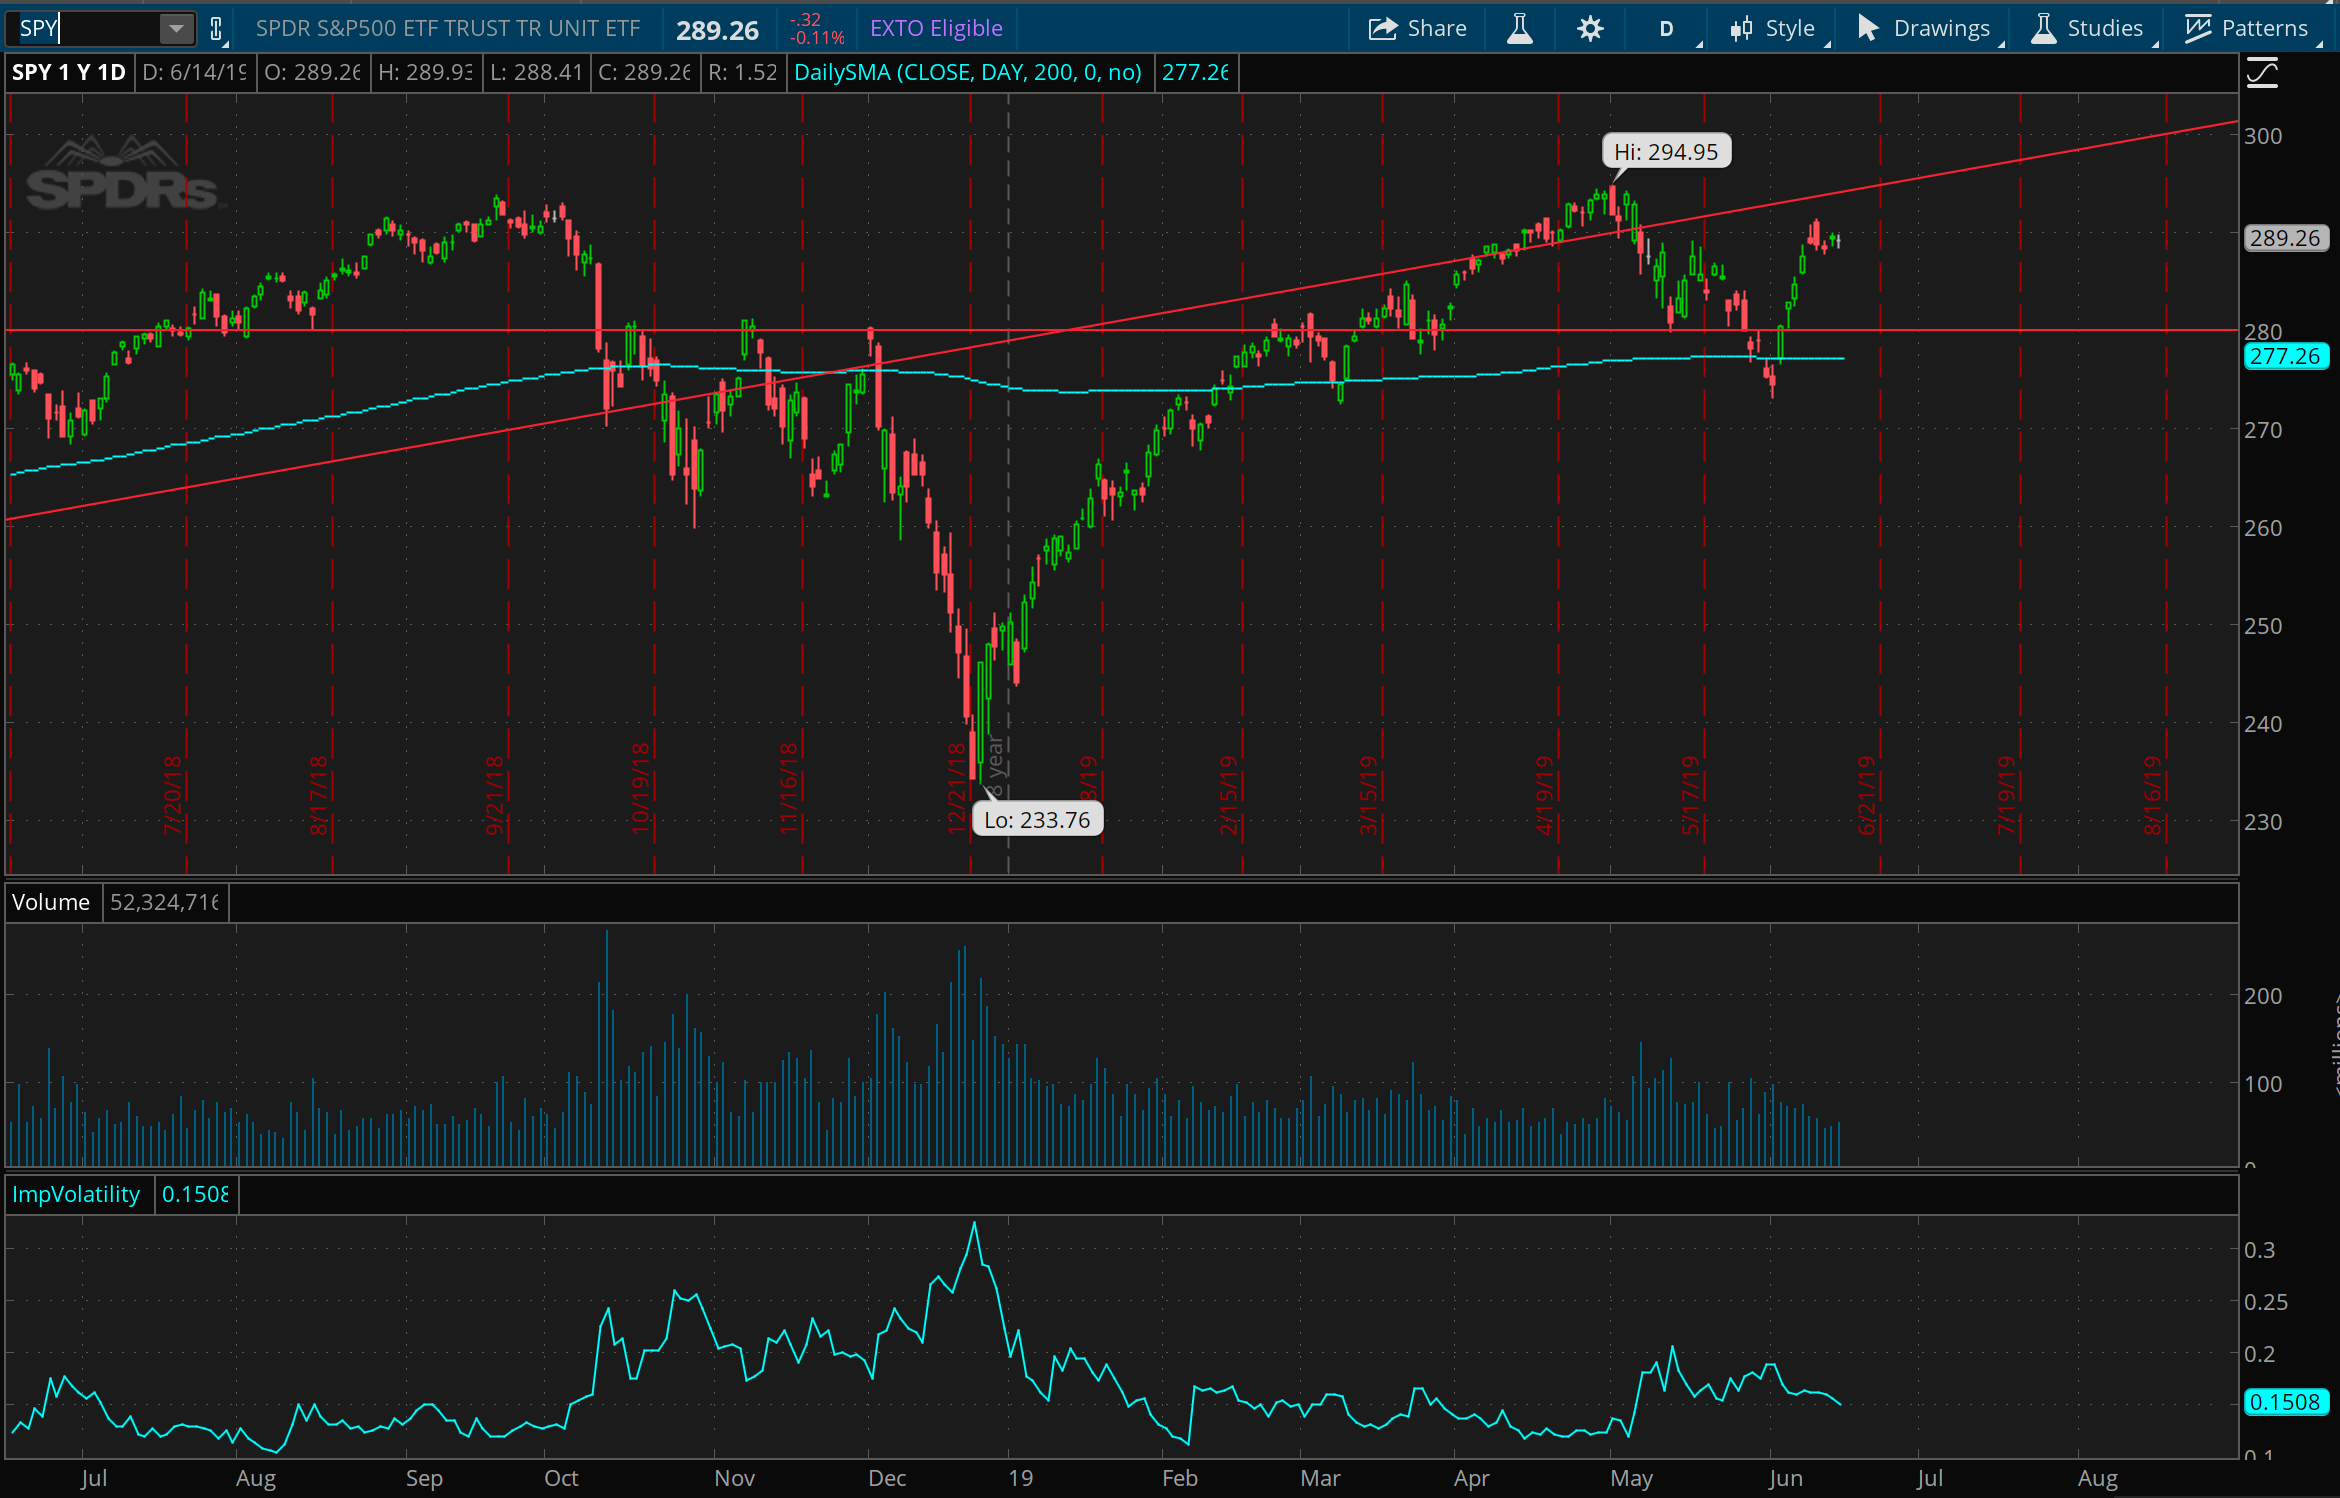
After the monster truck rally last week in the broad market, this week was a grinding lull, with SPY nearly unchanged over the past 5 trading days. Like last week, I am still thinking sideways or downside is far more likely than further upside, but that said there is some overhead space left up towards 295.
The USO saga continues
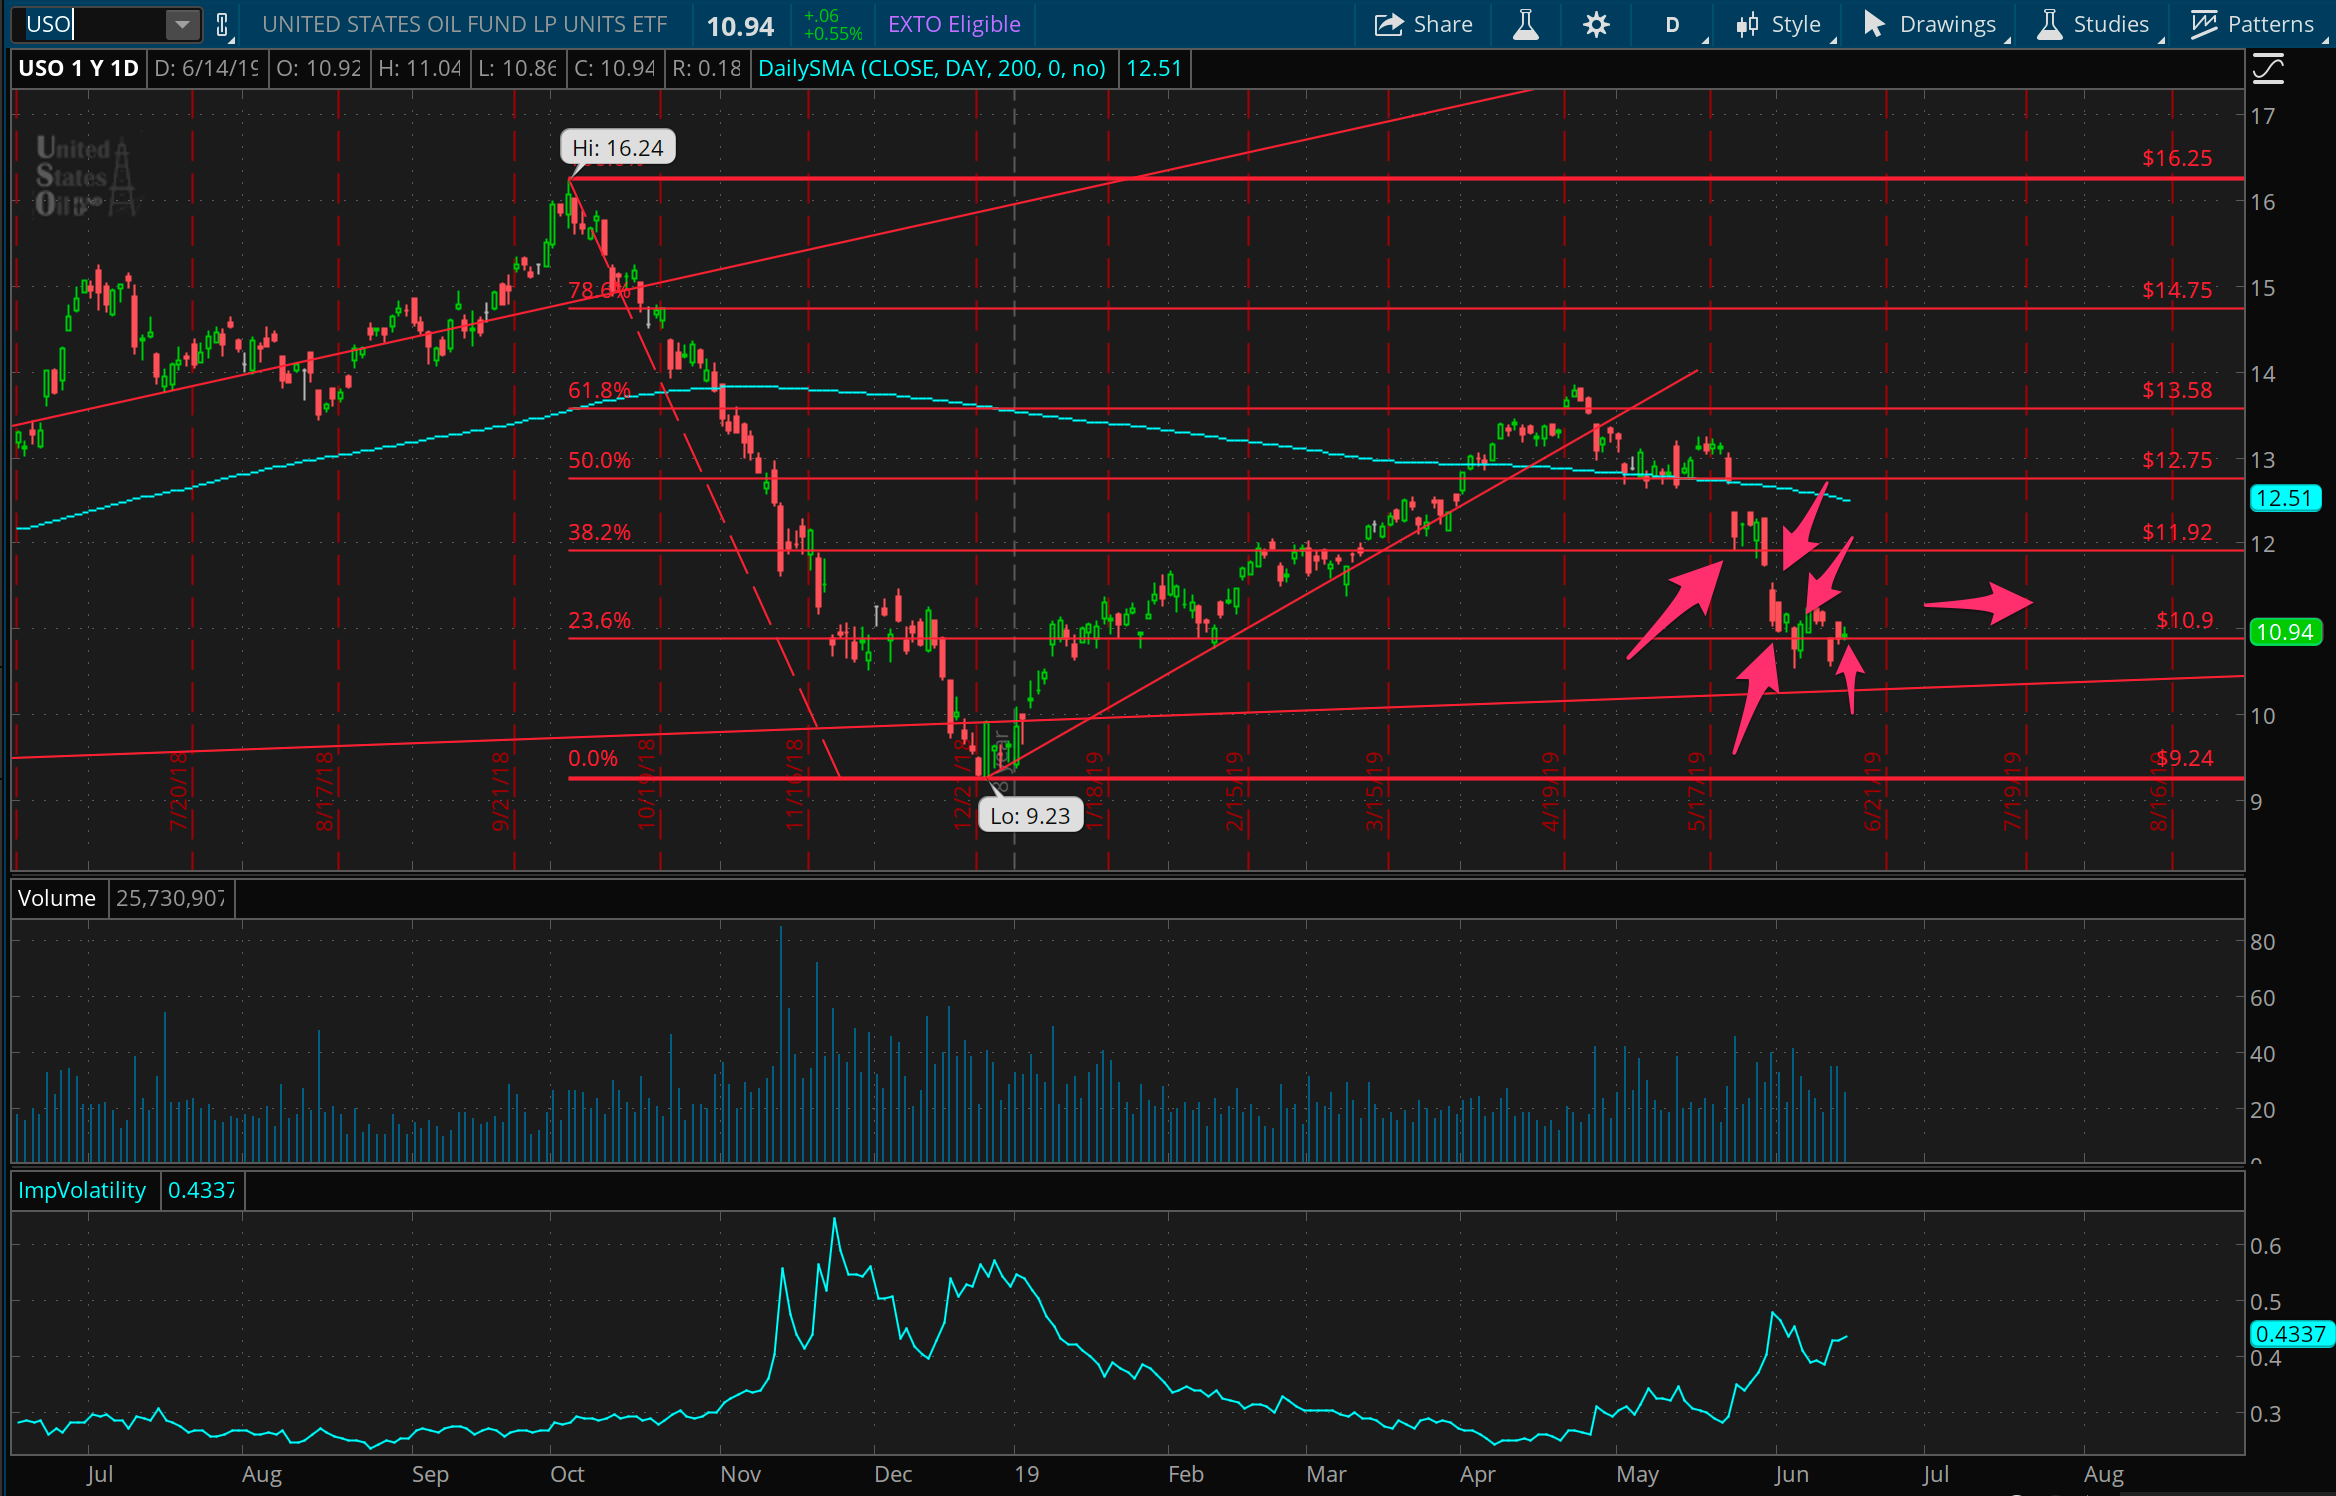
Doing my best to stay with oil prices as they continue to bounce around and threaten to move lower. After various trades over the past few weeks, I continued this week by adding more weight to bets that we’ll see some upside in prices, while taking off some trades on overhead resistance, to lean further into the possibility of a bounce. Also, I rolled everything out (i.e. option expirations, from June to July) to add some time to the trade.
Builders fighting resistance
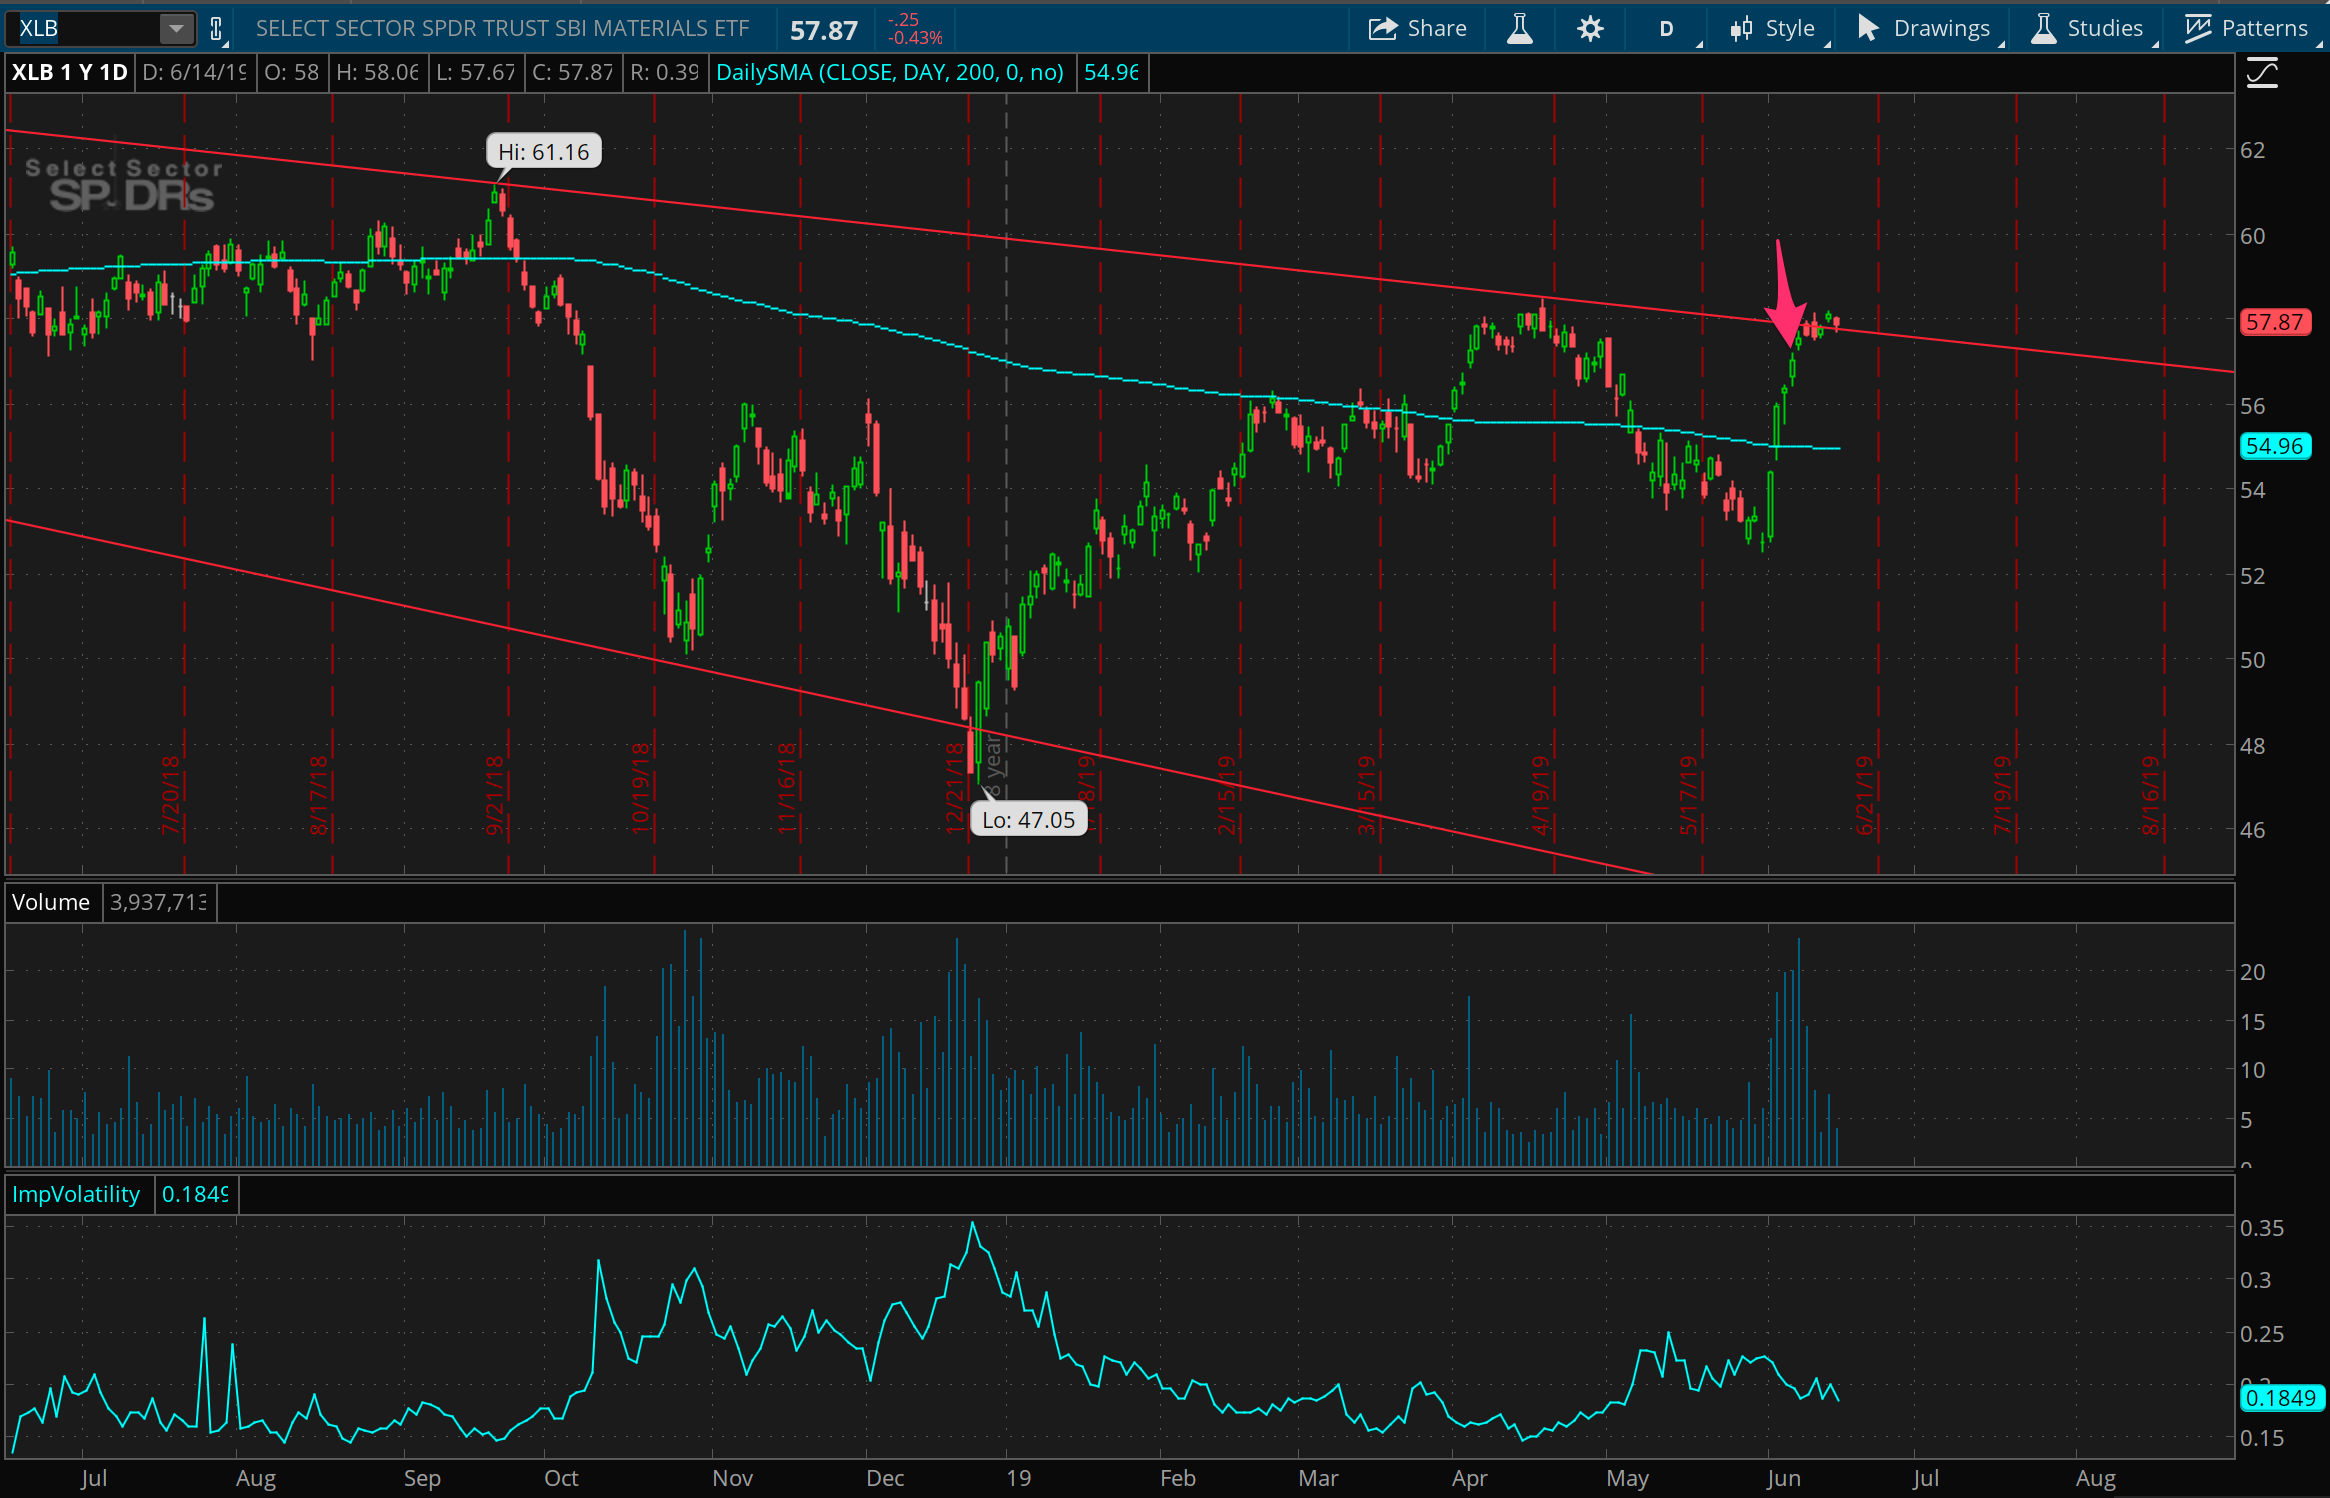
This week’s price action didn’t especially help out the short trade in XLB I put on last week, but it didn’t destroy the thesis of the trade either. There is still a big long running downward trend that we’re at the very high side of here, and generally I still very much love this trade. It is almost certainly doomed to be a bad trade, based on how much love and conviction I have for it. This is essentially a flat out short position, so I’m looking for as much downside as I can squeeze out of this, but it will hinge on the broad market’s direction most likely.
And then, the financials
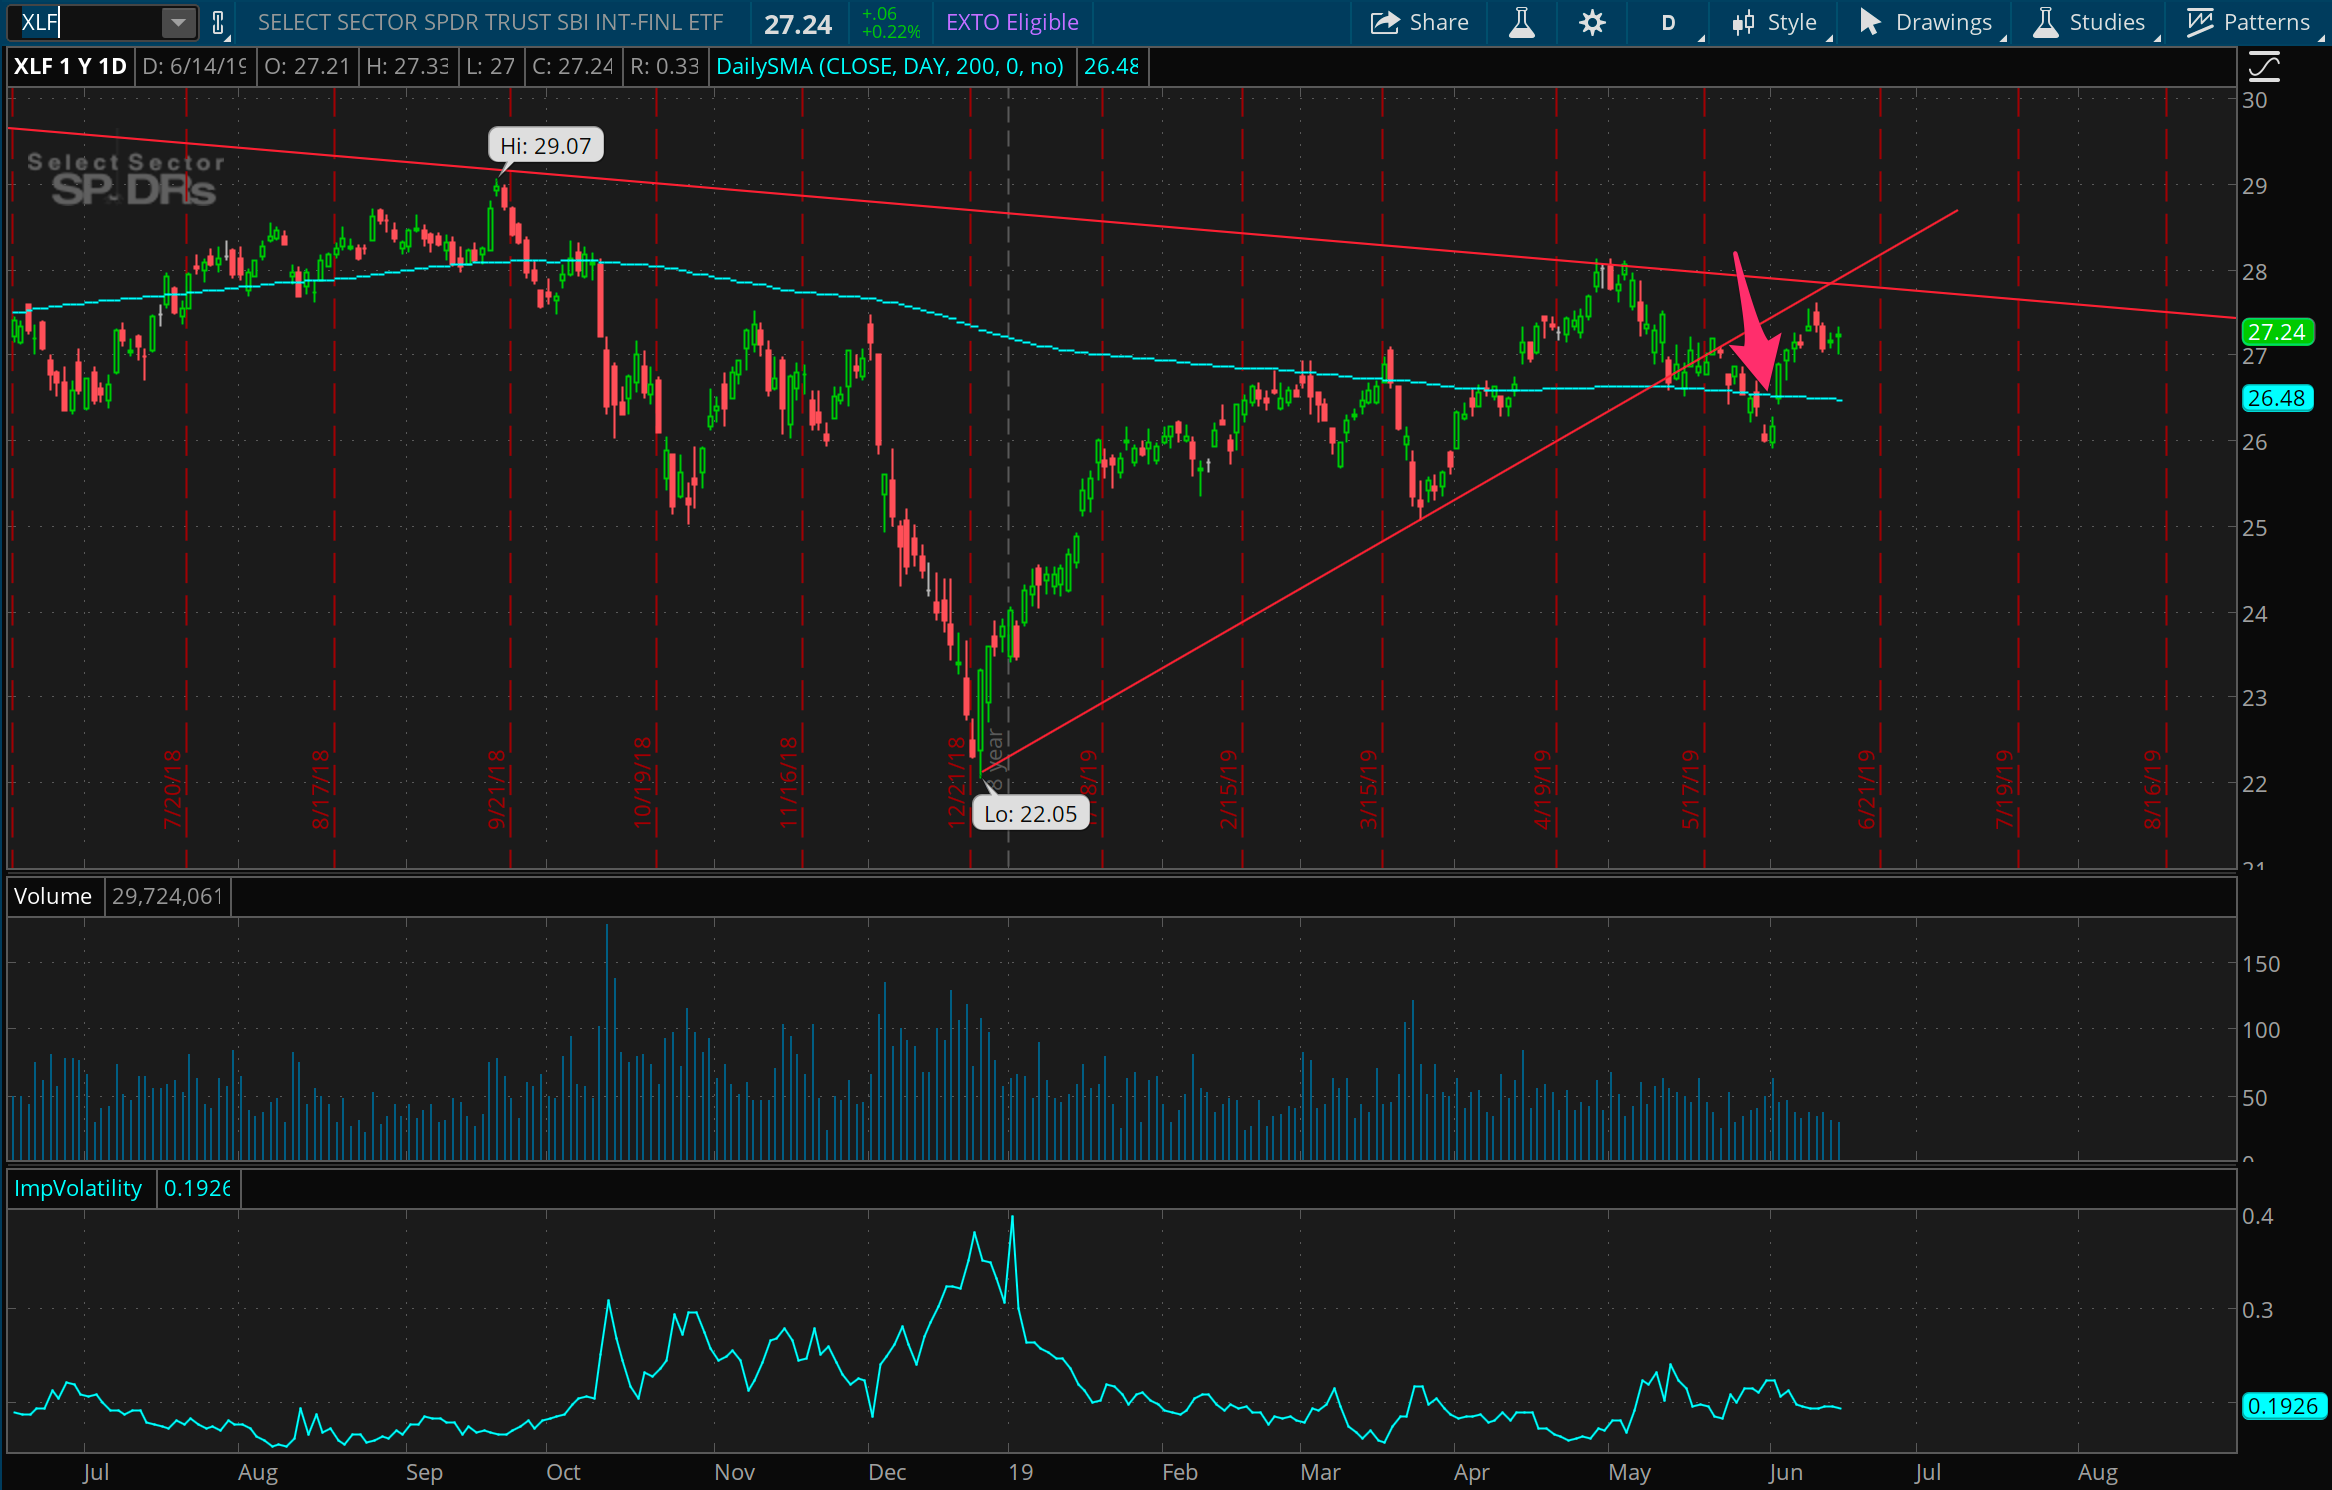
There’s a similar story as above in XLF here: A long running downward trend, with prices near the high end edging close to that resistance. I certainly got eager on this trade and had it move against me last week, but this week was just a passing of time. This is a less aggressive short than XLB above, so generally just looking for prices to get under 26, rather than crash. Either way, keeping this one on.
NFLX’s home is on the range
It’s uncanny how much NFLX has stayed in the range I saw back in early May. It’s right at the bottom of that range now, around the 340 level, and I’m cursing myself I didn’t actually get a support trade on here by the time I saw this. I’ll have to wait for next week and see if I can still put in a defined risk trade for the upside back up in the range. Otherwise will be waiting out on the other side of it with a short trade. We’ll see how long this range lasts, but I’m sensing it’ll ultimately break lower not higher out of it.
TWTR at the line in the sand
Twitter is sitting right here at what I think is the line in the sand for it’s price, 36. It fell dramatically under this price on a surprise earnings miss 1 year ago, and tried 5 different times to move back above that level since, just recently succeeding, and arguably flipping resistance over to support. But! Just look at it. It looks… heavy. The real line may be 35 not 36, but either way, the big drop under 35 must be shaking confidence for some, even if it was only for a day. I’m now thinking the Twitter trade is to get long at 30, not 35.
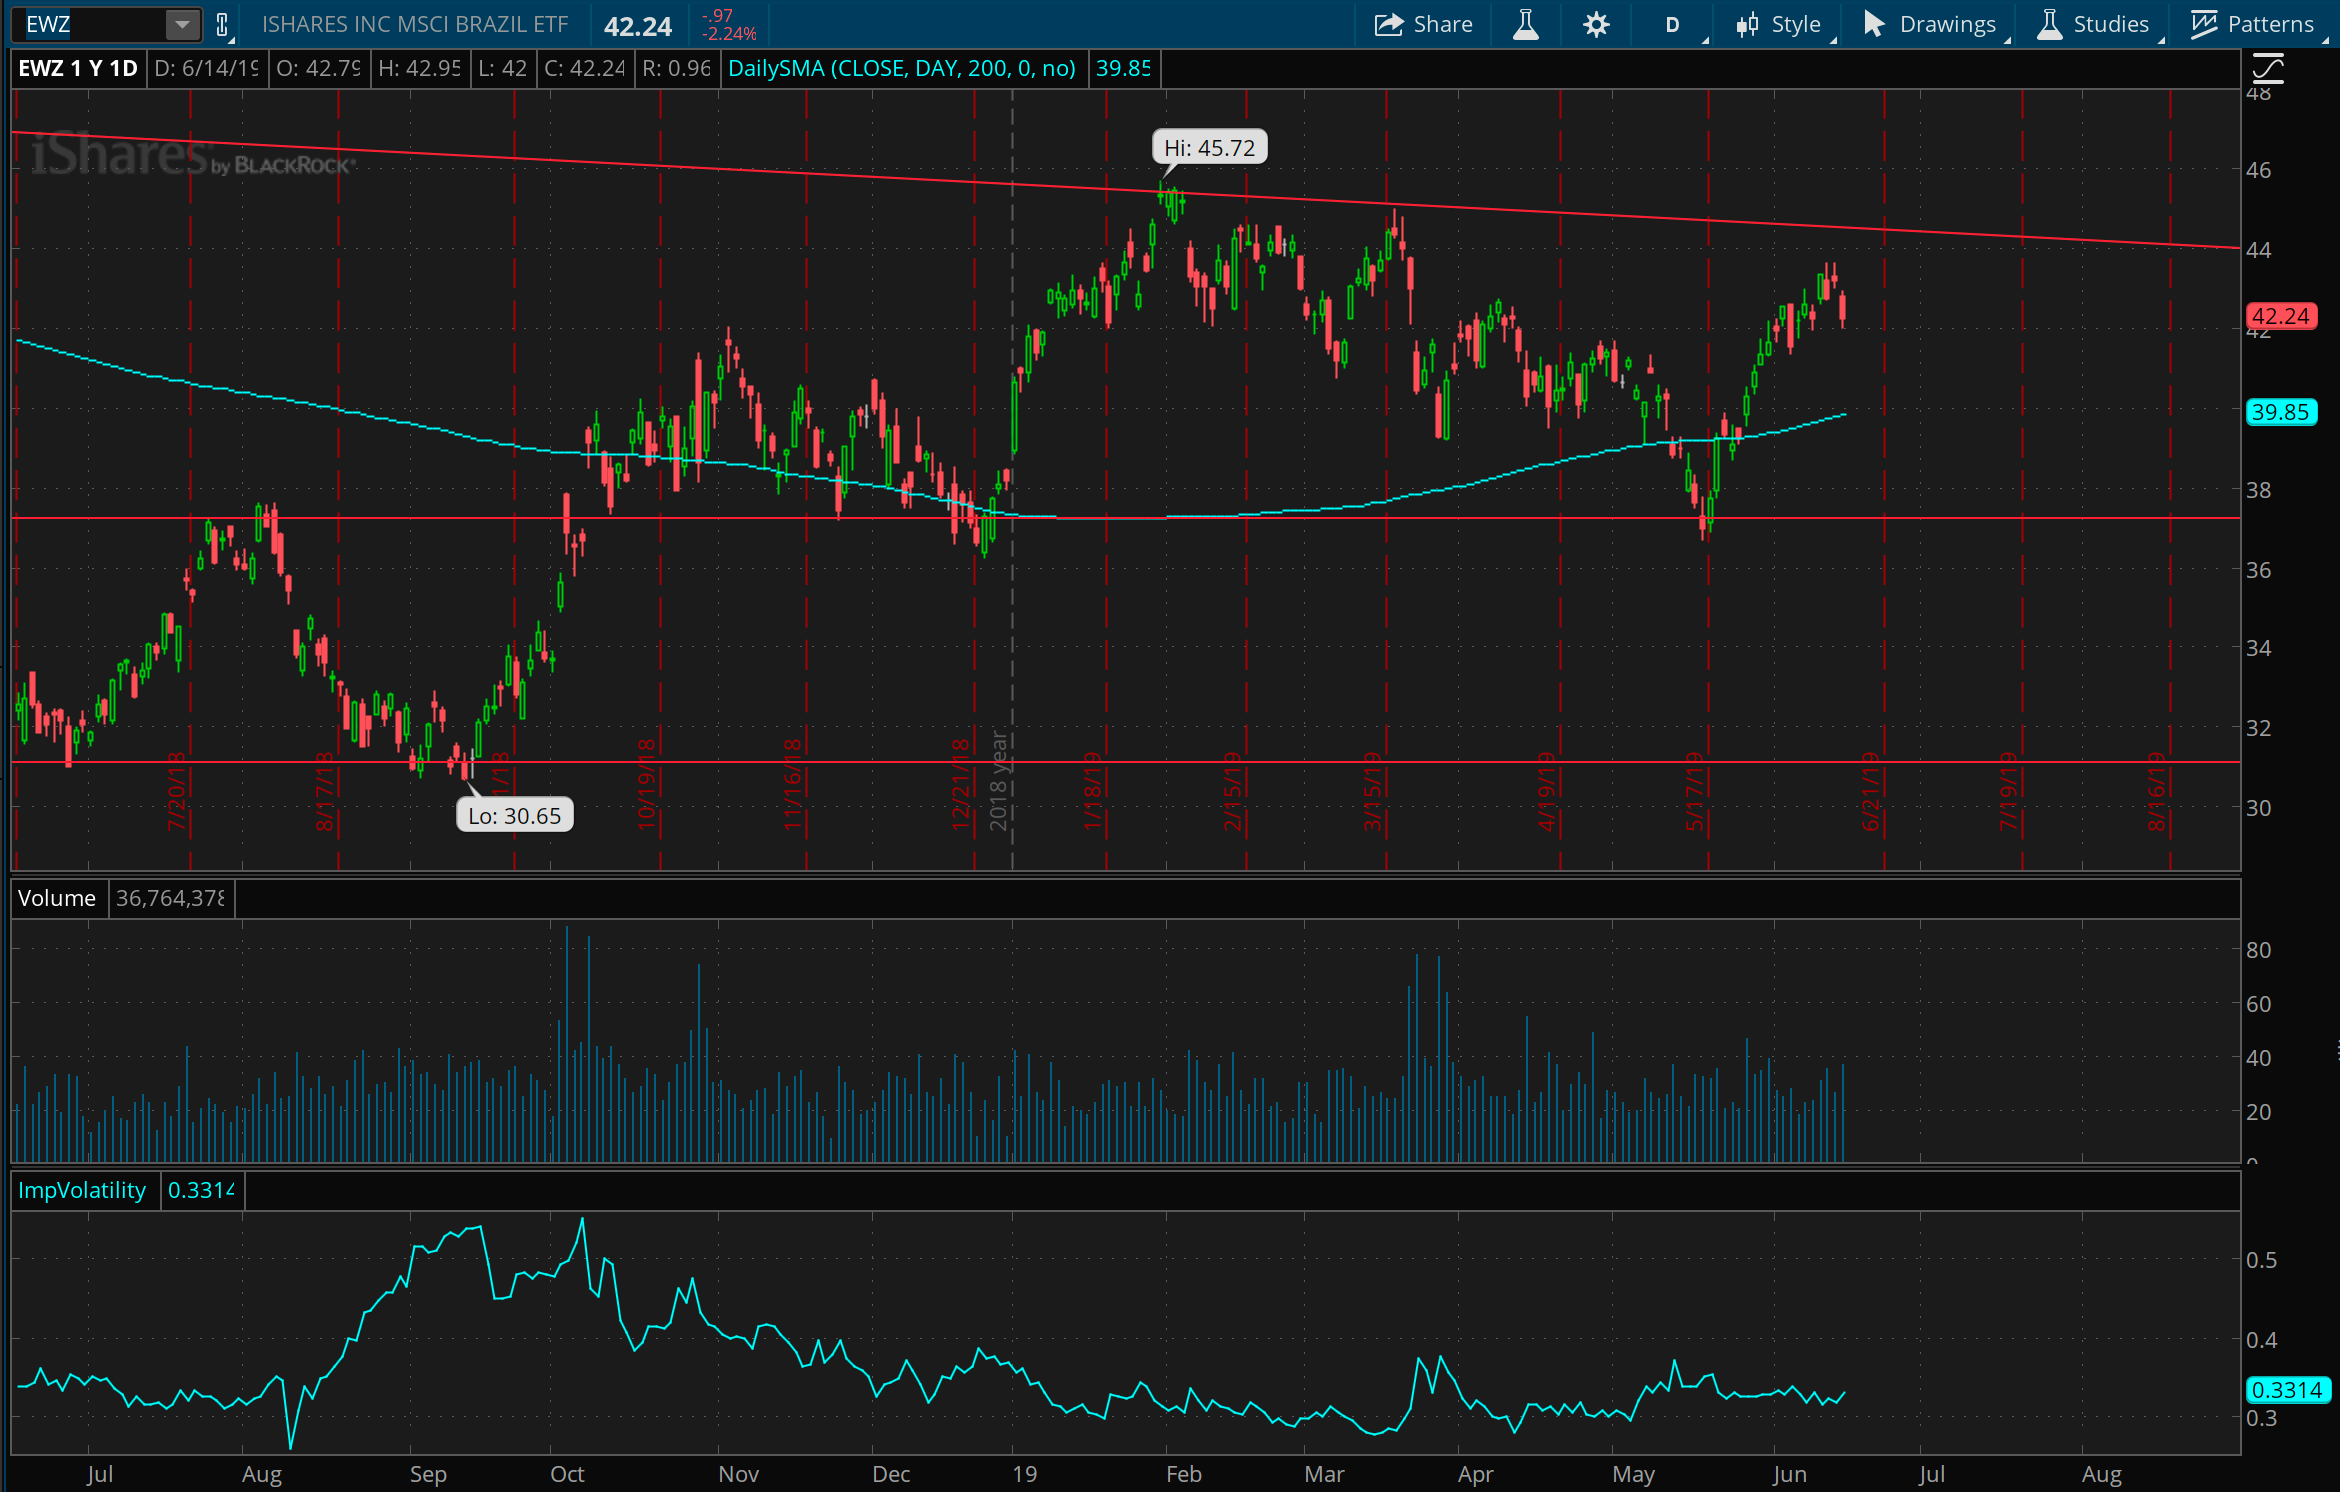
And now a Brazil breather?
After snagging a beautiful Brazilian bounce a few weeks ago, it looks like the Brazil ETF, EWZ, might be ready to hit resistance and head the other way. Keeping an eye out for a good chance to get short around 44 on this, after sadly missing my chance to do that earlier this week. Time to start setting alerts for these setups, as early as I can see them.
