Brazilian bounce?
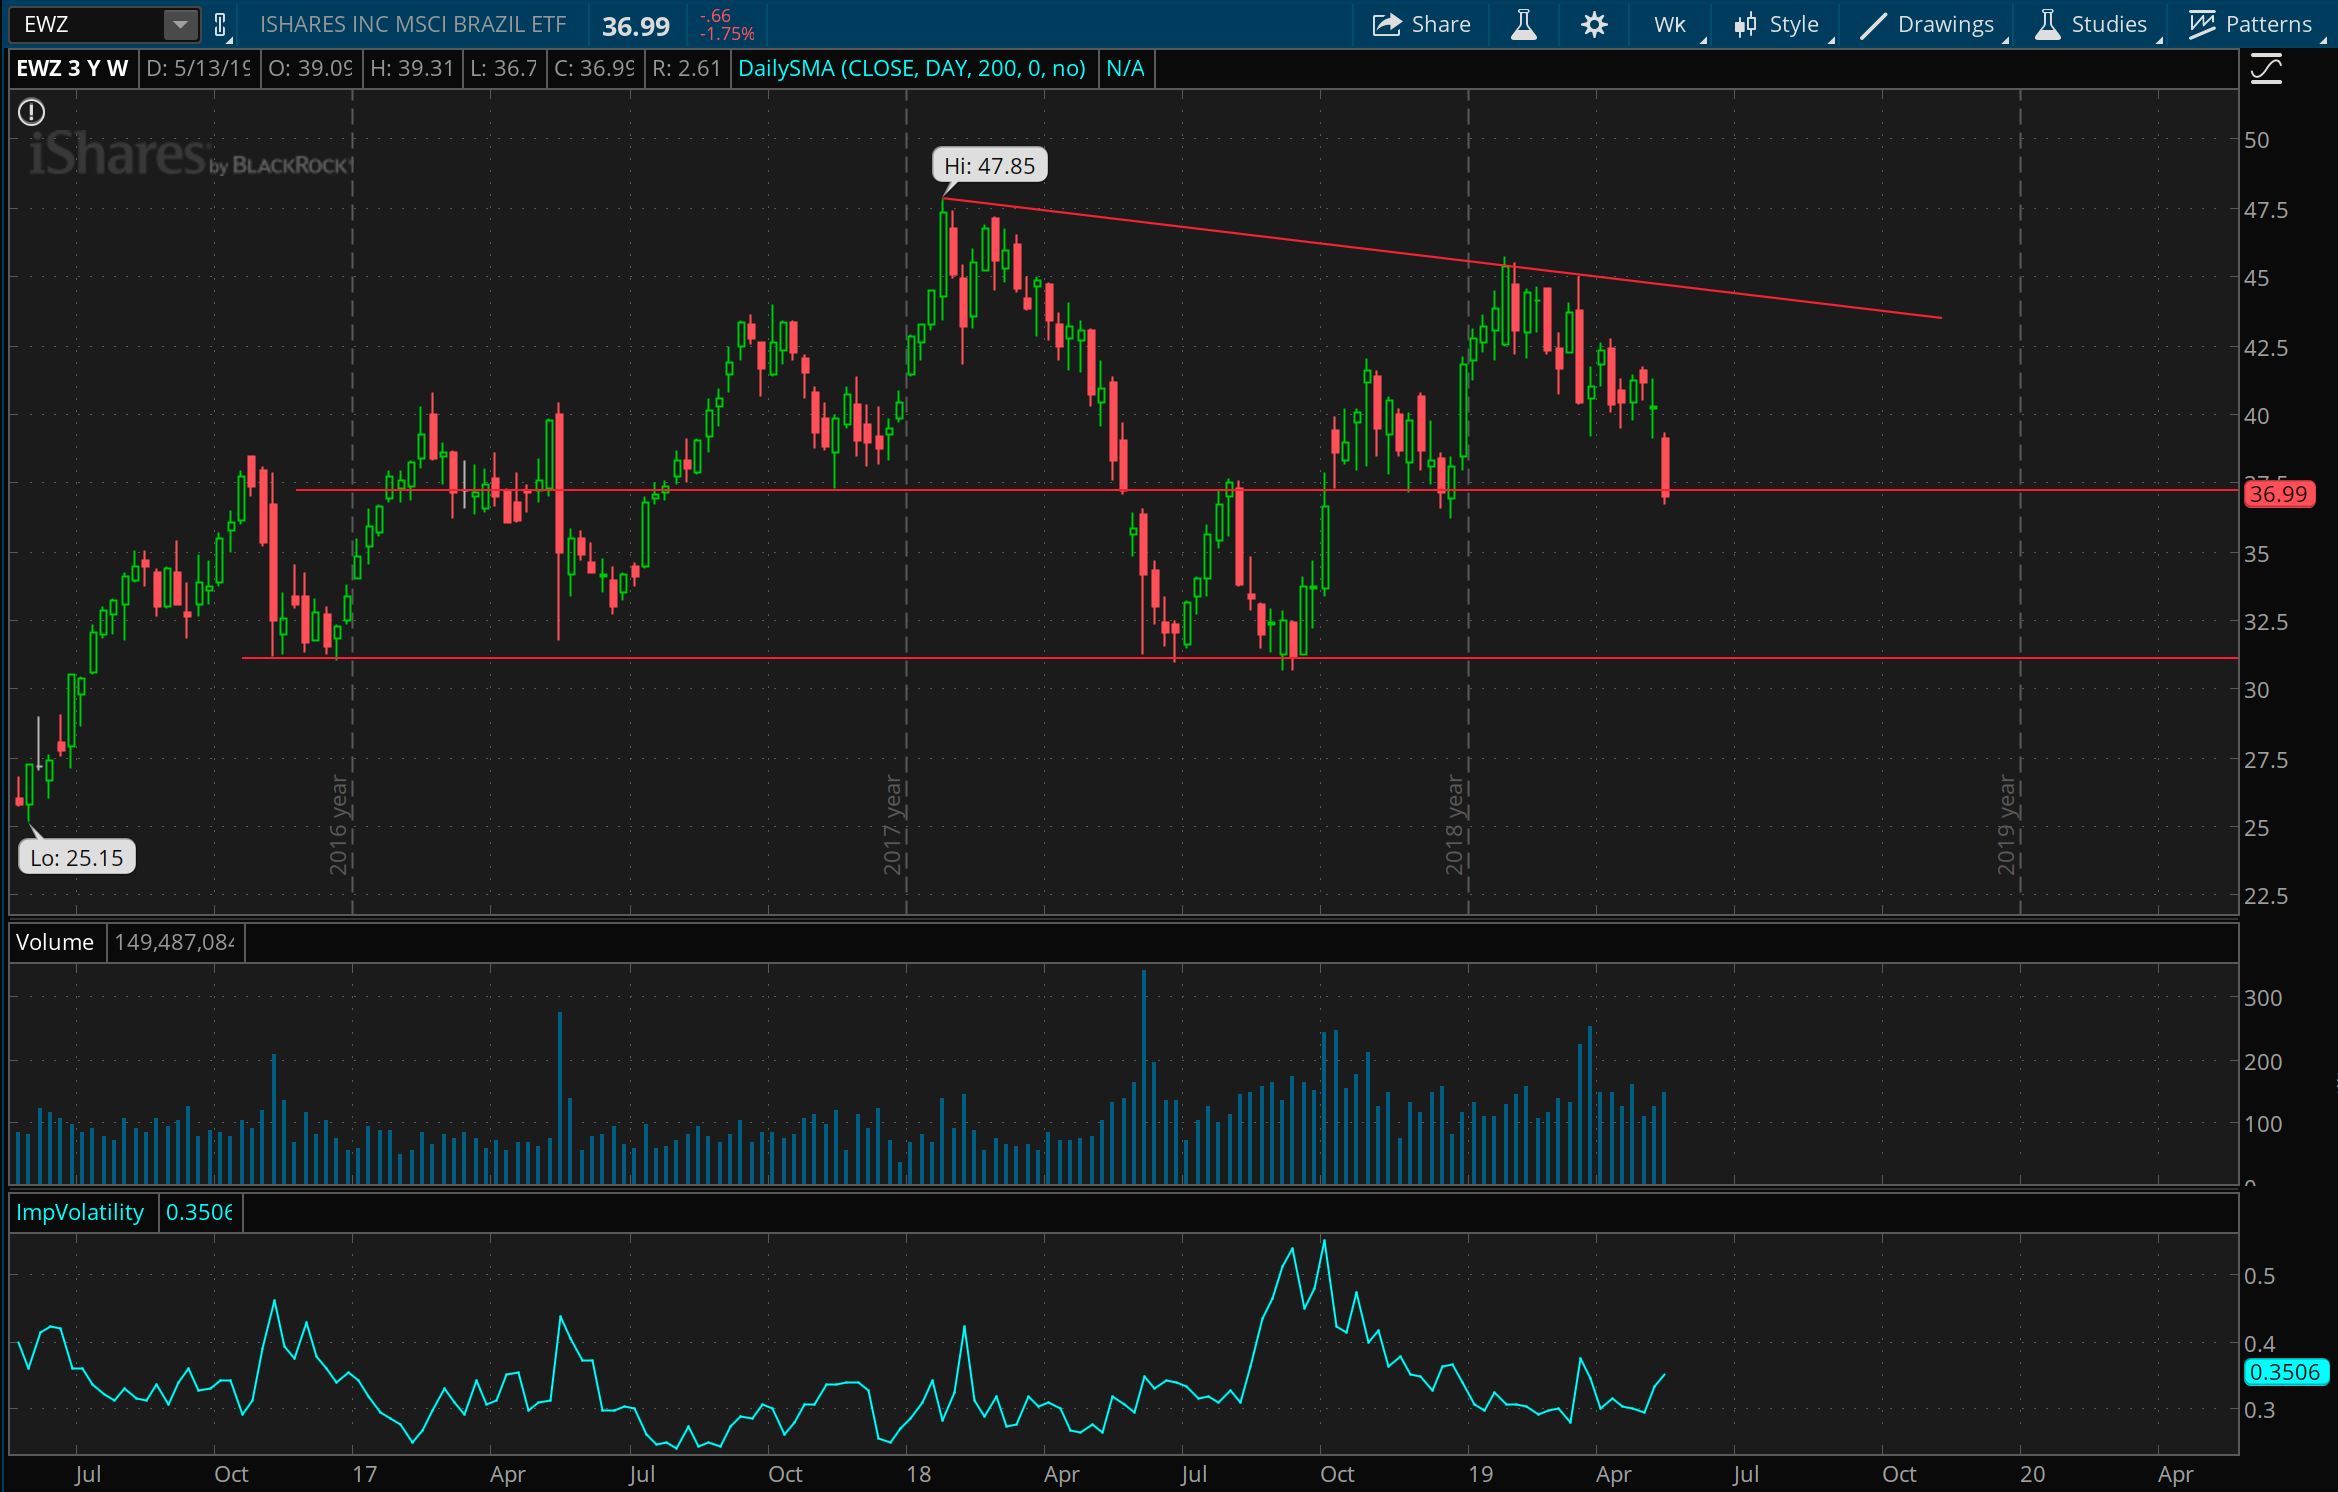
Here’s a 3 year weekly look at the Brazil ETF, EWZ. Brazil has been through a lot of political turmoil over the past few years but may be stabilizing. At any rate, the chart tells us the real story of investor sentiment. Here we see the price hitting an important historical level @ 37. There’s an overhead downward trend but overall just a big range it’s been bound in for years.

A closer look at EWZ via the daily chart for the past year. I started betting on support with a 36 put on the 17th (indicated by the red arrow), betting on a bounce or just congestion here for a while. If it moves under 35, I’ll add a call at 36 to reduce the position, and then scale into it at 34 and again at 32 to bet on further support points.
WTF Bitcoin?!
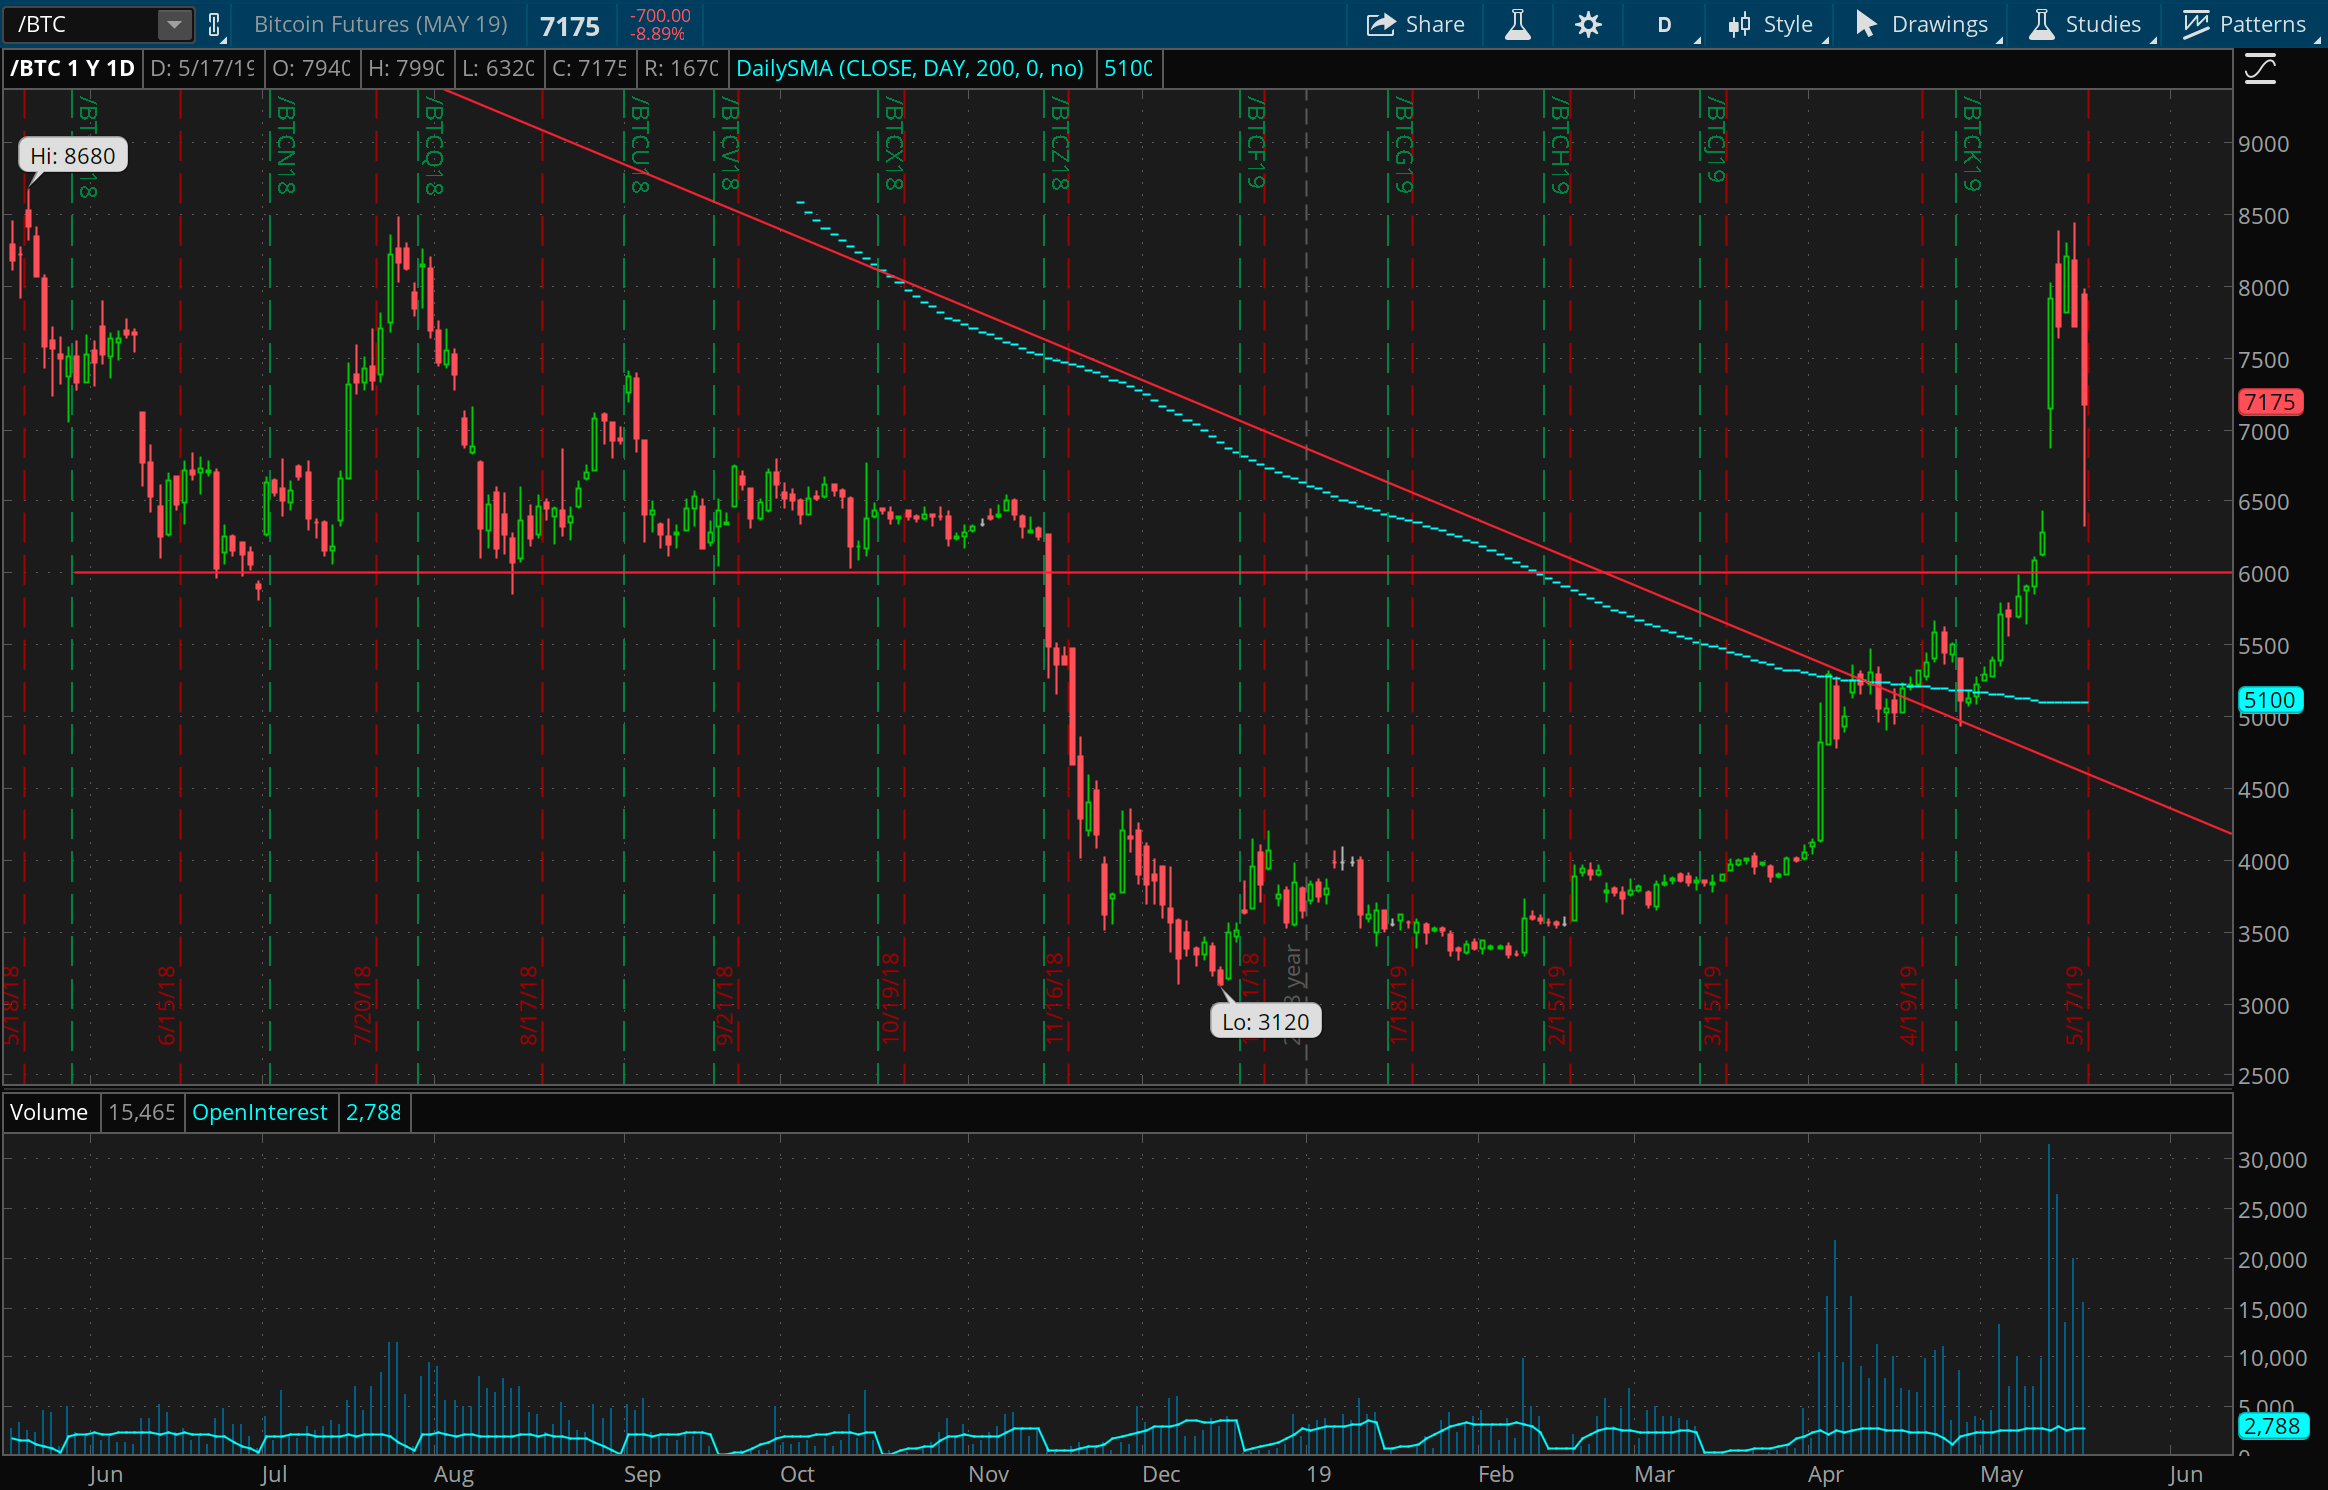
Bitcoin! Bitcoin is F’ing crazy! Look at the Bitcoin chart and commentary from last week. I thought oh look it’s above this important 6000 level. Monday it opened above 7000, closed at almost 8000, and from Thursday to Friday, had a high of almost 8500 down to a low under 6500, a two day move of over 23%! I guess it’s in good shape if it stays above 6000 now, but the price of this thing operates on quantum physics rules, it’s ridiculous. (Also do you remember that show, Quantum Leap)?
The Qs
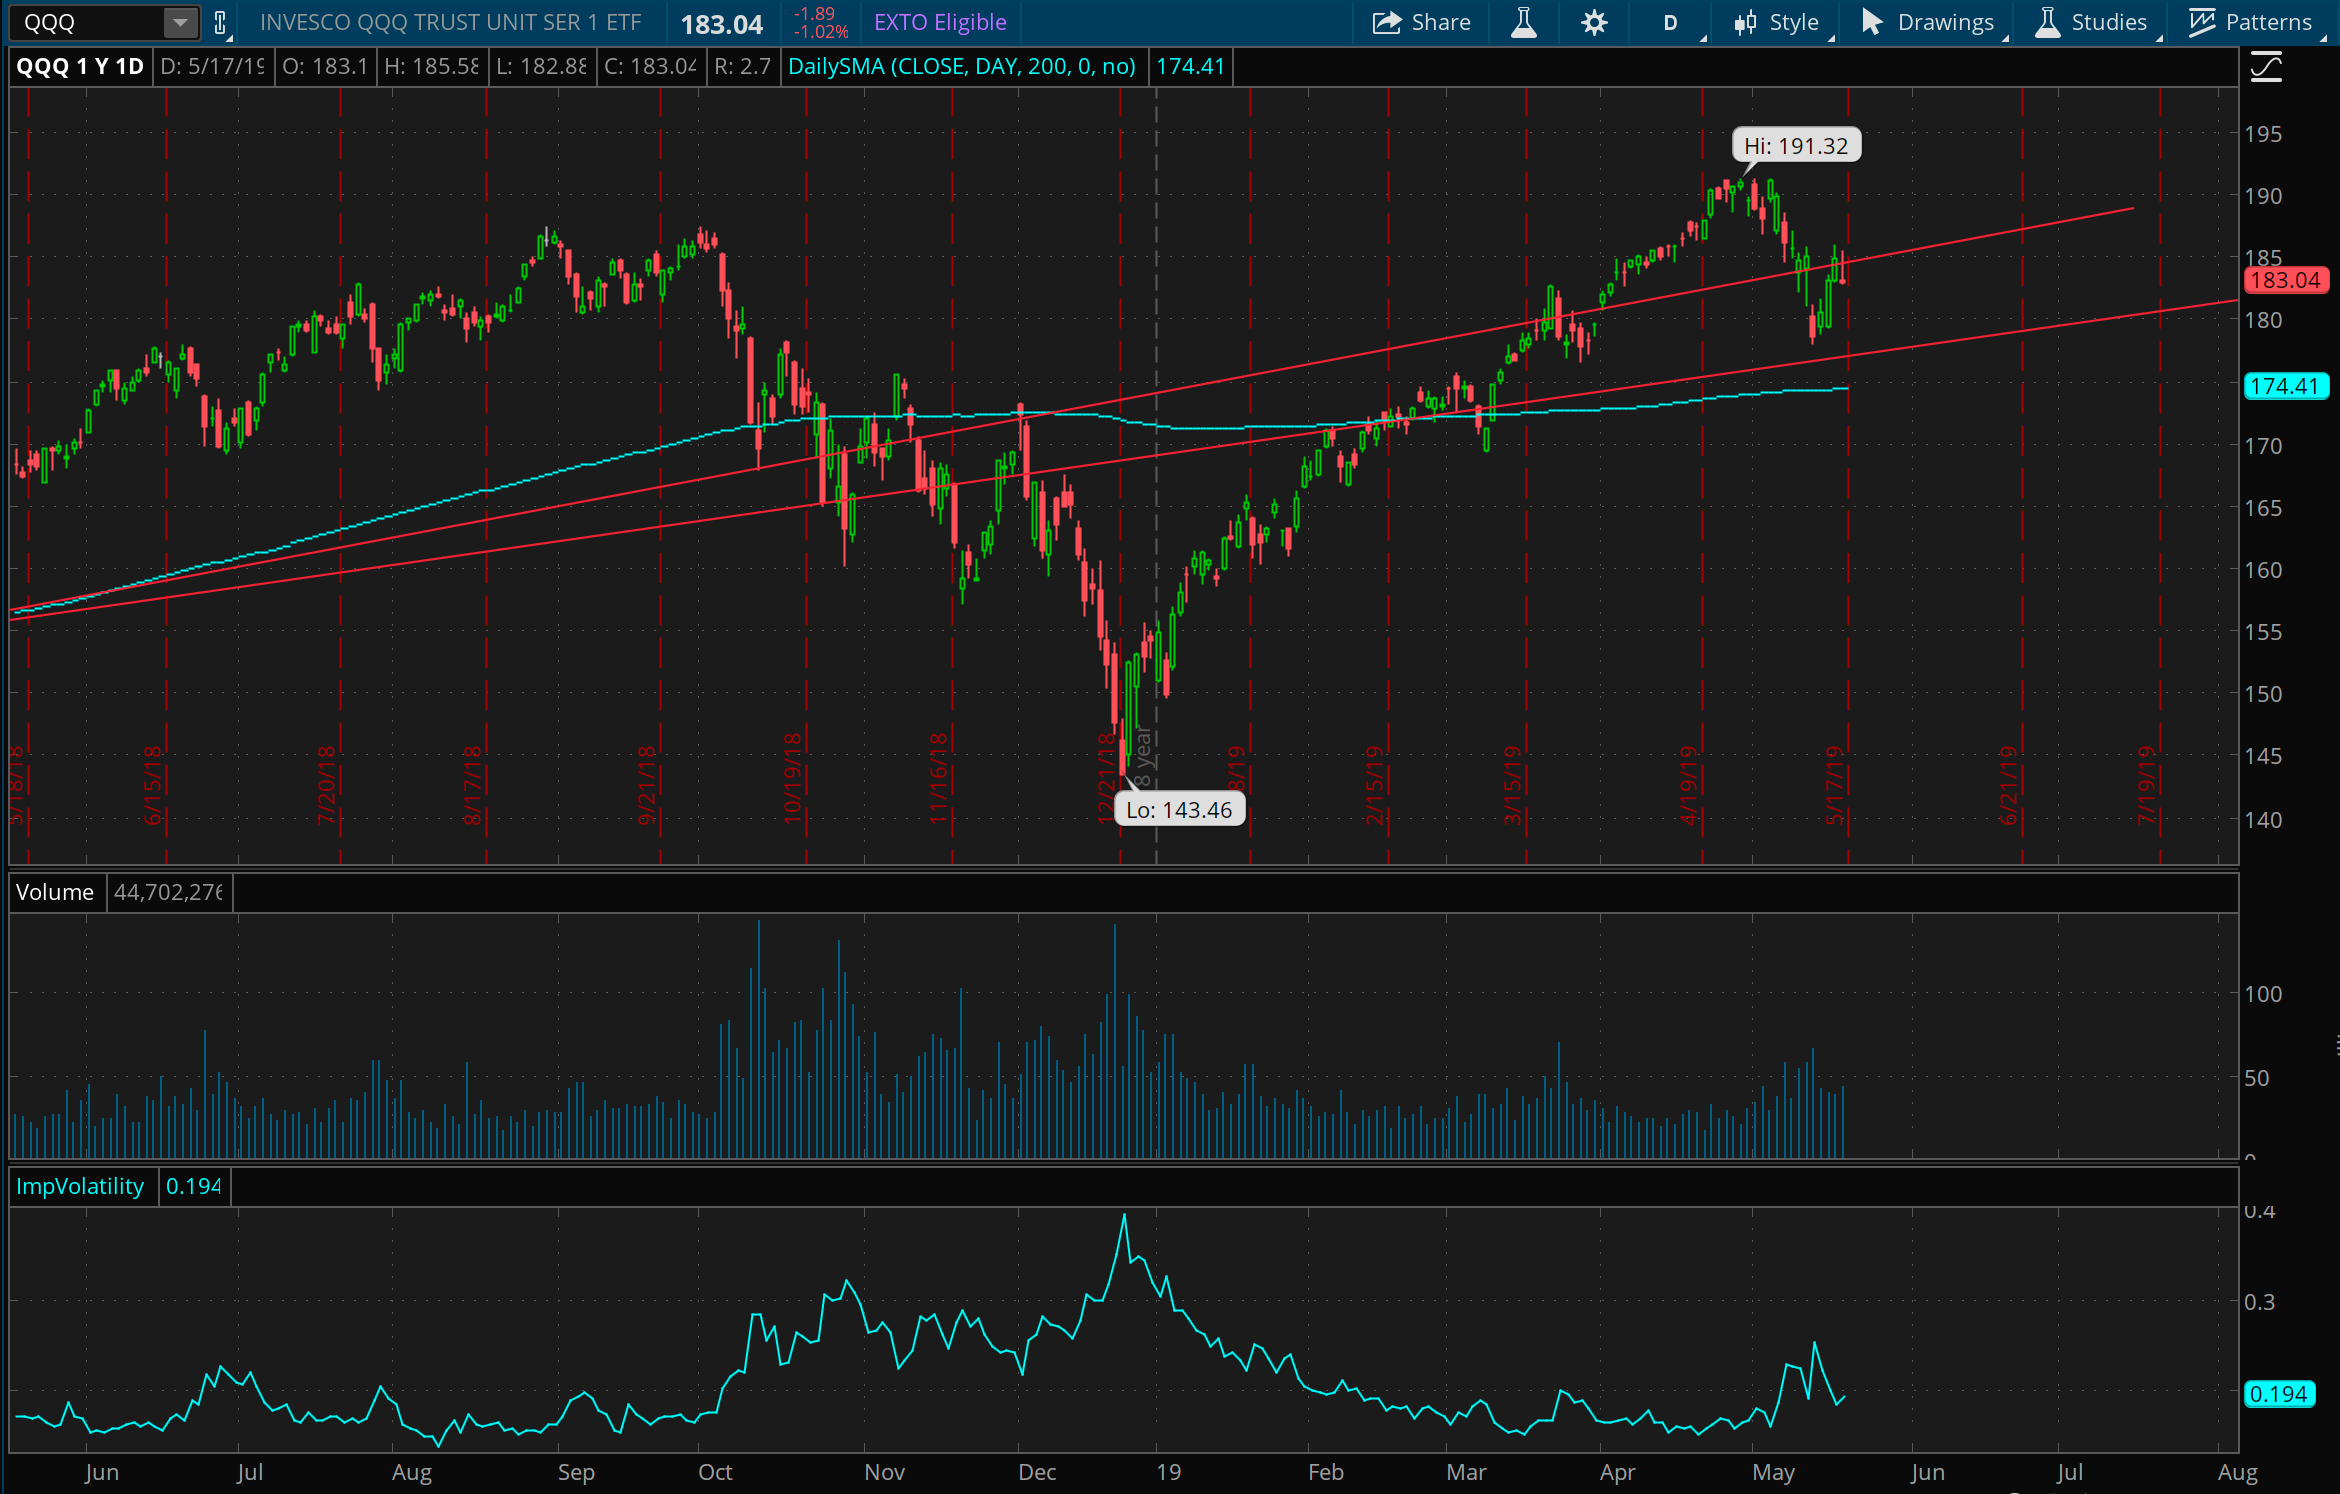
The Nasdaq is sort of acting how it looked it might last week, gravitating down to the 200 day moving average but just bouncing around off of support in this area. At the moment it looks like it wants to just keep bouncing around and drifting upward slightly as it goes. If it moves to 180 quickly, I might bet on support at 175 or 170.
Wiley VXX

The wiley VXX. Last week I posted this and had gotten short around 31.25 on Tuesday the 7th (pointed to by first arrow). By Friday it had fallen to 28, and I would’ve been out in a heartbeat if I was watching the market that afternoon. Alas, I saw it on the weekend and found myself right back above 31 on Monday. But it reverted down again to 28 this week and I got my second chance to make a quick turn on this, which I did, getting out at 28.10 on the 16th. Will definitely reload on this if things keep getting wiley-er.
AAPL is still sick

AAPL just continues to look kinda sickly. It gapped down Monday under its 200 day moving average and doesn’t seem to be mustering strength, so I put a bet on resistance at 200 at the end of this week. Might add slightly to it if it moves up instead, looking for more resistance at 210.
An impatient NFLX trade
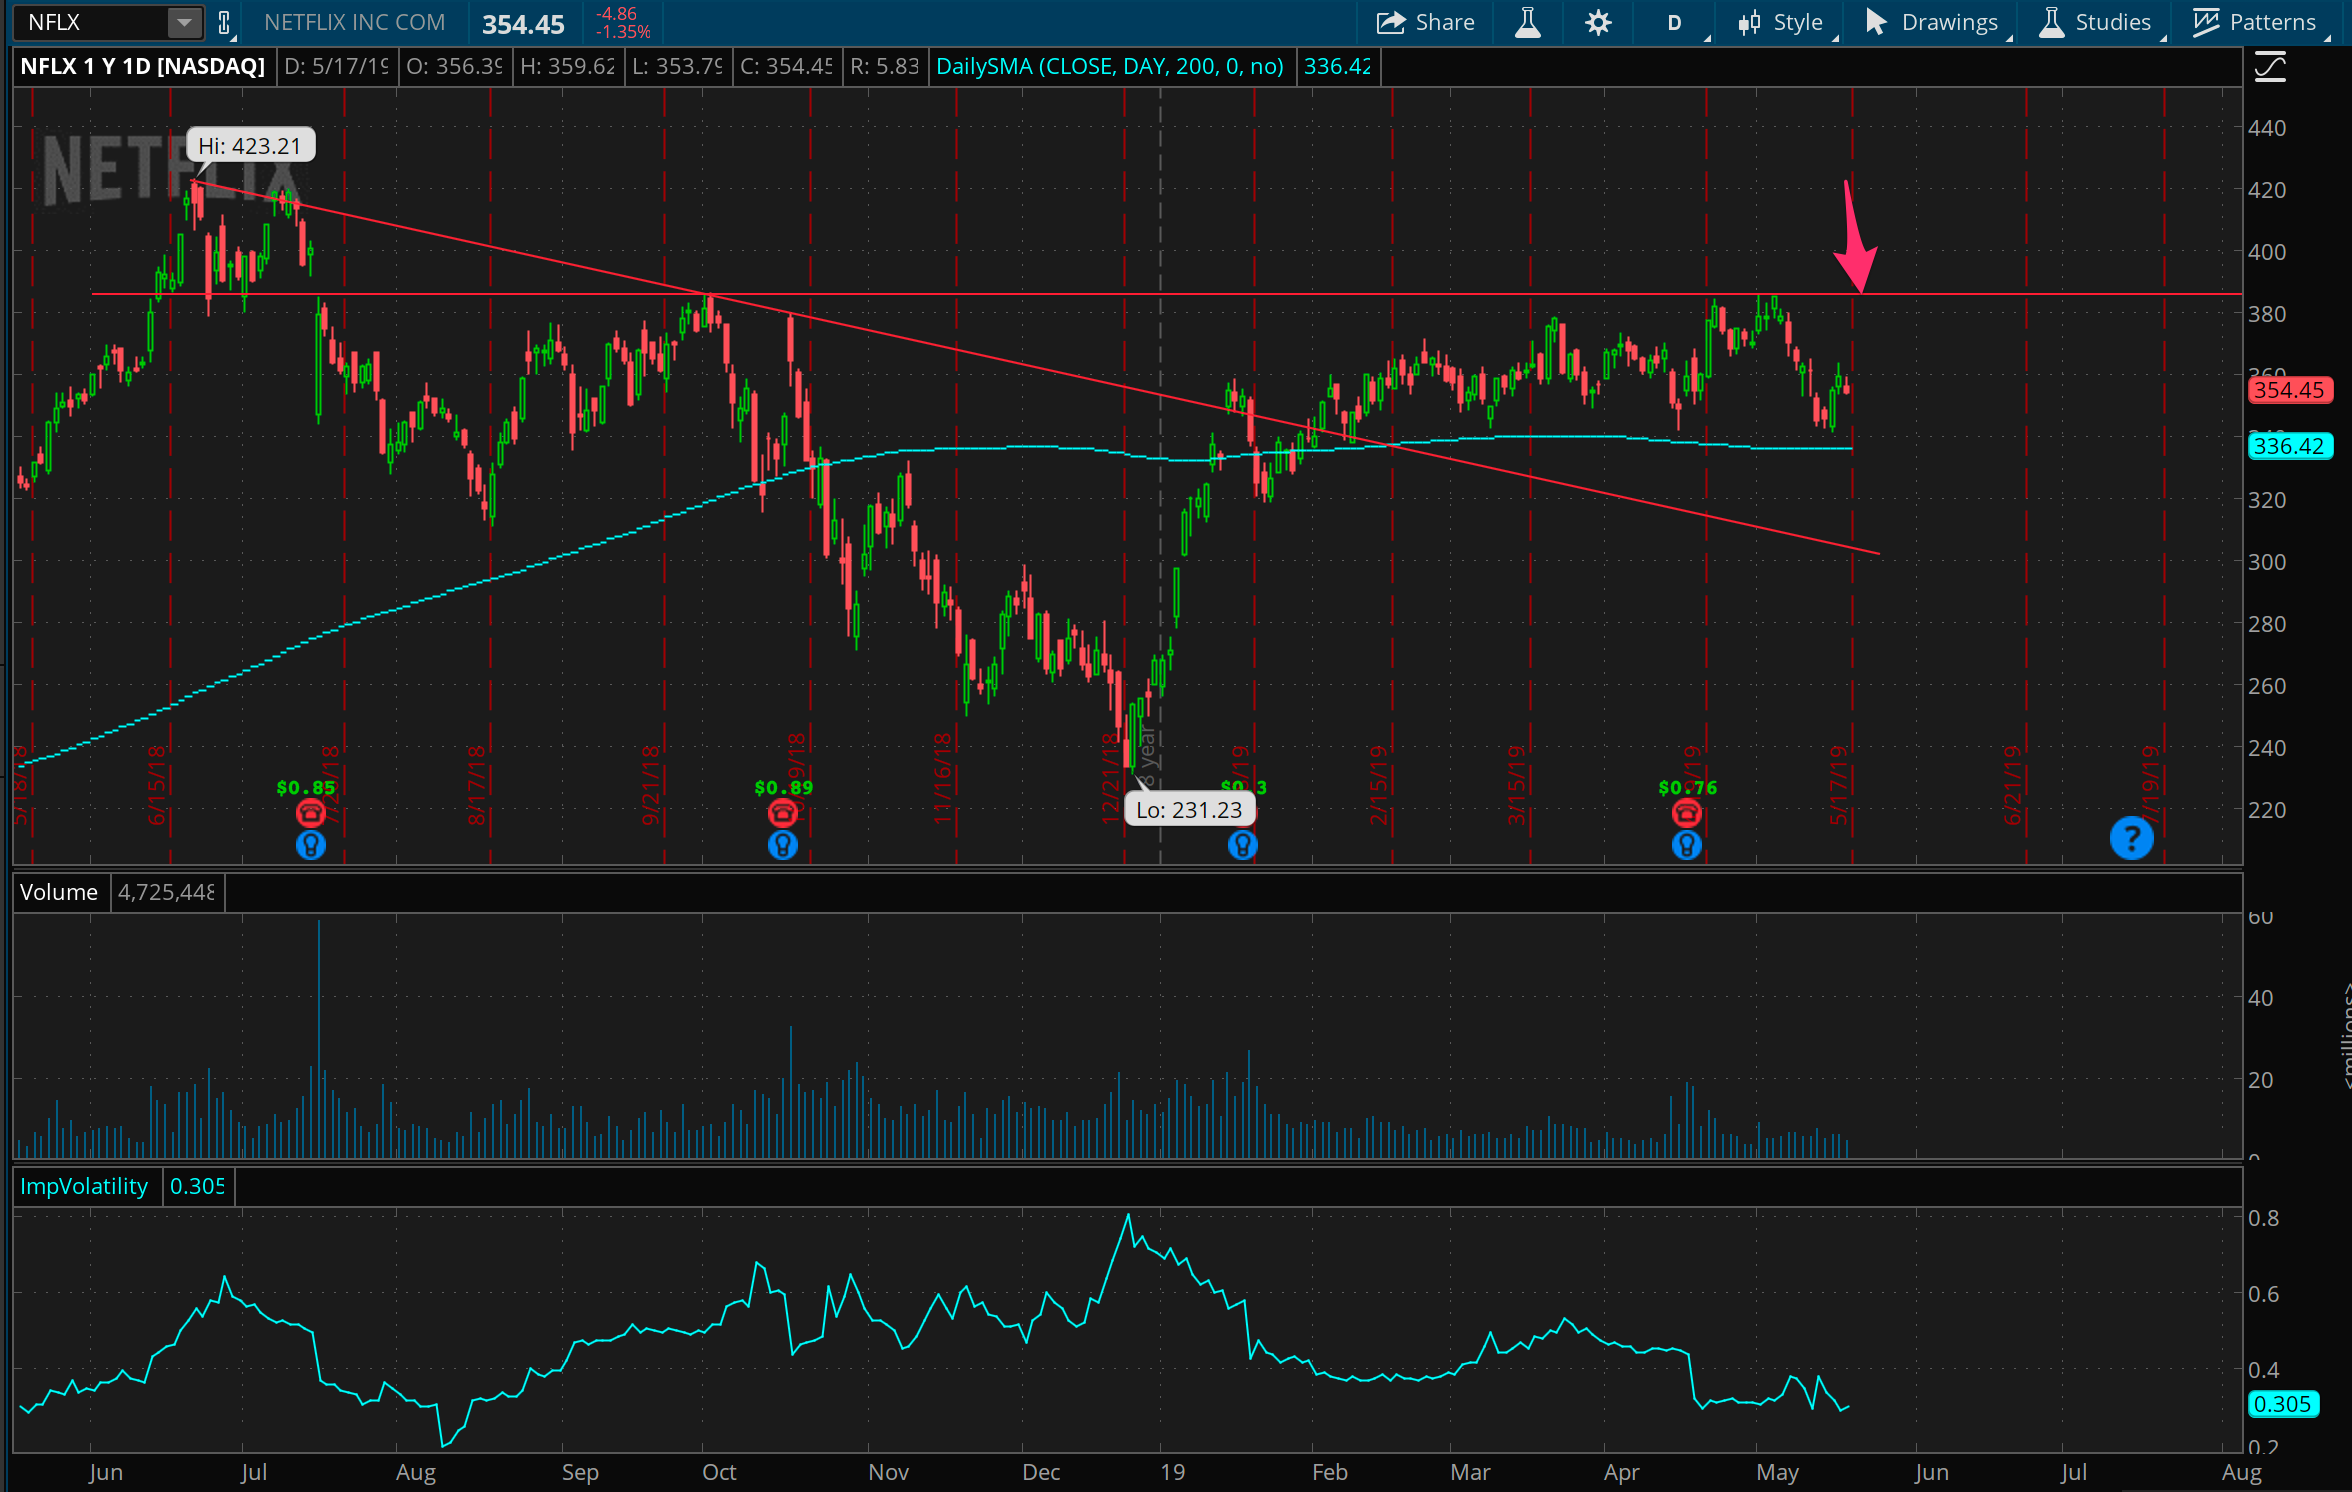
NFLX. I think I got impatient with this trade. I went ahead and put in a bet for resistance at 385, but should have sat here and waited for it to approach it first. Frankly I jumped in because I felt like I missed the chance to get the other side of it earlier this week on support at 335. But, ya know, days jobs and all, so what are you gonna do.
WTF TSLA?
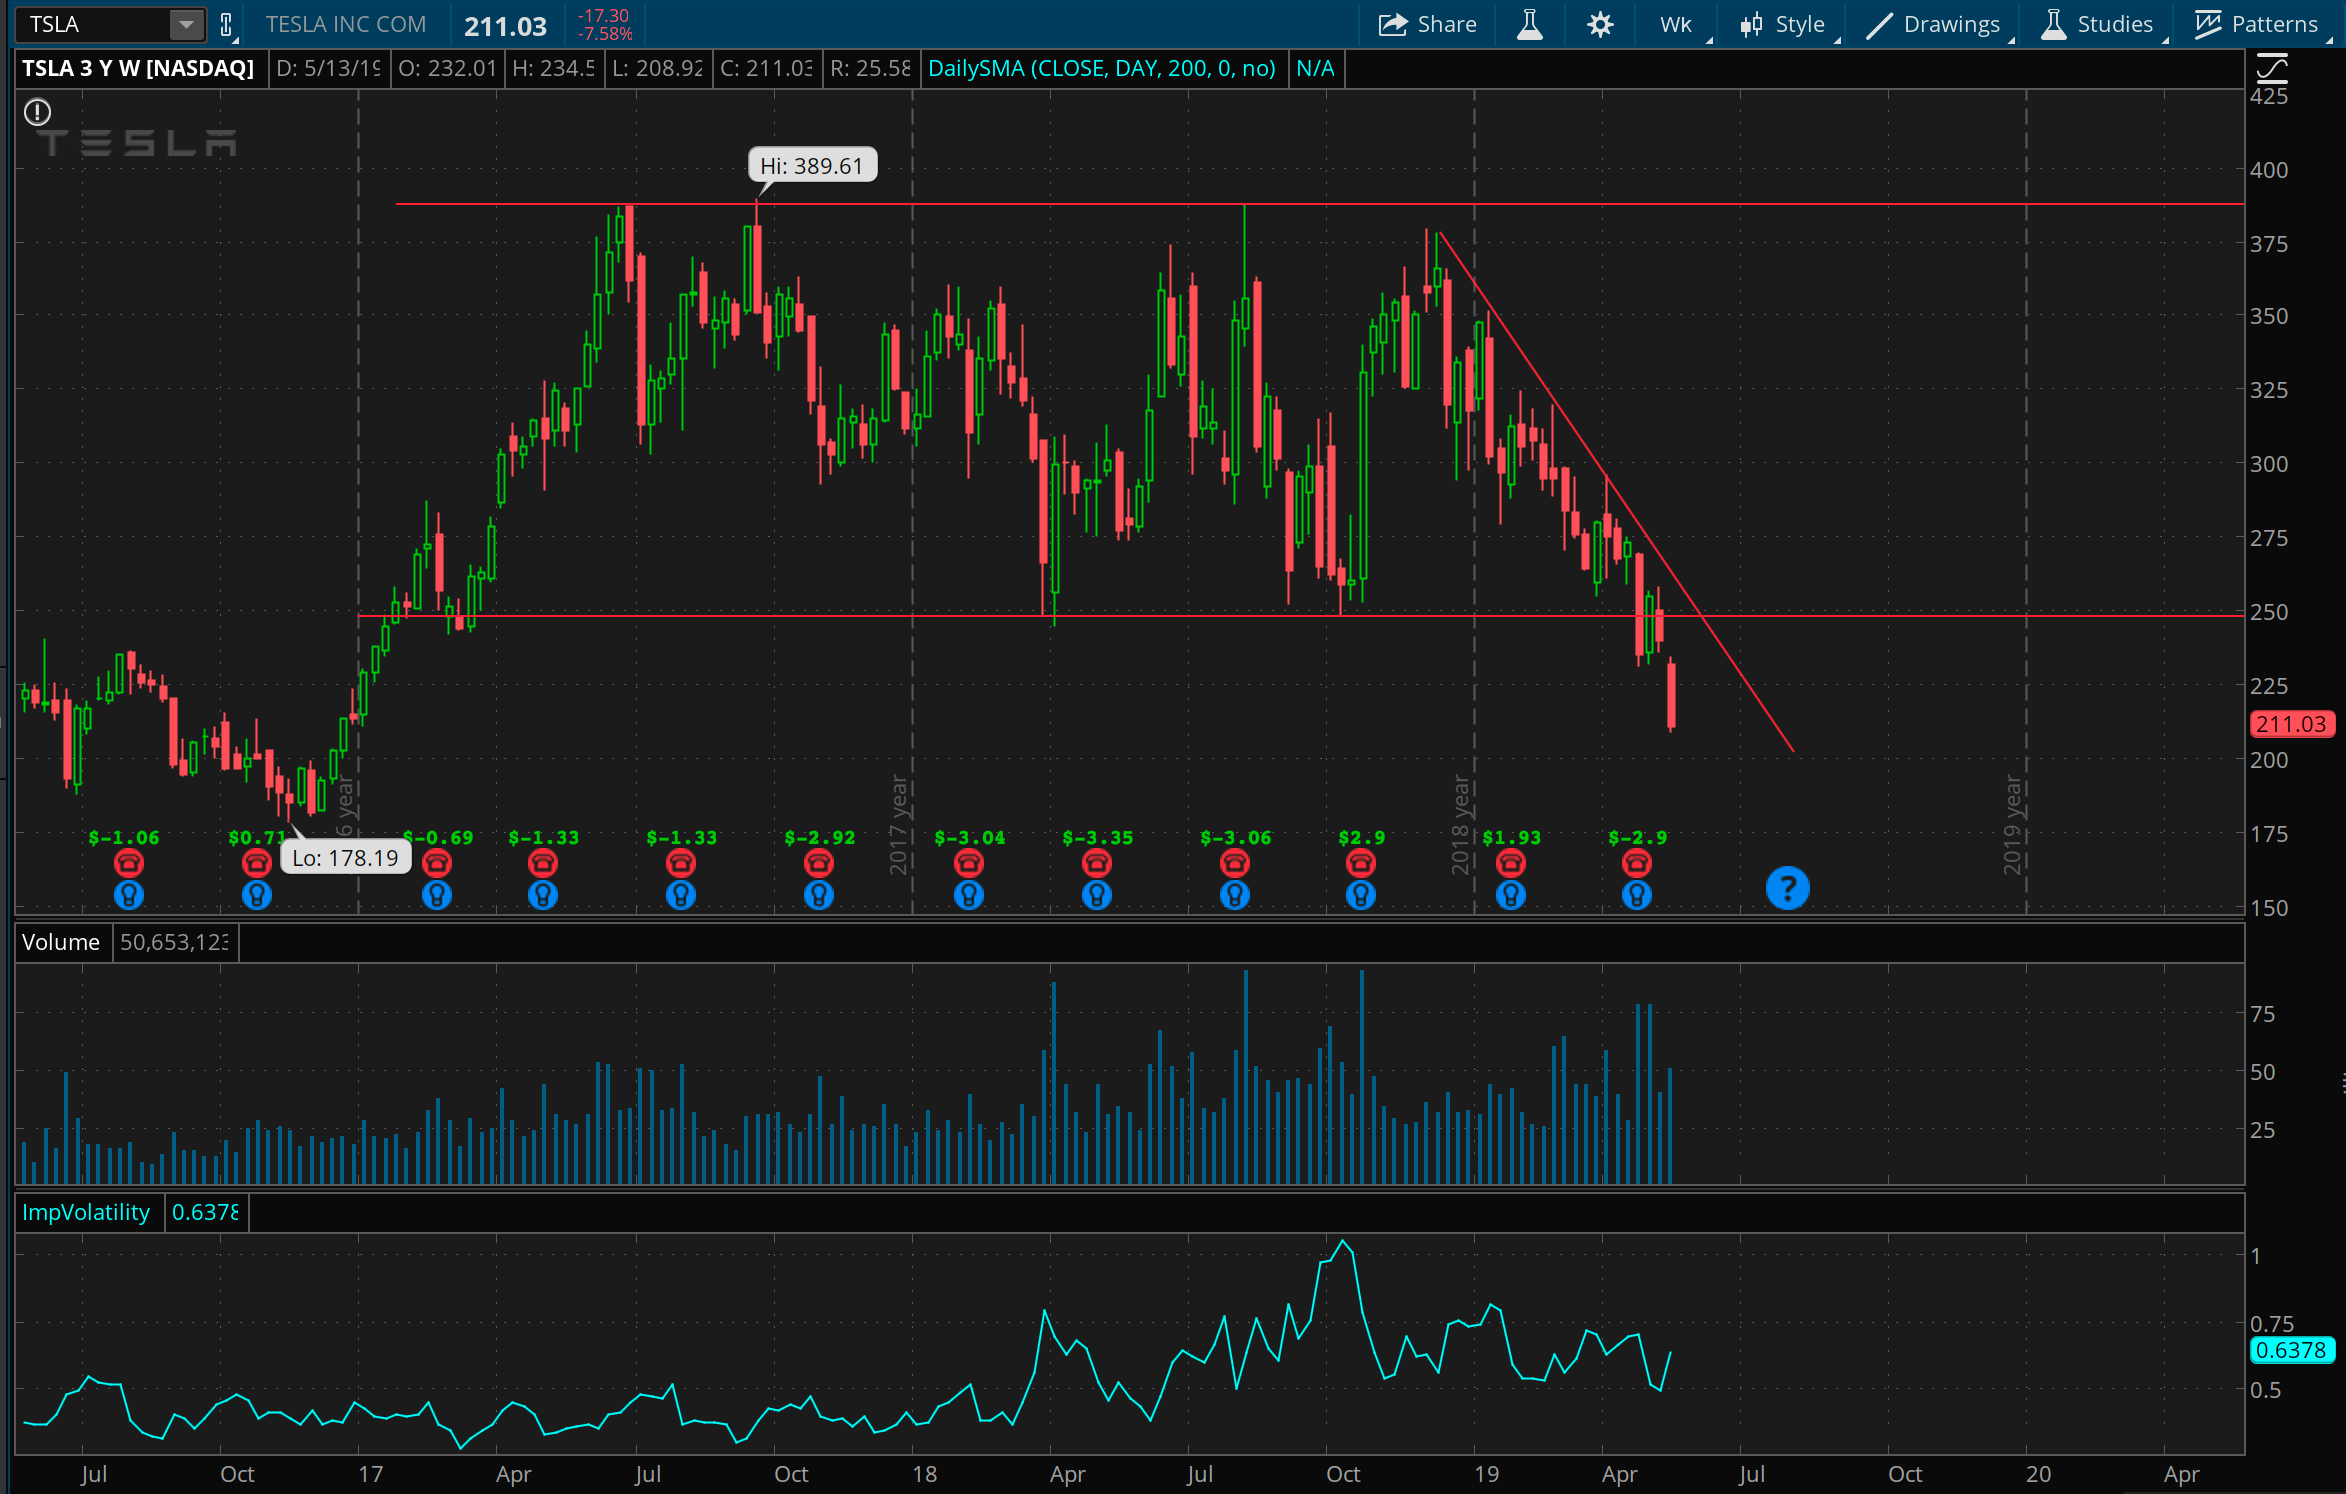
TSLA is just a damn mess. The above is 3 year chart, not 1 year. From a charting perspective this looks like hell. It’s been so range bound for so long though that it’s probably the smart bet to be long here, but I don’t have it in me for that sorta thing. I’m just watching with fascination on this one.
SQ approaching support
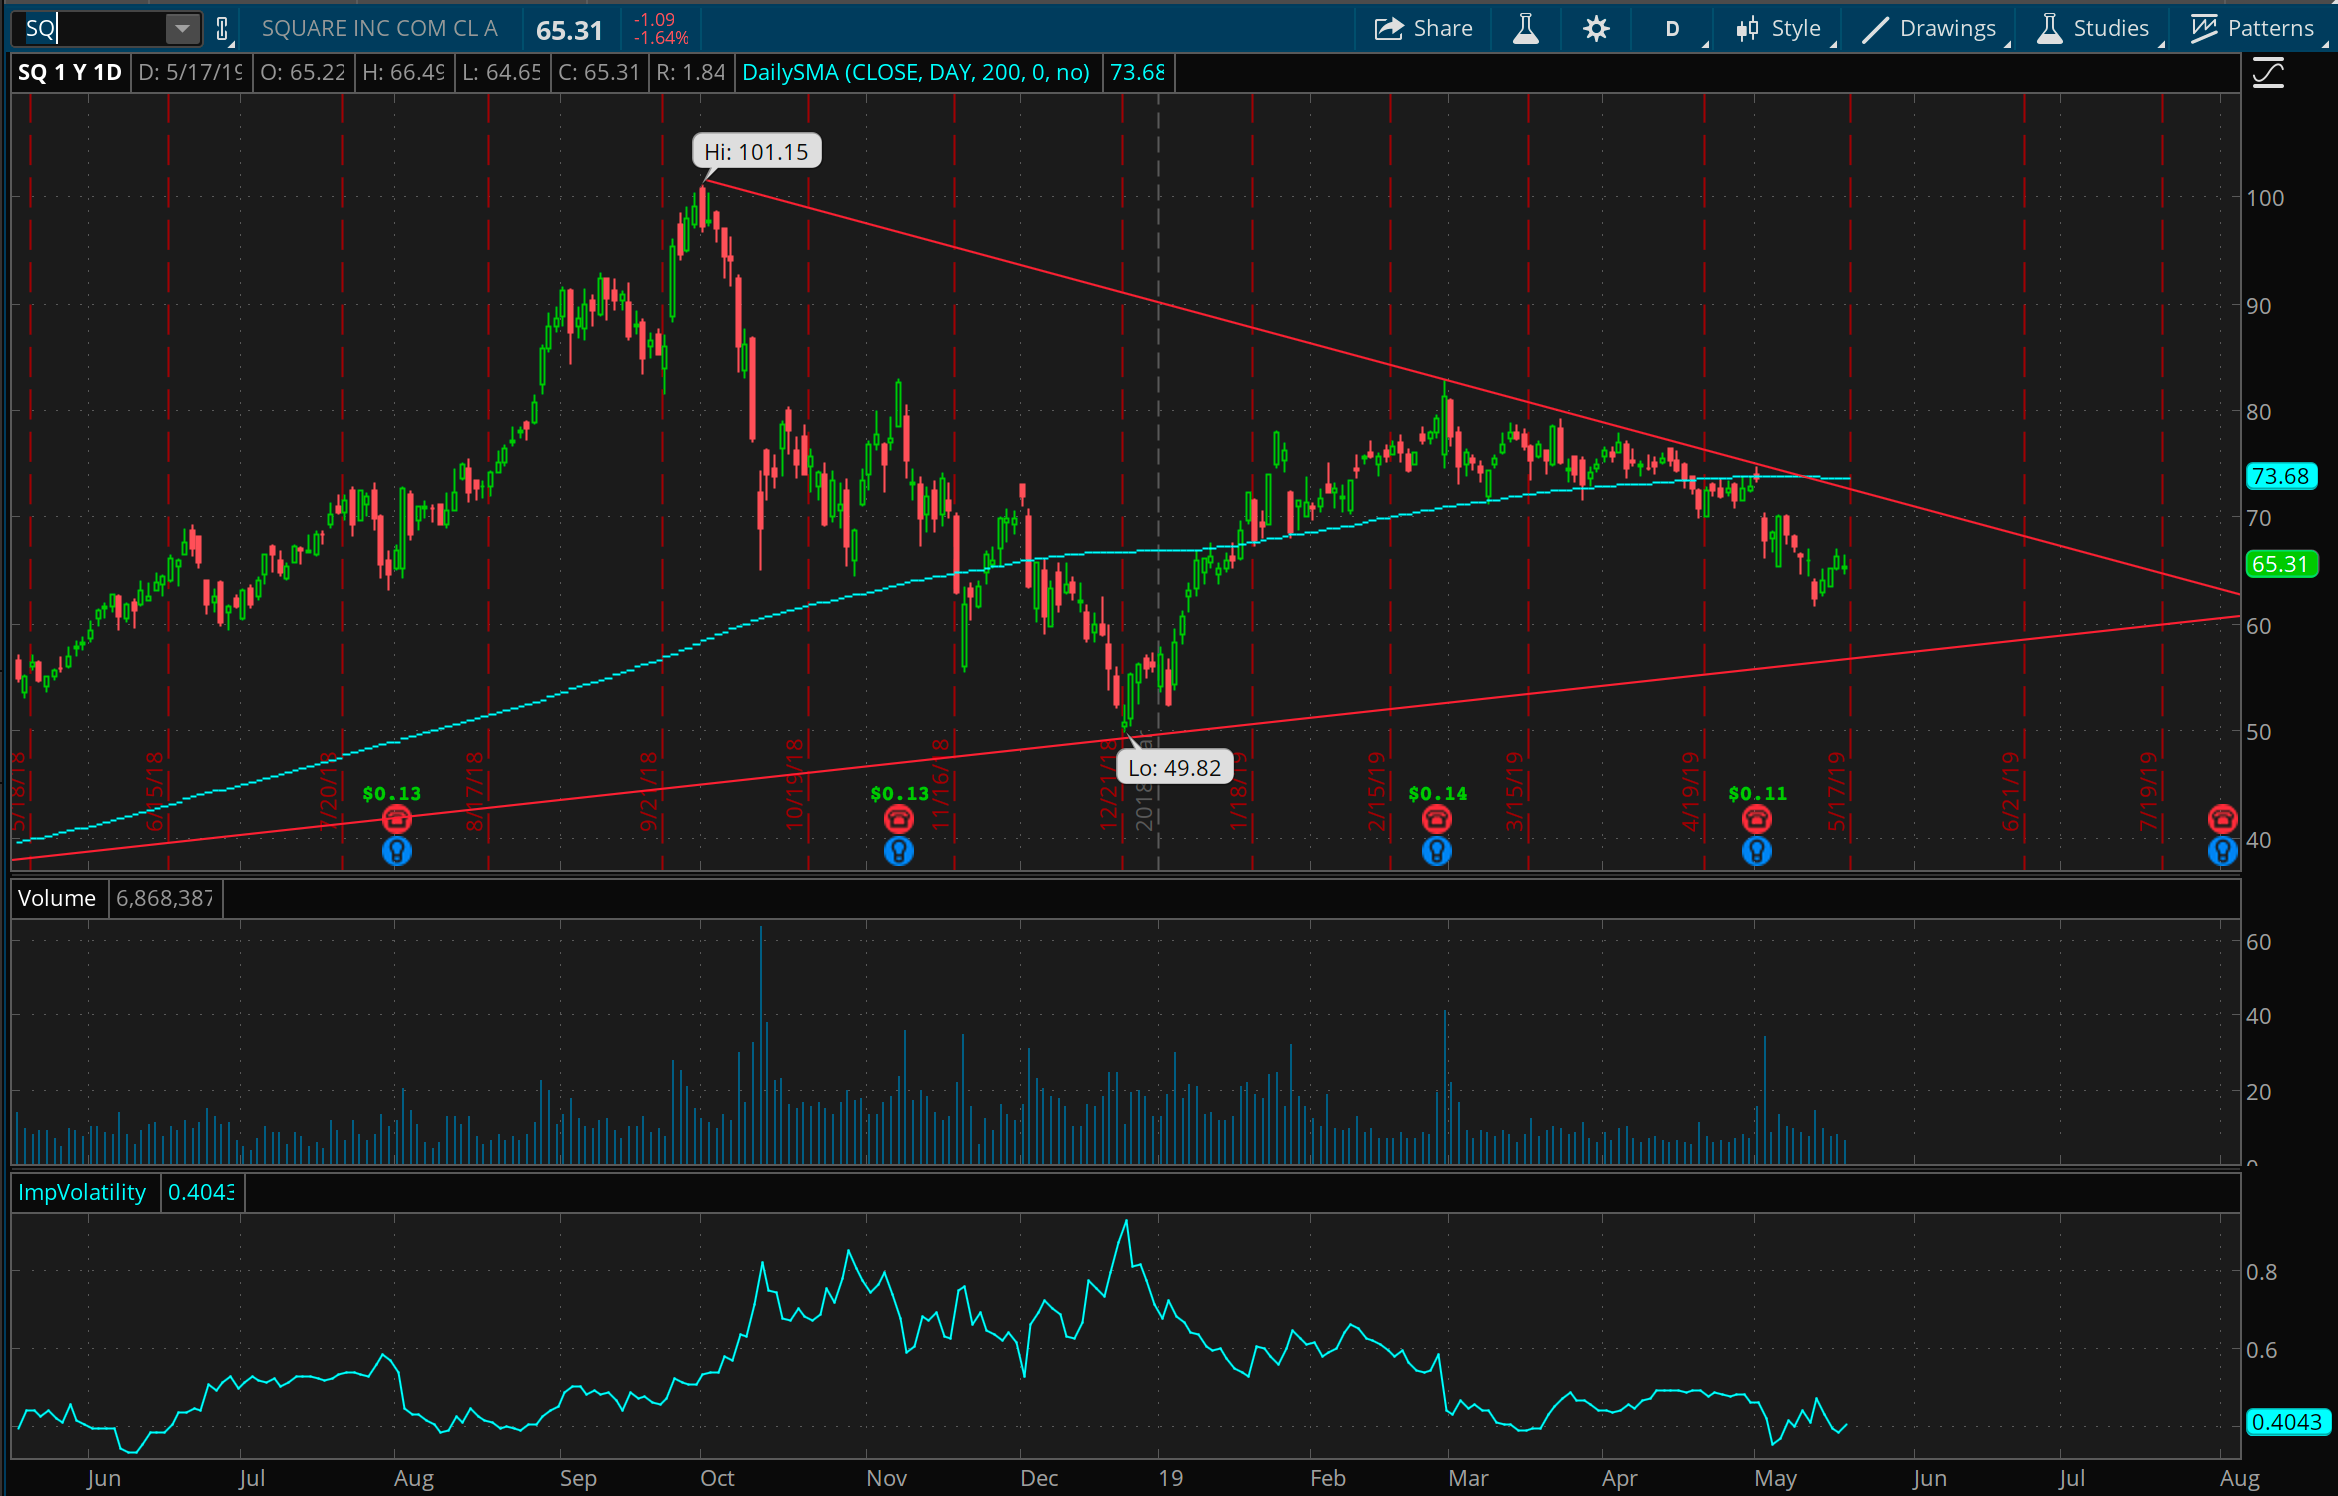
SQ showed clear resistance around 75 and 80, and it’s sitting under the 200 day moving average, but it still feels interesting as a bet on support at 60, if it moves down that way. This could move sideways and not up much, but I can’t see it falling out of bed here. Either way I would definitely define my risk on a support bet though.
XLB short

XLB looks like a short, maybe even just right here. I might nibble short soon, and add more if it gets up toward 57 and 58. The long term downtrend, and battle with the 200 day moving average just feels like this one is going to struggle to go way up.
XLF, where are you headed?

XLF is a little similar to XLB, but looking healthier overall. Which for me makes it a harder read. I don’t have any conviction here but will be interesting to see what happens next if it moves up to 27.50 or so. Will it break through the longer term overhead downtrend?