Have we turned over?
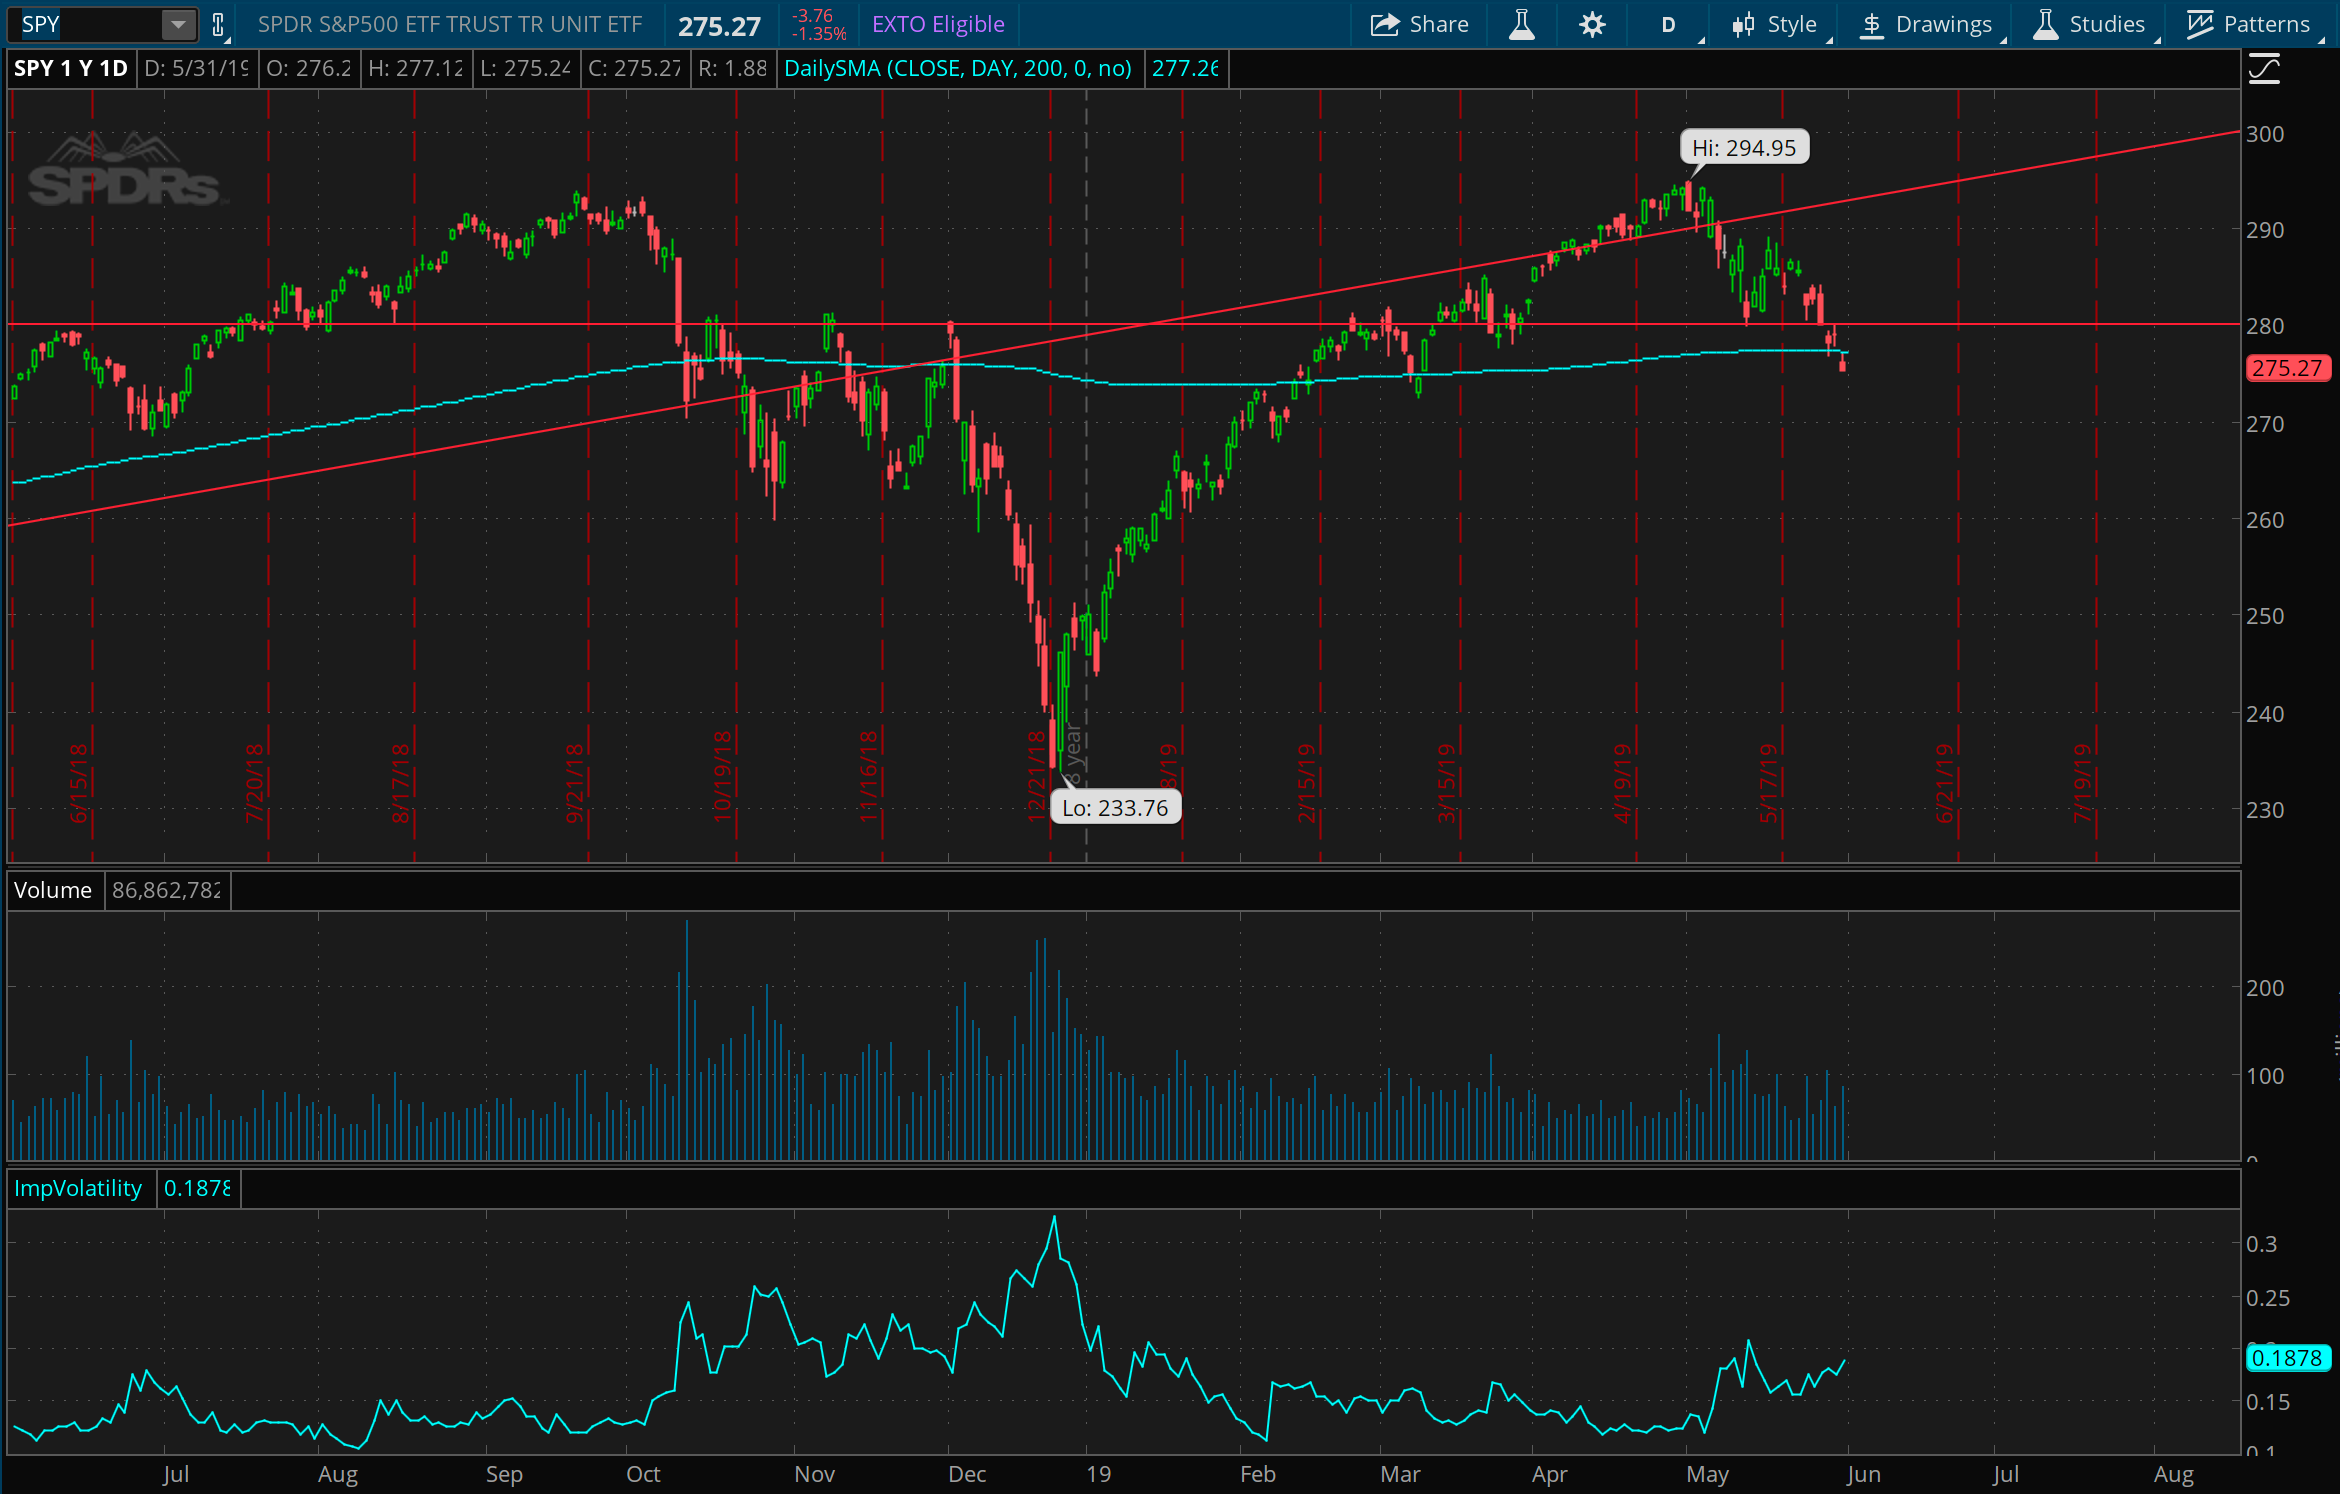
The SP 500 one year chart. This definitely makes it look like things are starting to crack in the short term, as we fell back under an important 280 level. This could make things more of an uphill battle now with that flipping over to resistance. Further support is around 270 and 260, so we might see some roller coaster action in the 260 to 280 range now.
Et tu, Nasdaq?
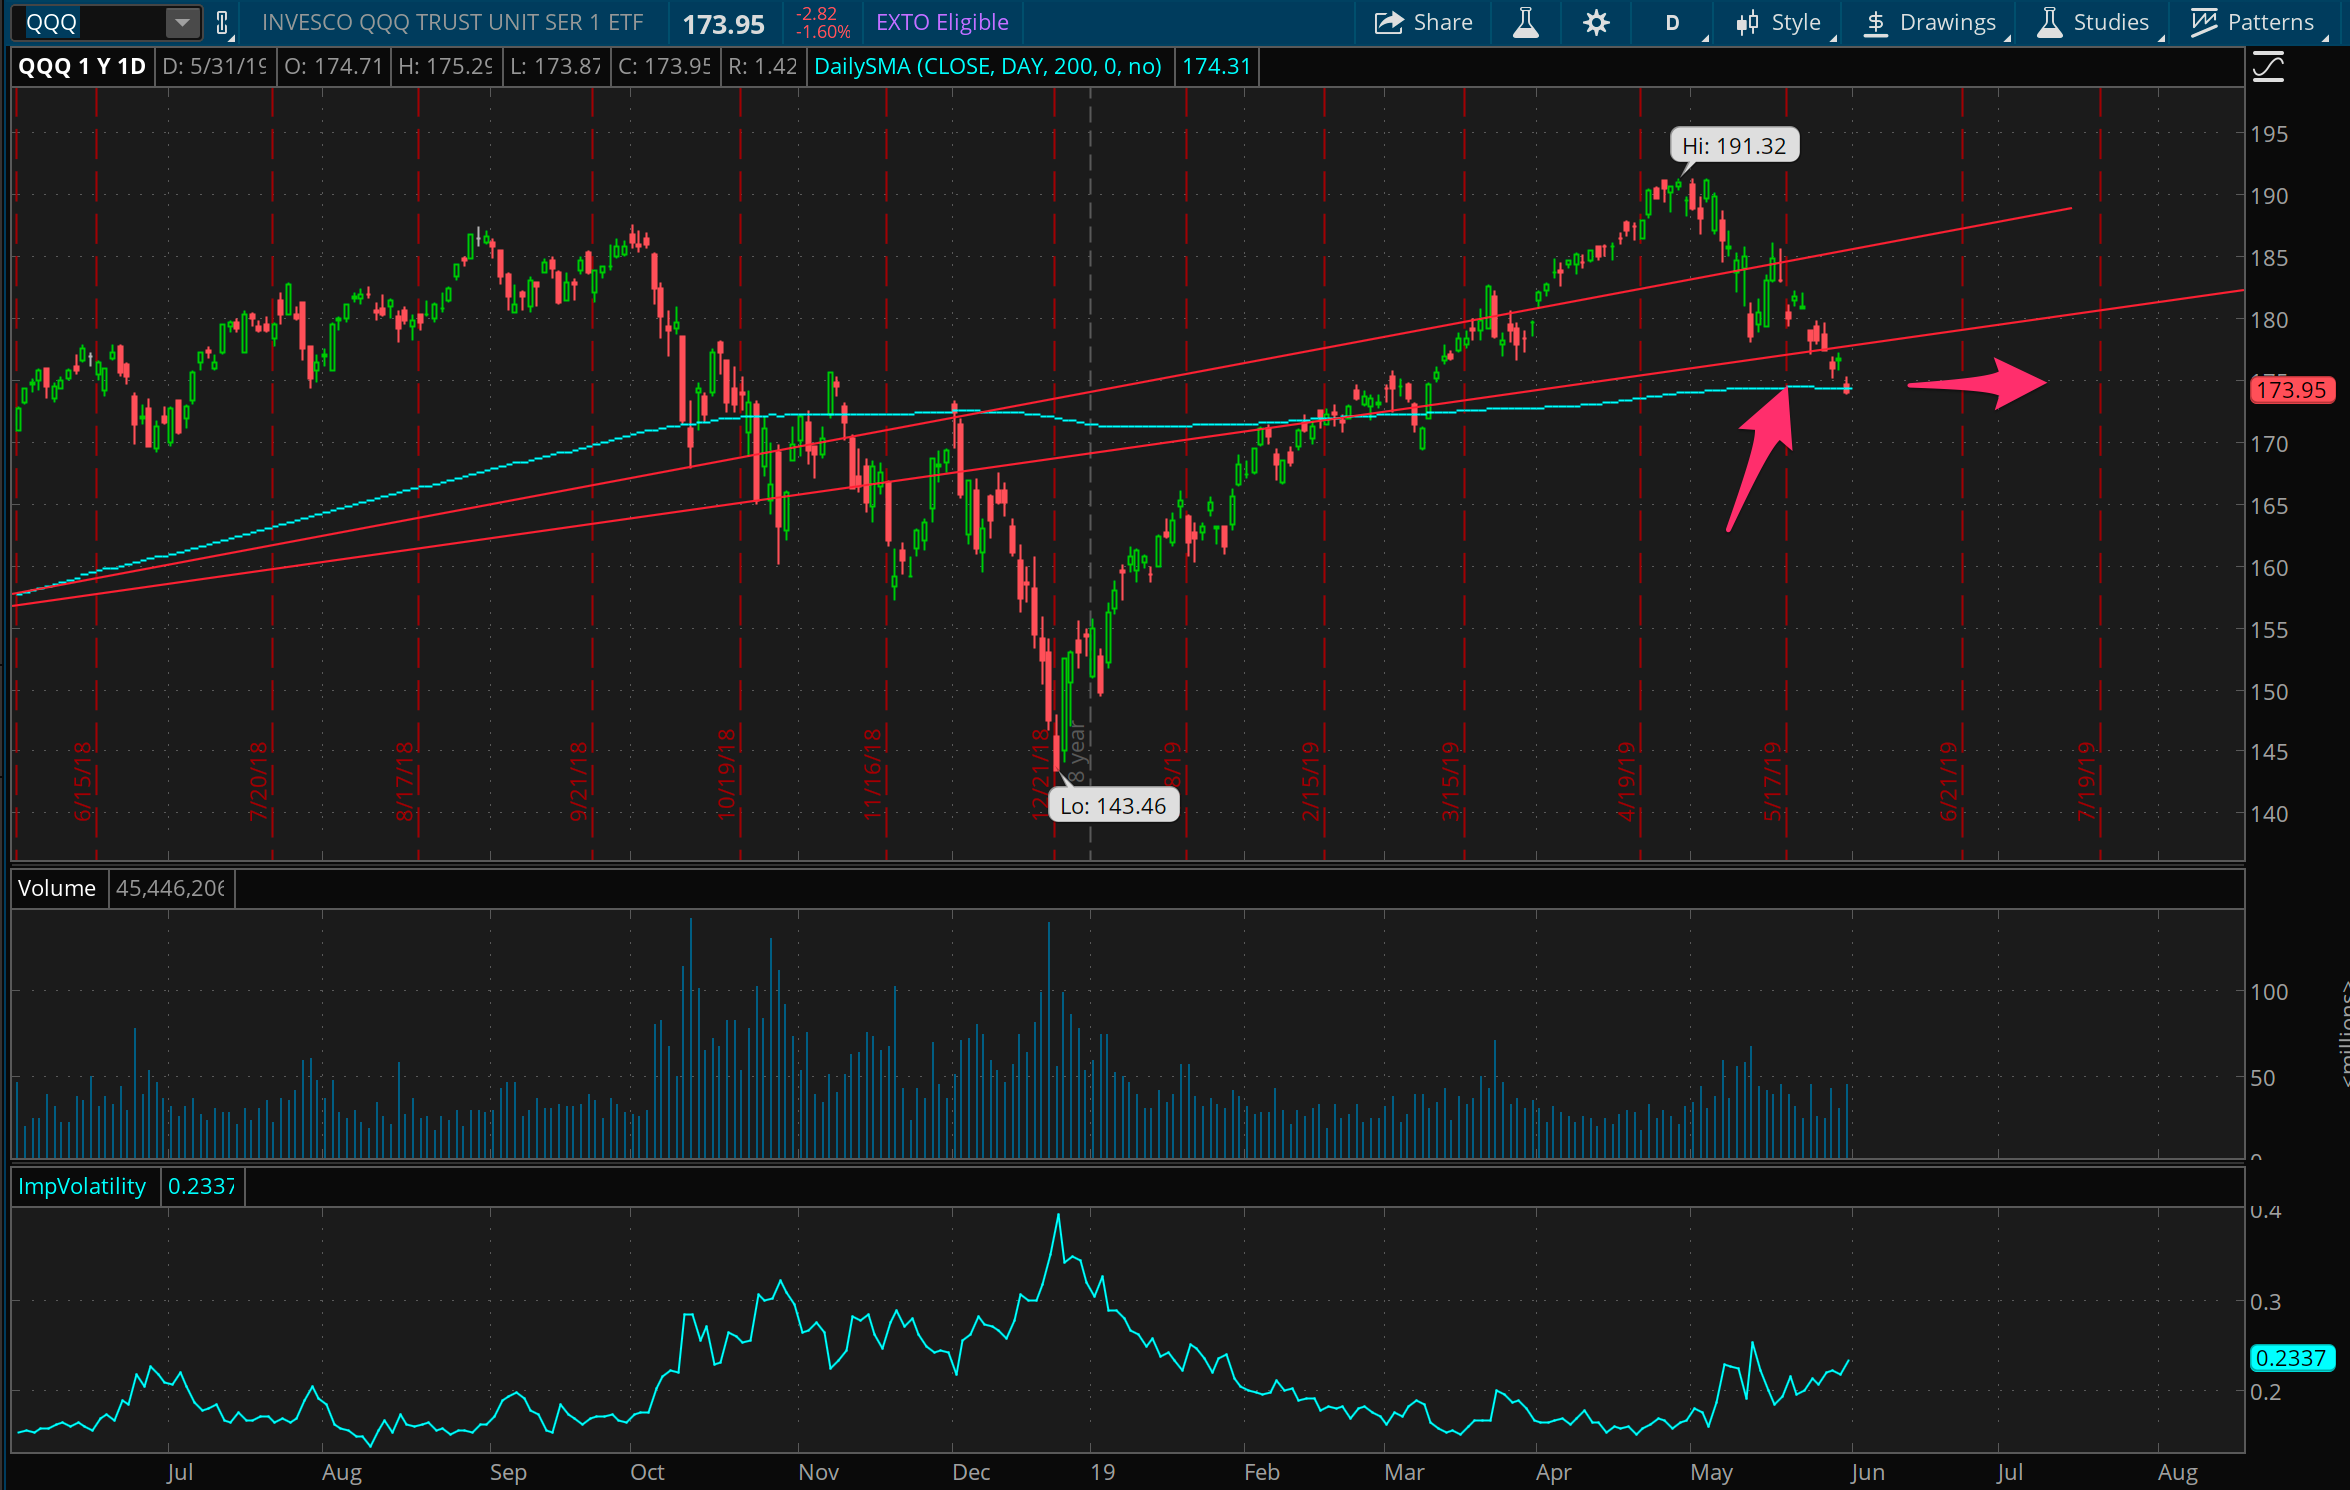
Similar story on the Nasdaq though it looks slightly better, still hanging closer to it’s 200 day moving average. I could see a big scary drop down towards 160, where I’d put some trades of support there. But, in the meantime, I’m keeping around a small trade on support at 175, which I just added some time to by rolling a put spread out from June expiration to July.
Get you some volatility
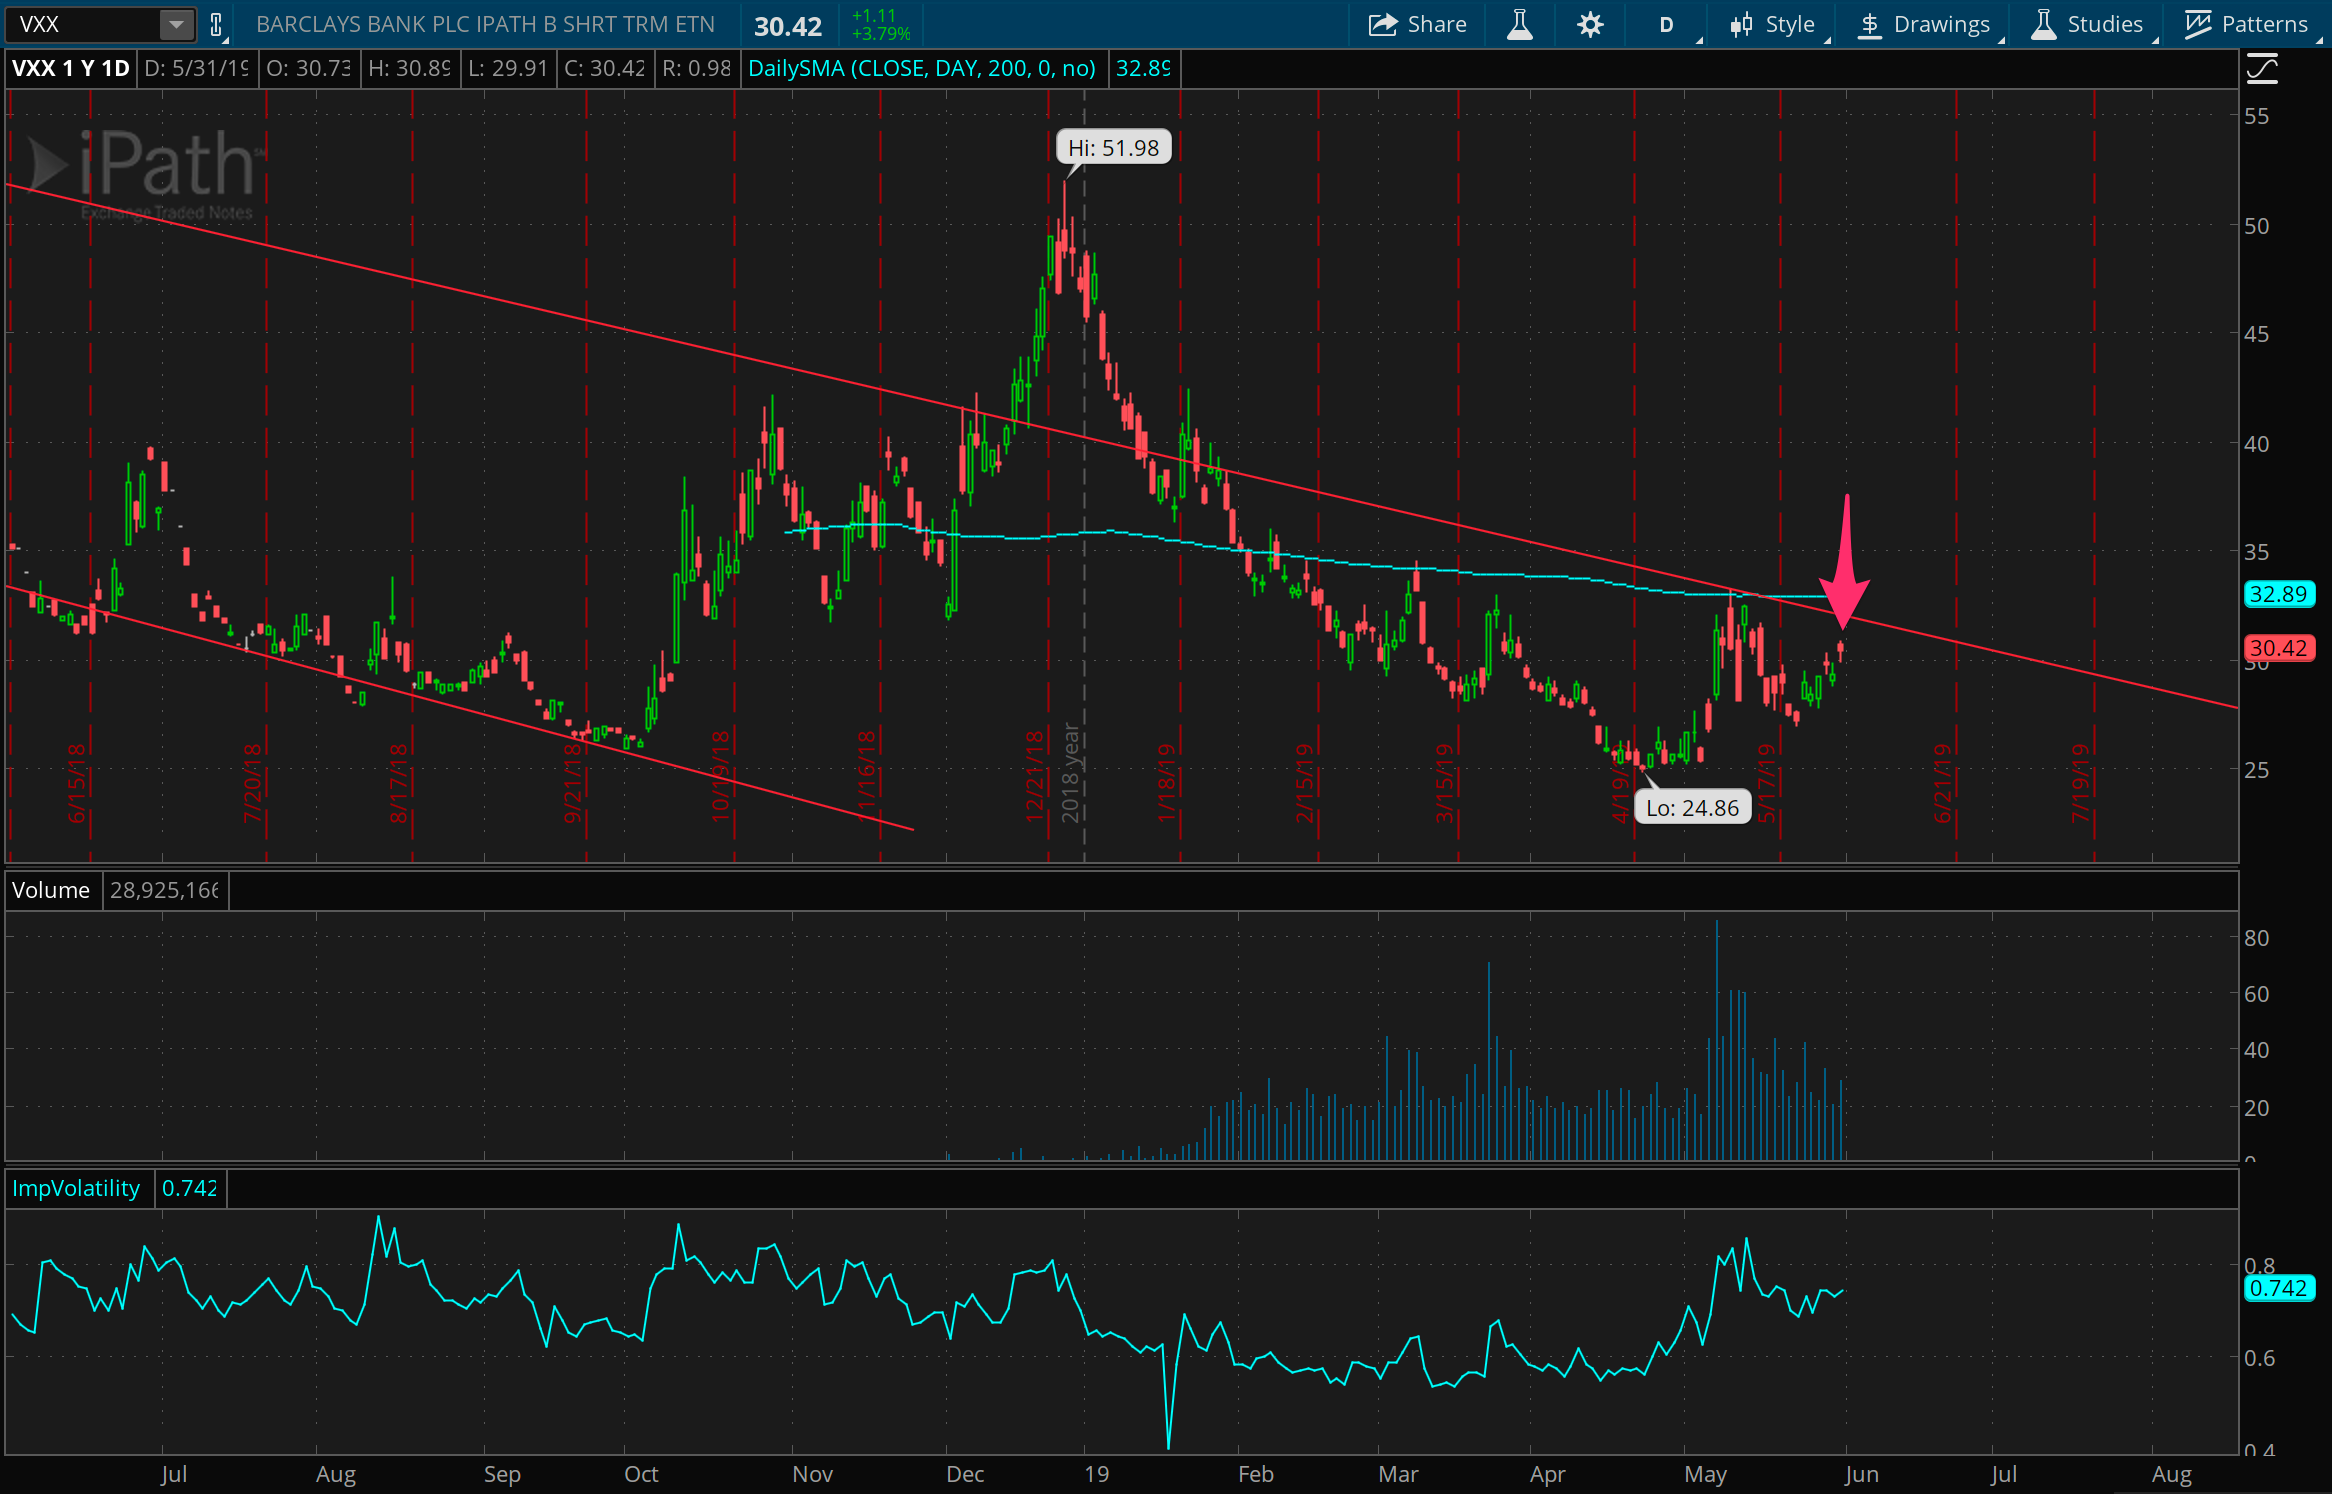
Oh yes, the VXX is active, and frankly it’s good to see some volatility in the market. After a roundtrip on the short side two weeks ago, I’ve jumped back in for more here around the 30 level. This obviously could go crazy to the upside if the market melts down, but phasing into this is a go-to trade I’m happy to put on, and I’ll add to the position in that case. Otherwise I’m happy to keep taking little chunks out of this with a small position.
Oil falls right out of bed
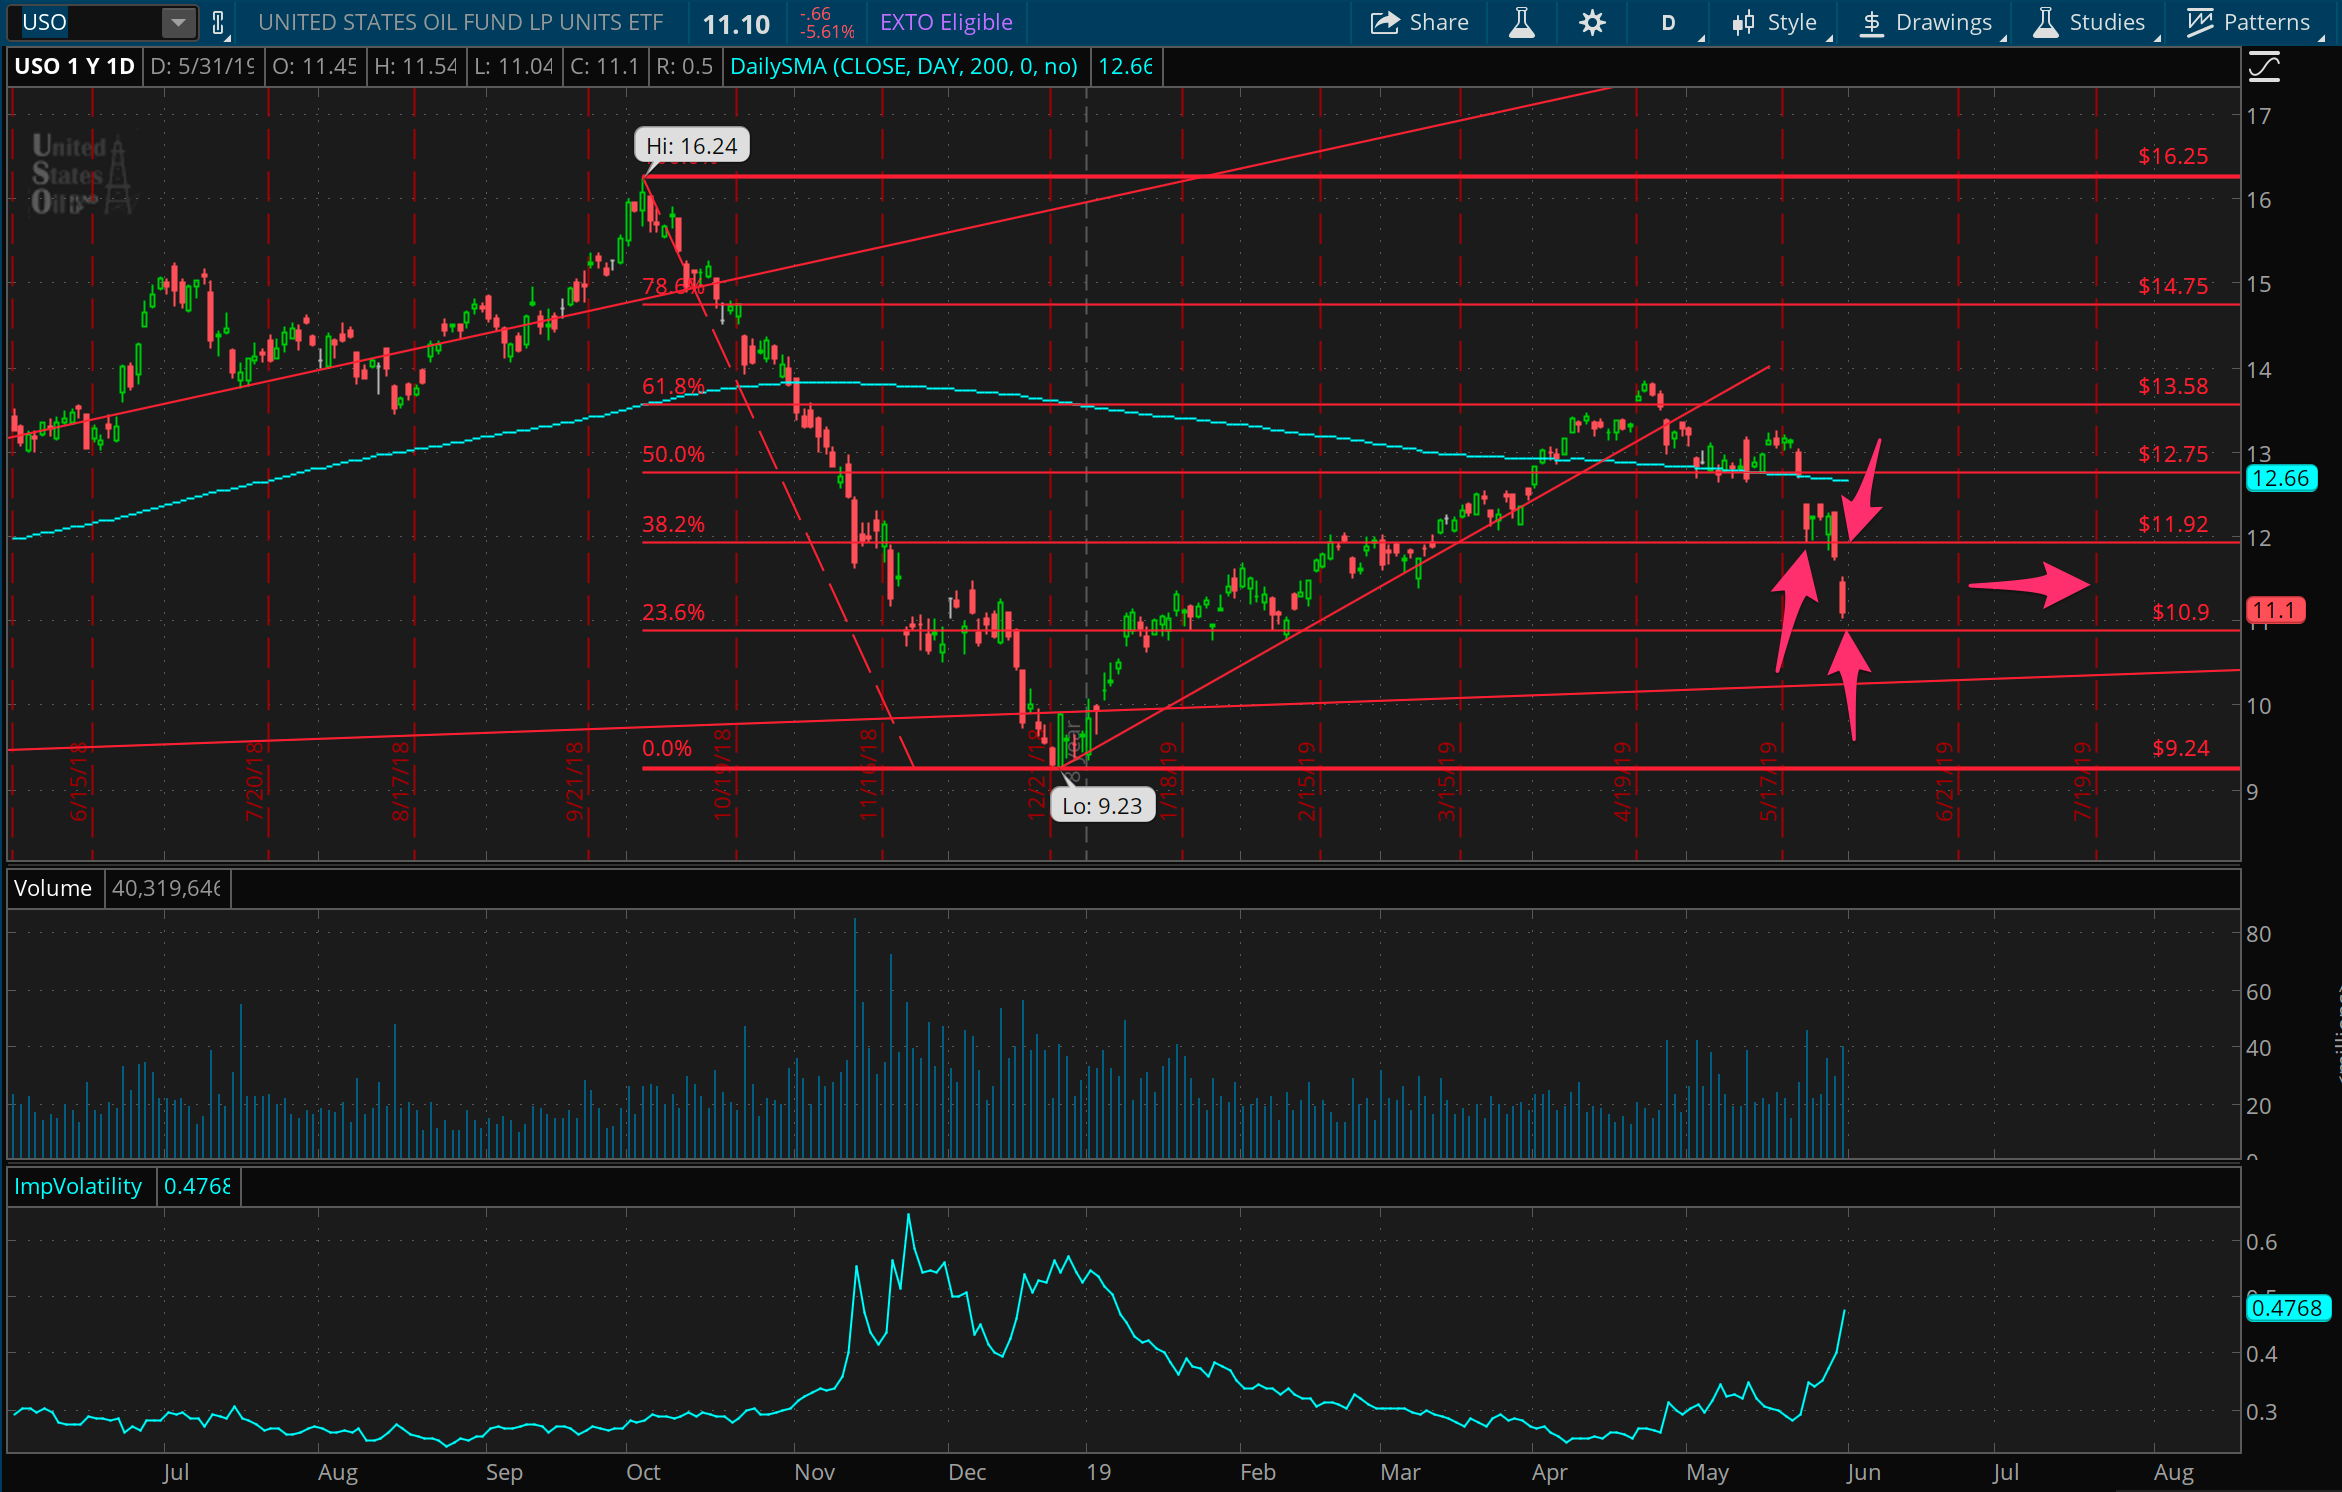
Oil prices are getting wacky, which is helping to add nervousness in the markets. I’ve been thinking USO would hang in a 12 - 14 range, and so put on a trade for support at 12 last week, but it just completely fell out of bed at the end of this week. As mentioned last week, in this case, I’ve added a trade for resistance at 12 to reduce my directional exposure there, and added more support at 11. Will be interesting to watch what happens next here.
Tesla takes a breath

Tesla is just meandering along at this lower level. This is helping to keep some heat off of the trade I put on last week for support around 175. Since volatility has gone up and we’re close to that area, I’ve gone ahead and added time to the trade by rolling out the 175 put spread from June to July.
Square quick win
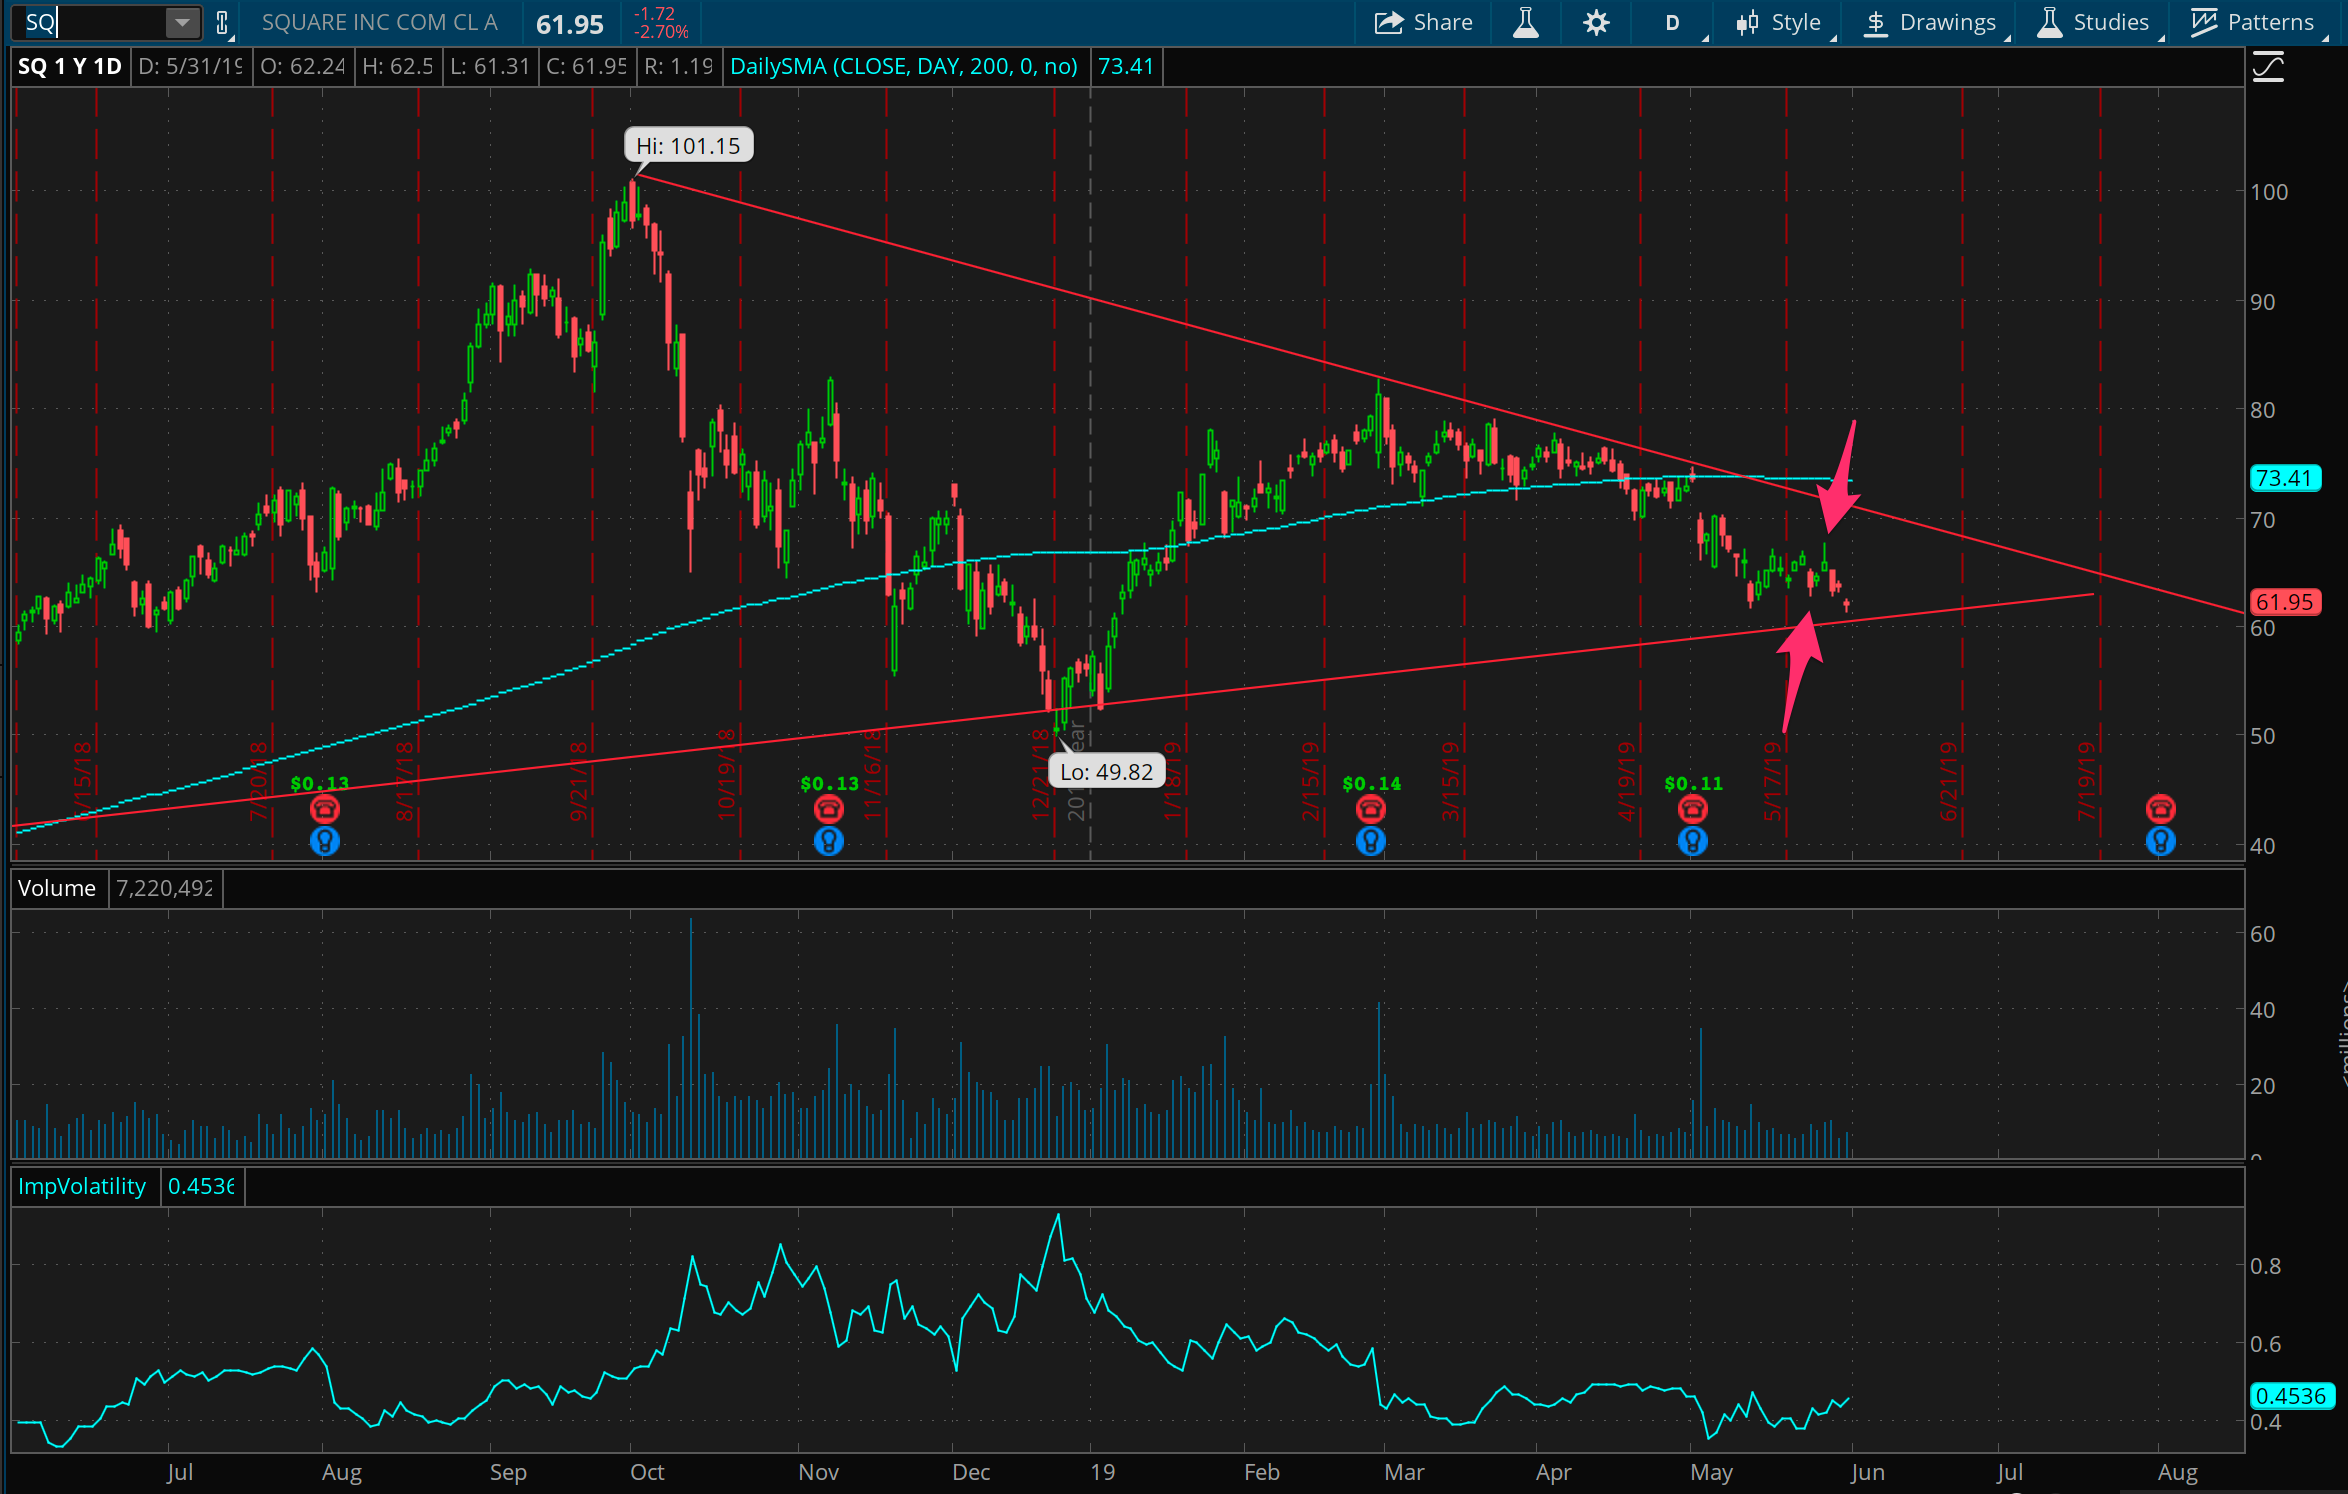
Square turned into a quick win this week, after putting in a trade for support at 60 late last week. Two days later it had a gap up opening, and I was able to close the support trade pretty quickly. Looking to reload on this now that it’s moved back down towards the same support level.
GLD taking off
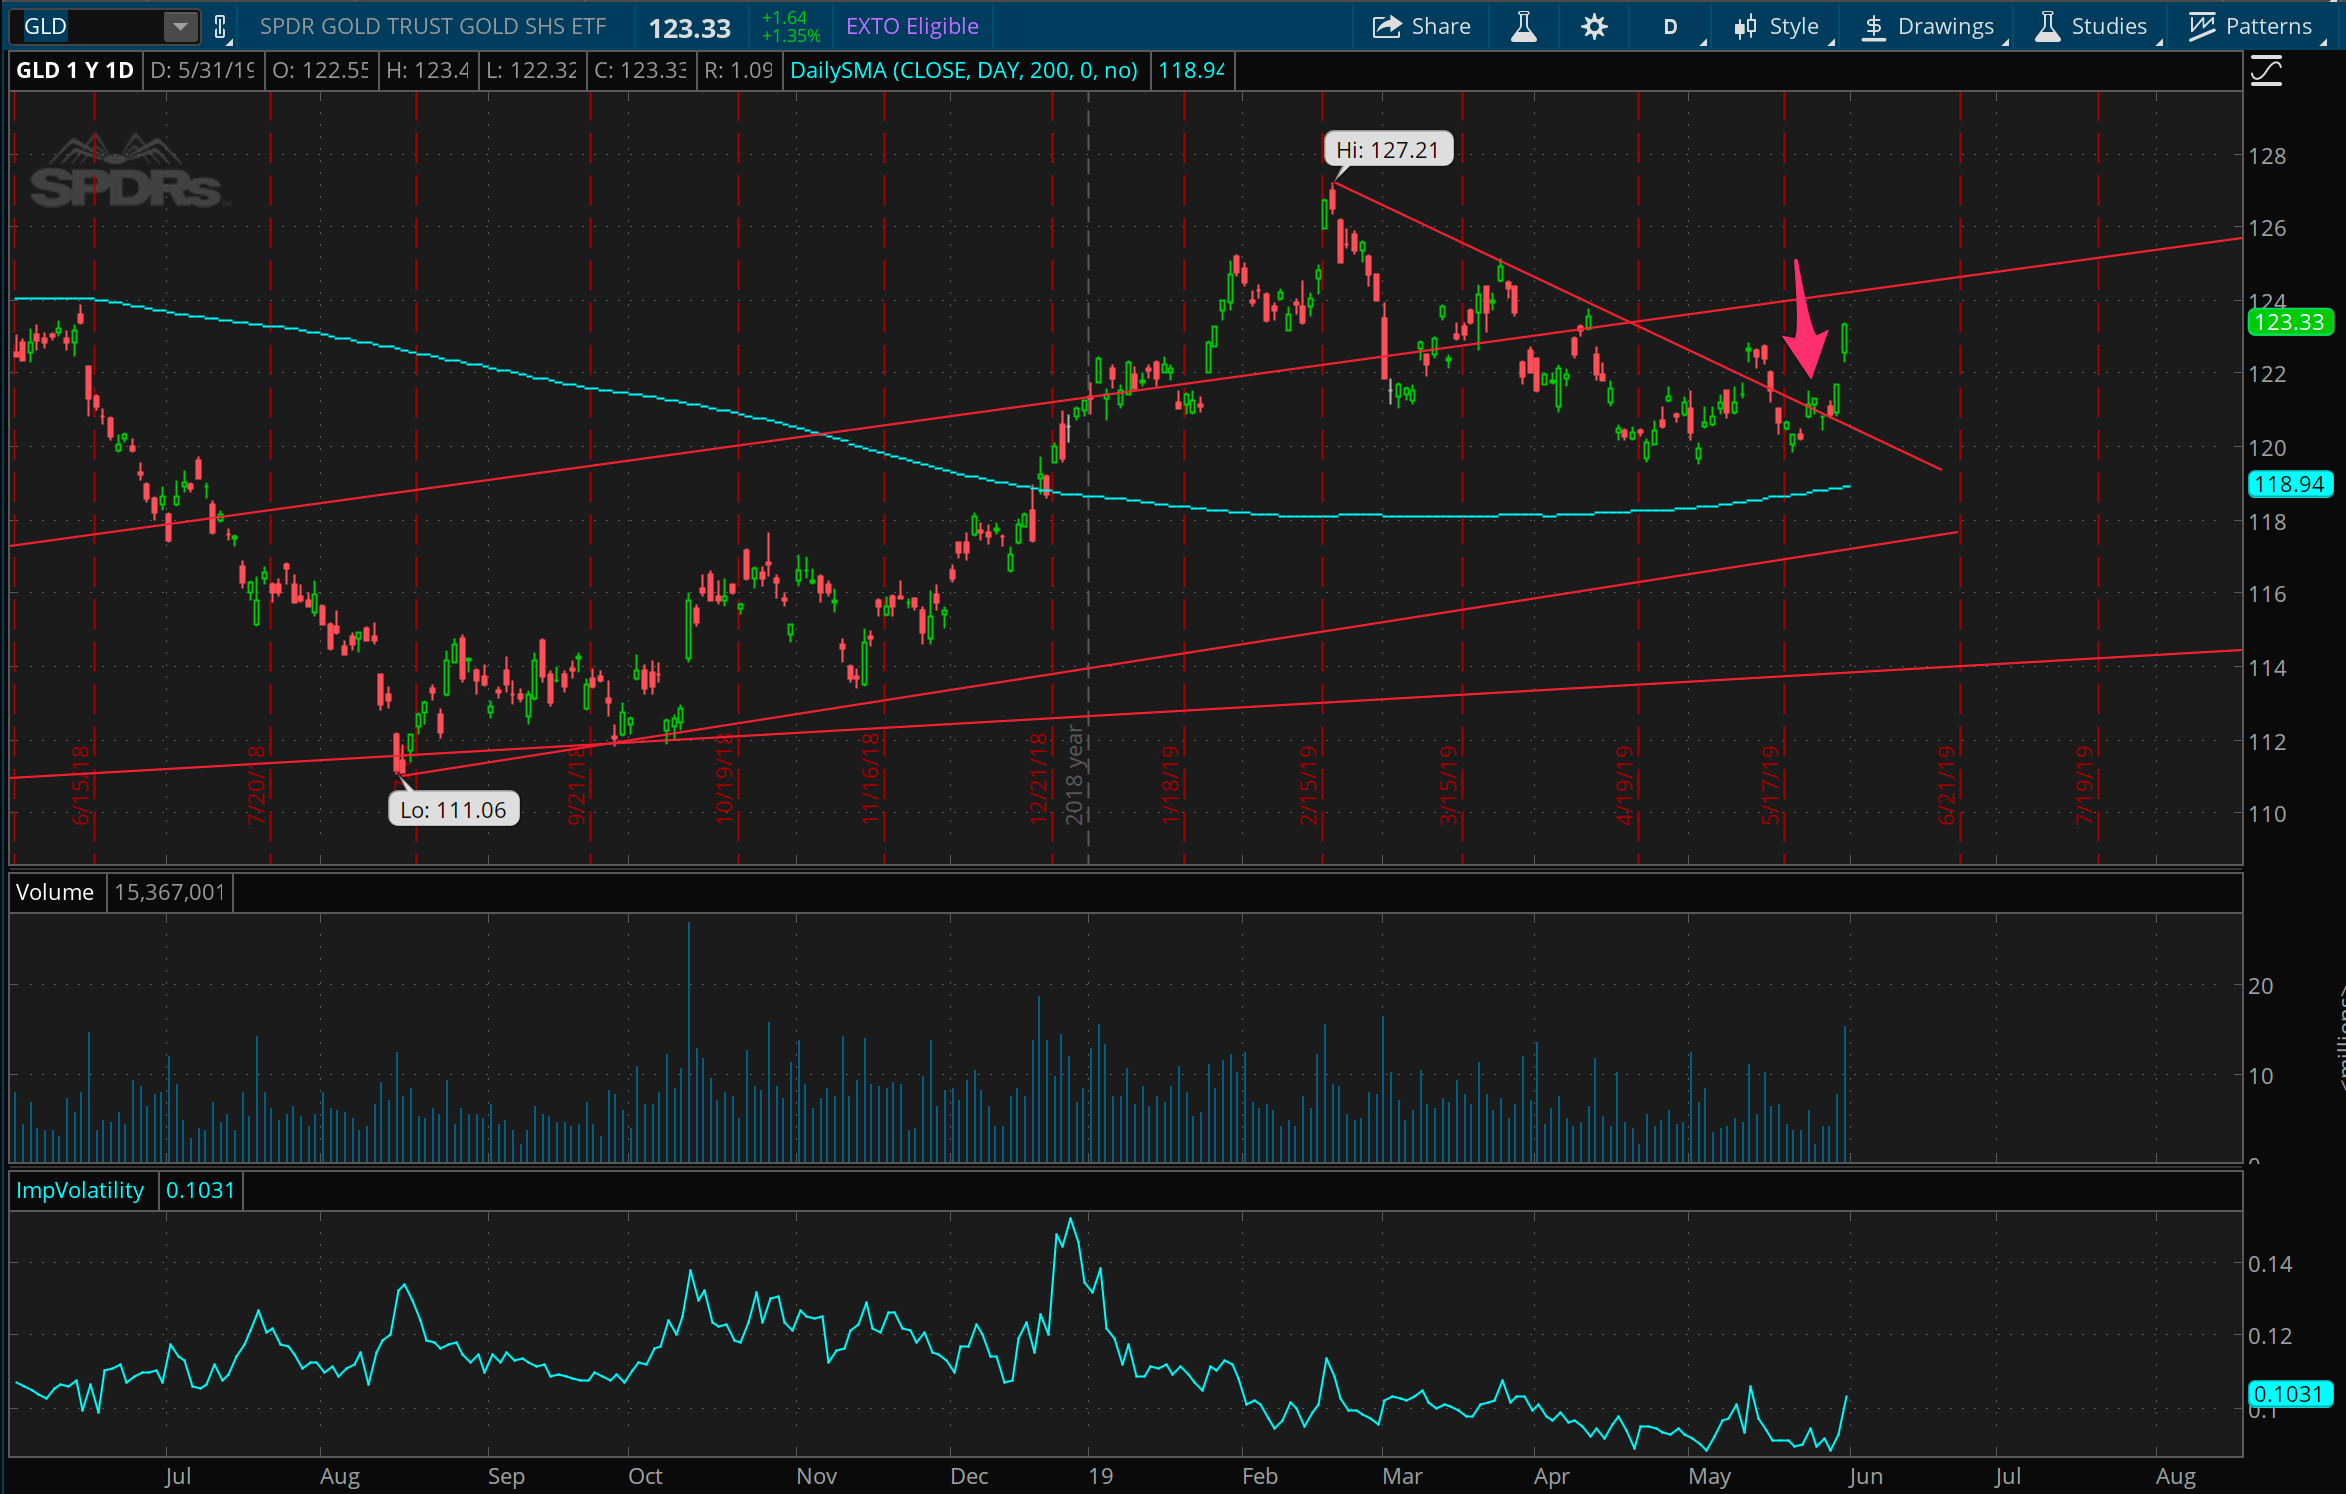
Check out gold prices, which blasted through resistance noted last week and ripped higher. My cheap downside trade didn’t work out, and I’m thankful it was a cheap shot. Leaving it on as a super cheap trade now, just in case things completely reverse over the next couple weeks.
TLT back to Trump levels
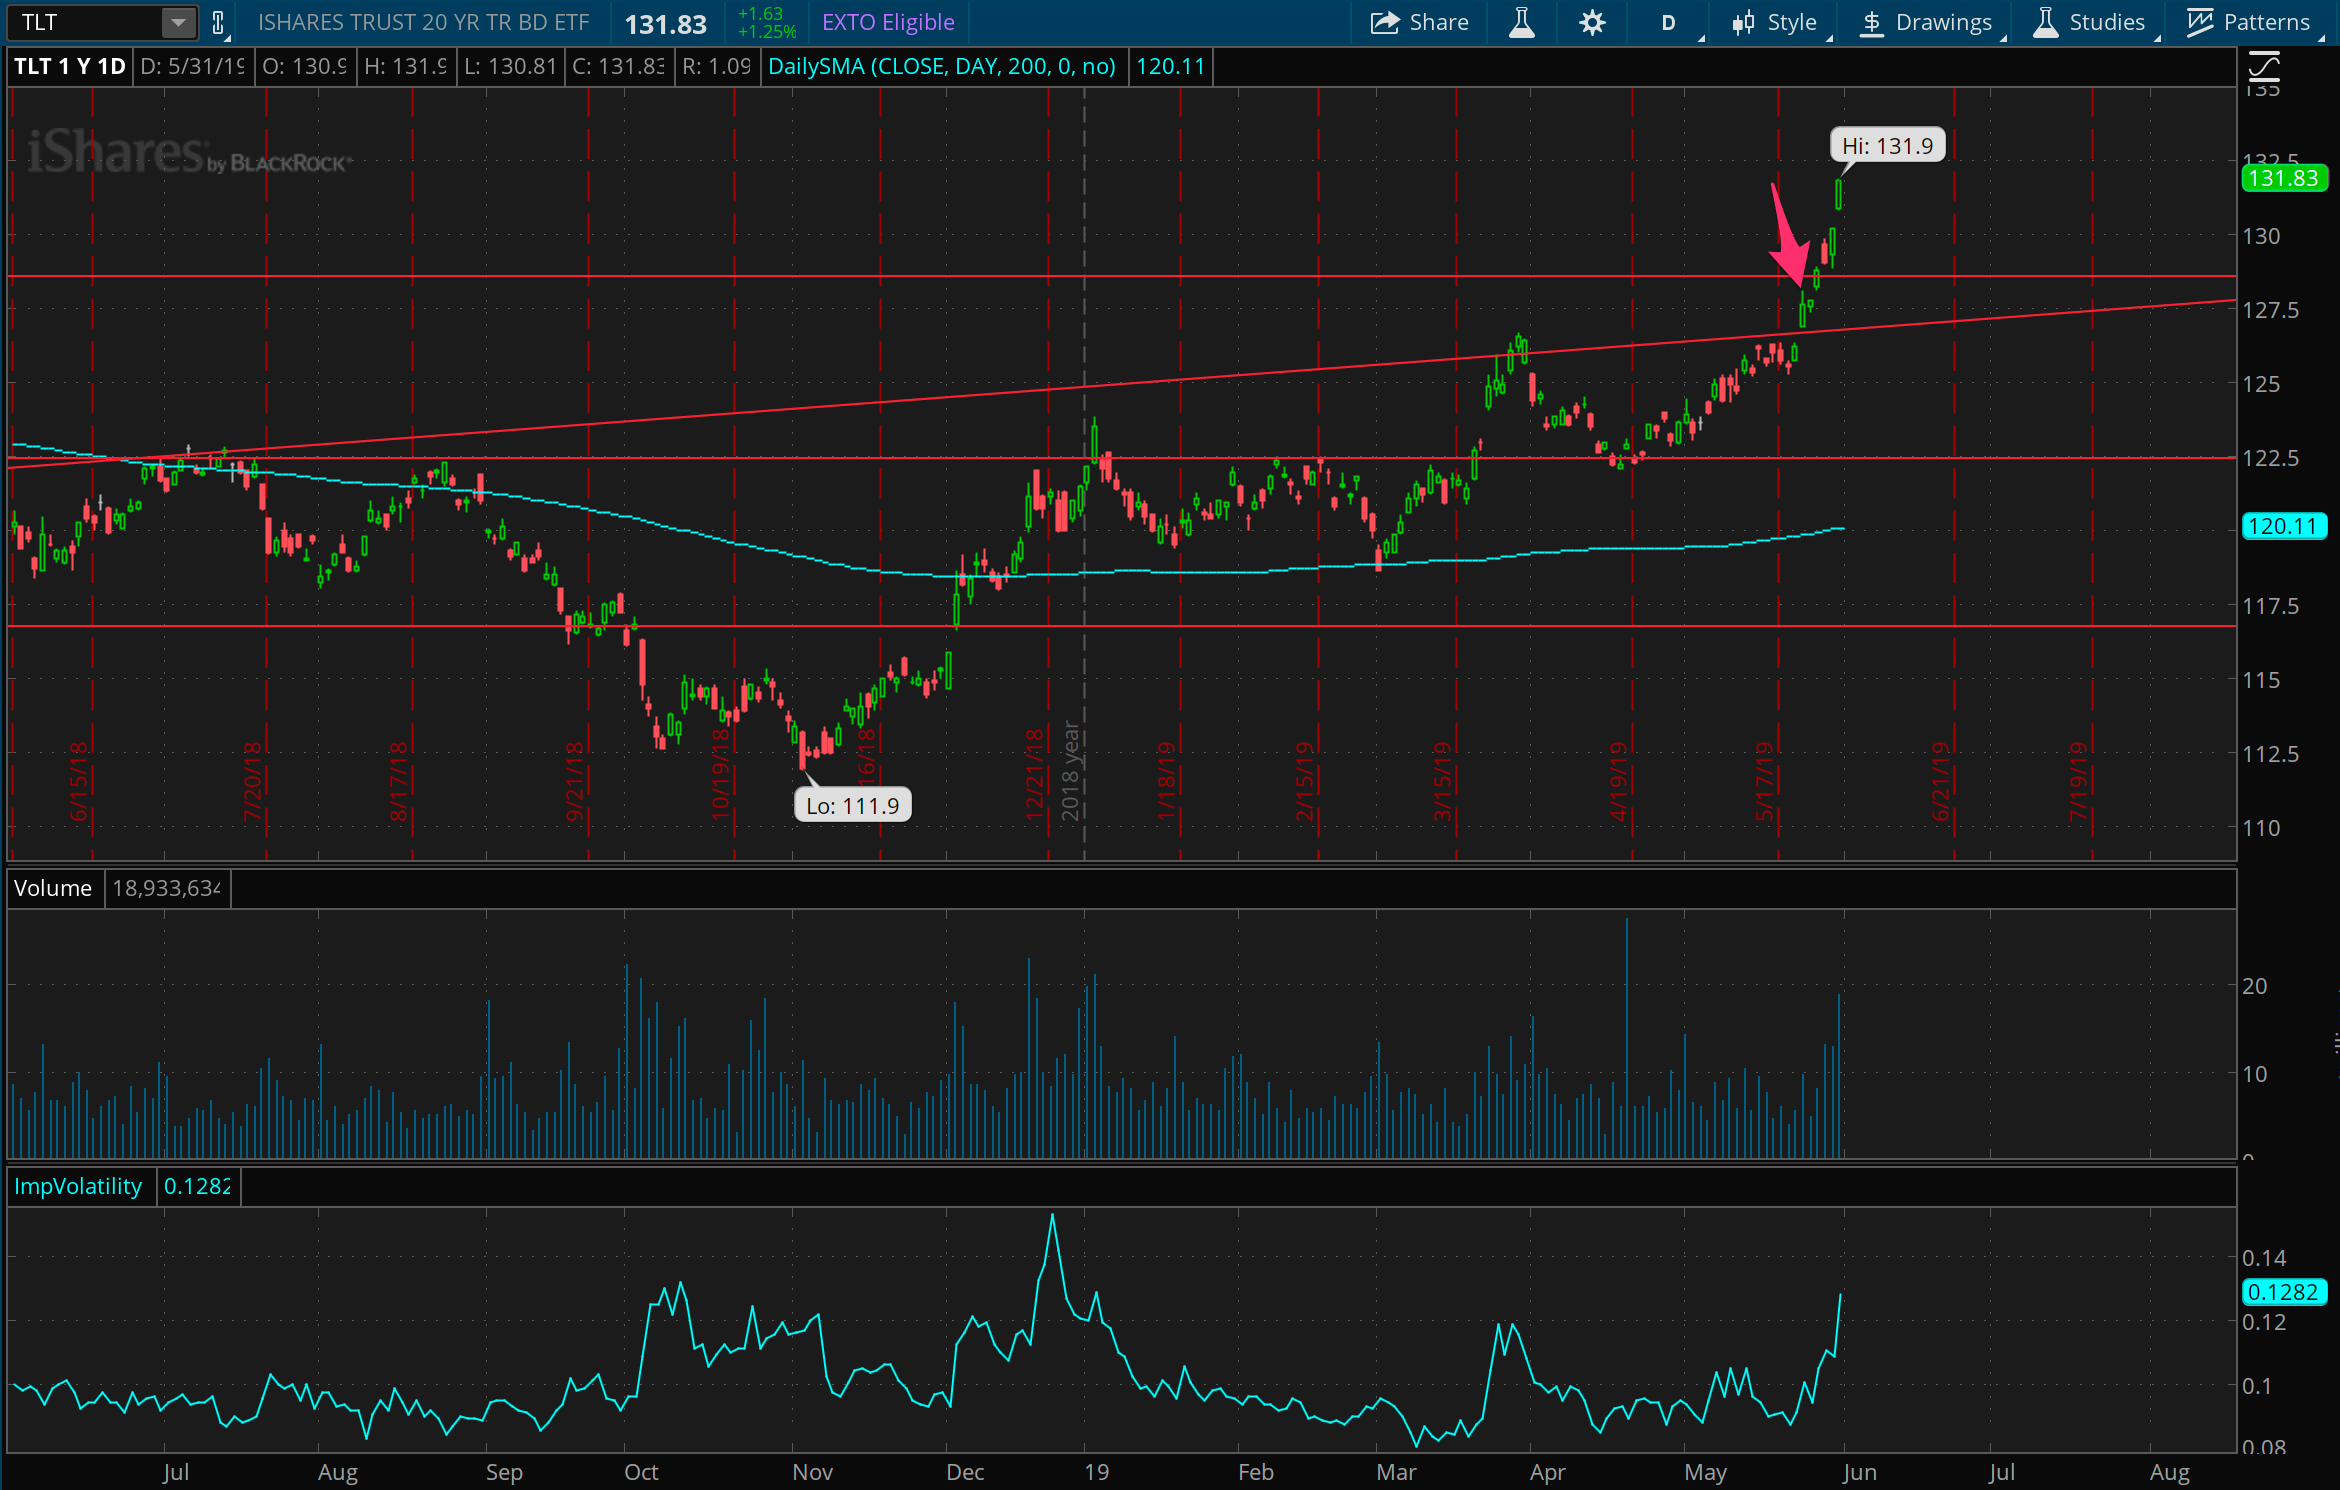
Bond prices have the same story as gold this week, except on steroids. We looked at this as a long standing and important resistance line last week, and look what happened when it actually broke through. Watching price action like this is just incredibly fun… as long as you’re not on the wrong side of the trade! Similar to gold, I had just taken a really cheap shot in here to the downside, thinking this resistance line should stick. I should’ve also taken a cheap shot to the upside, knowing that this could be a “breakout” situation if it got over that line. This 128 level might now flip over to strong support, so let’s keep an eye on it.

The 3 year bond price chart, showing the significance of this week’s move. It took us all the way back into pre-election prices which is wild. I’m assuming a small grind downwards over the next couple weeks to “digest” this big move upward. Either that or we continue to sky rocket upwards? Betting on resistance here feels like the opposite of catching a falling knife, so I’m wary of it, but maybe that’s a signal that it’s a good trade?
Twitter holds the line

Twitter one year chart shows it continuing to hold the line near 36, and I’m eager to put on a support trade there. Would have liked to put that on late this week but missed my chance.
Netflix bouncing around
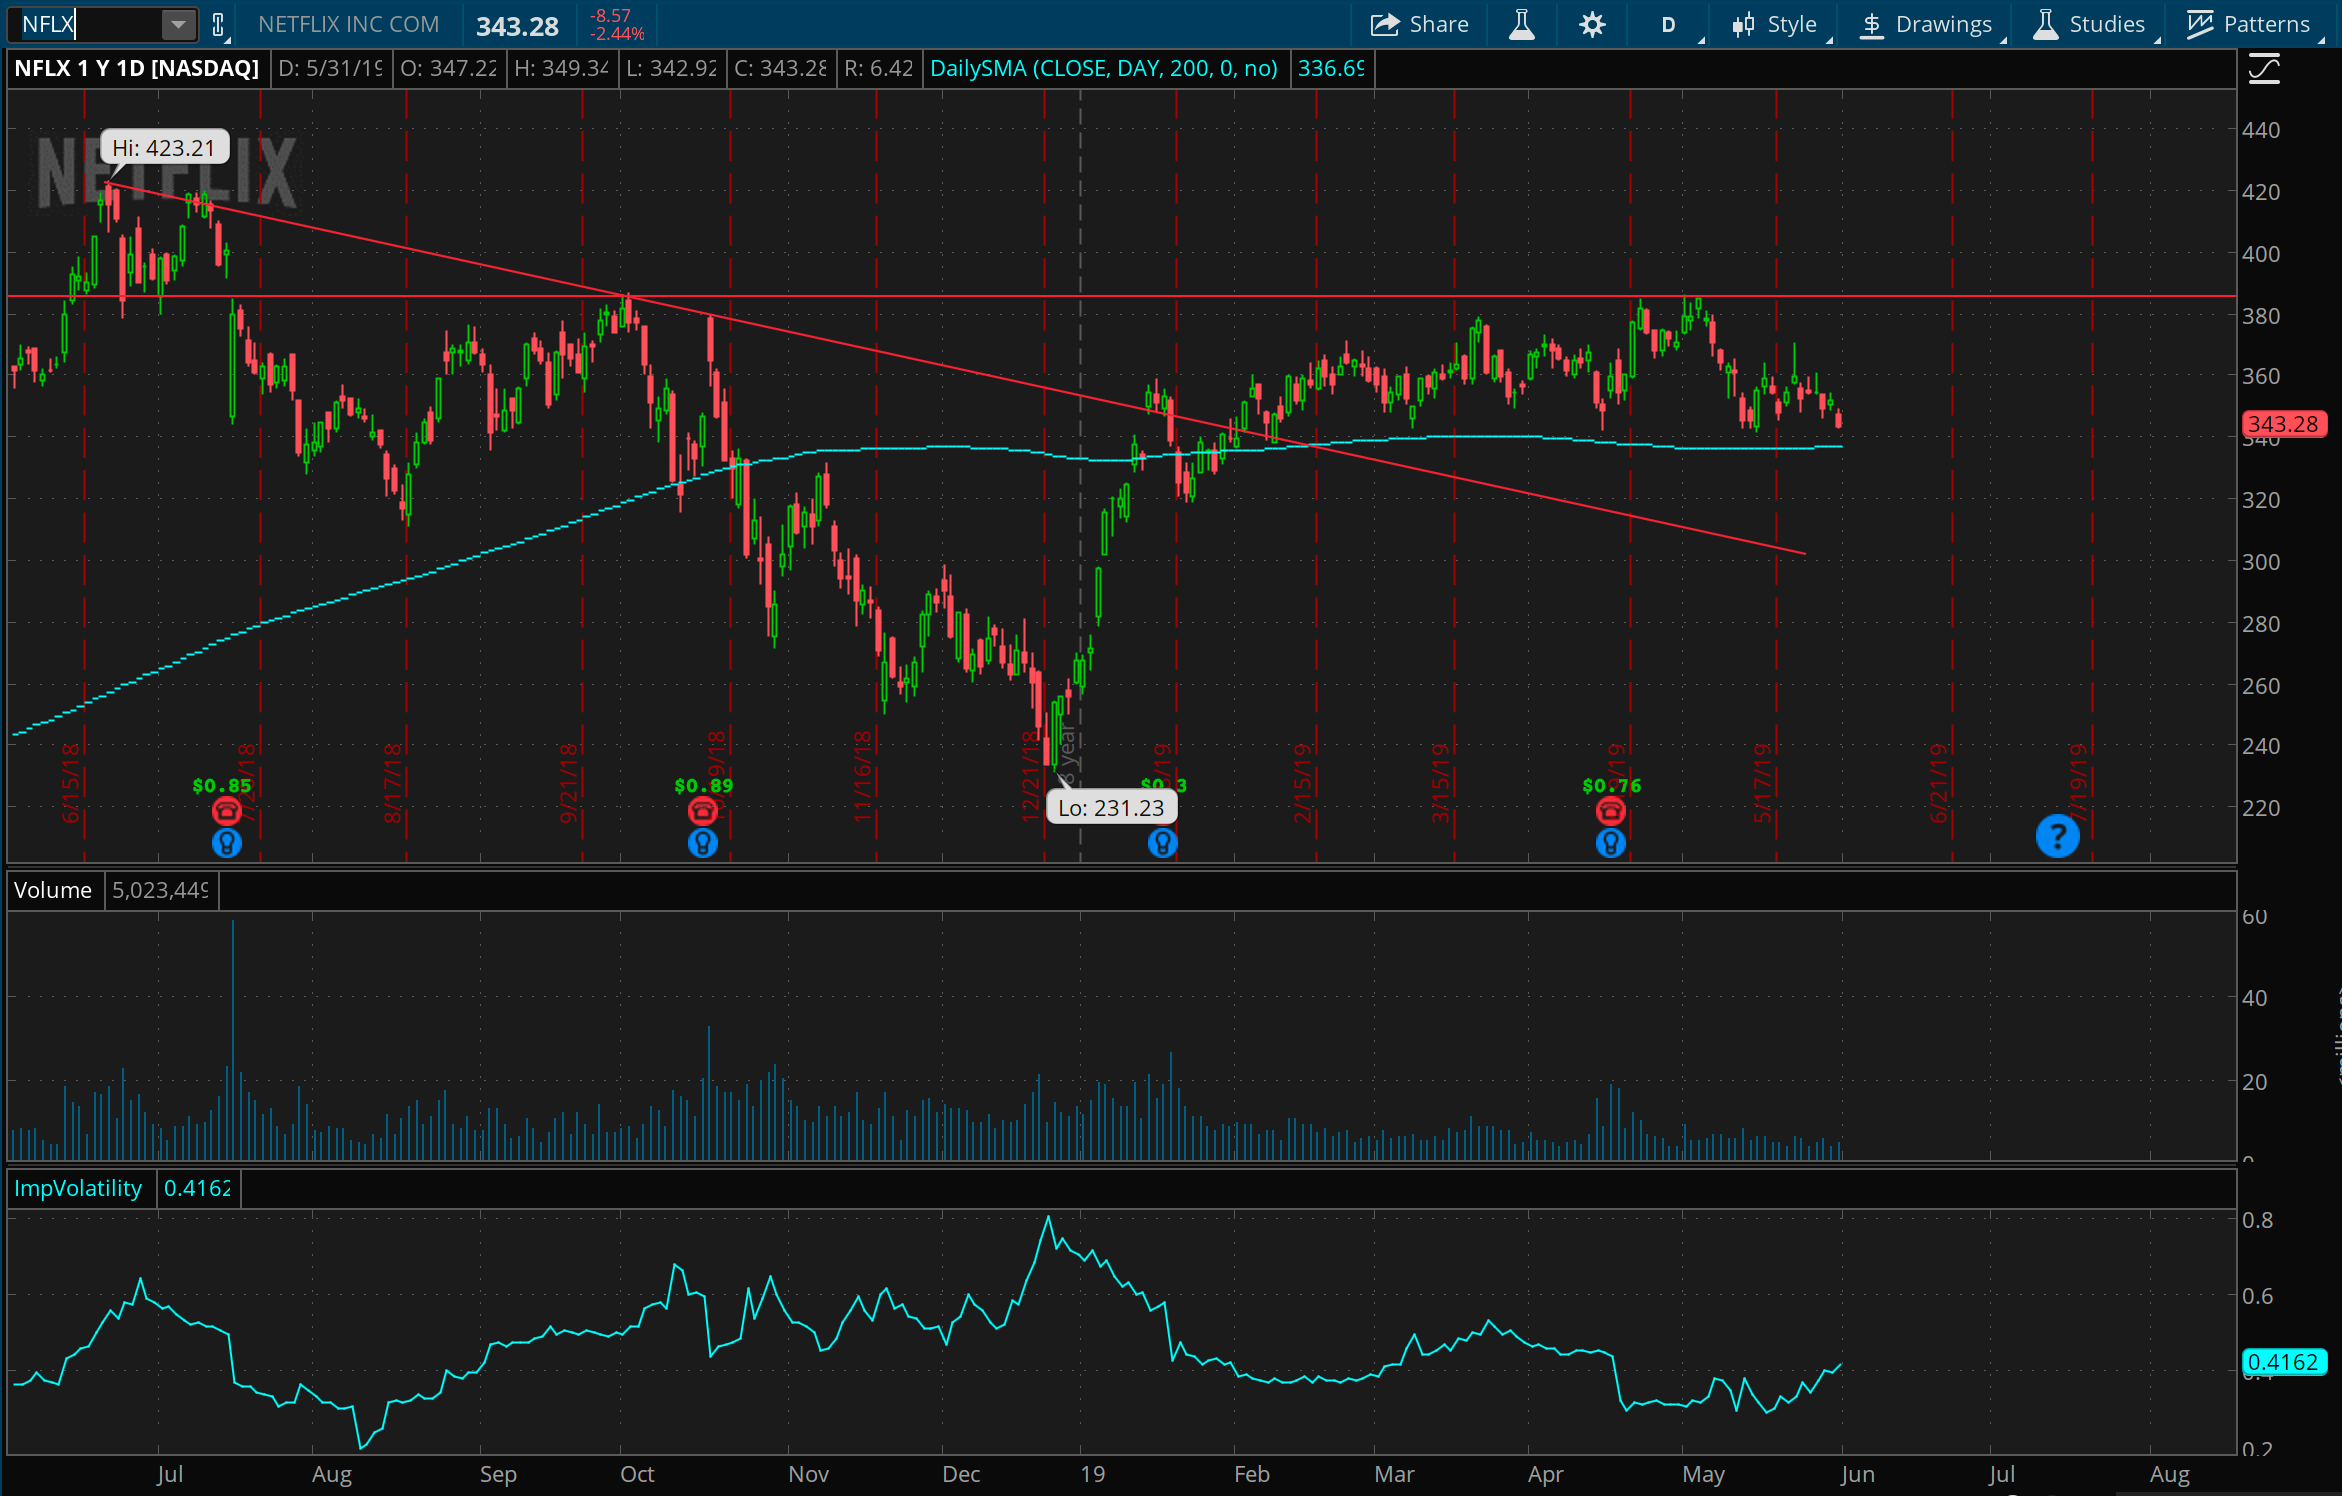
Netflix is continuing to bounce around between 340 and 360, and after a nice quick win there last week, I’m looking to reload on a support trade around 335 in the coming week.
Financials getting sick?

Oh, look at this ETF of the financial sector. Between the fall under the 2019 trend line and the 200 day moving average, this thing is looking a bit sick now. I’m eager to trade on resistance right here around 26 / 27 now.
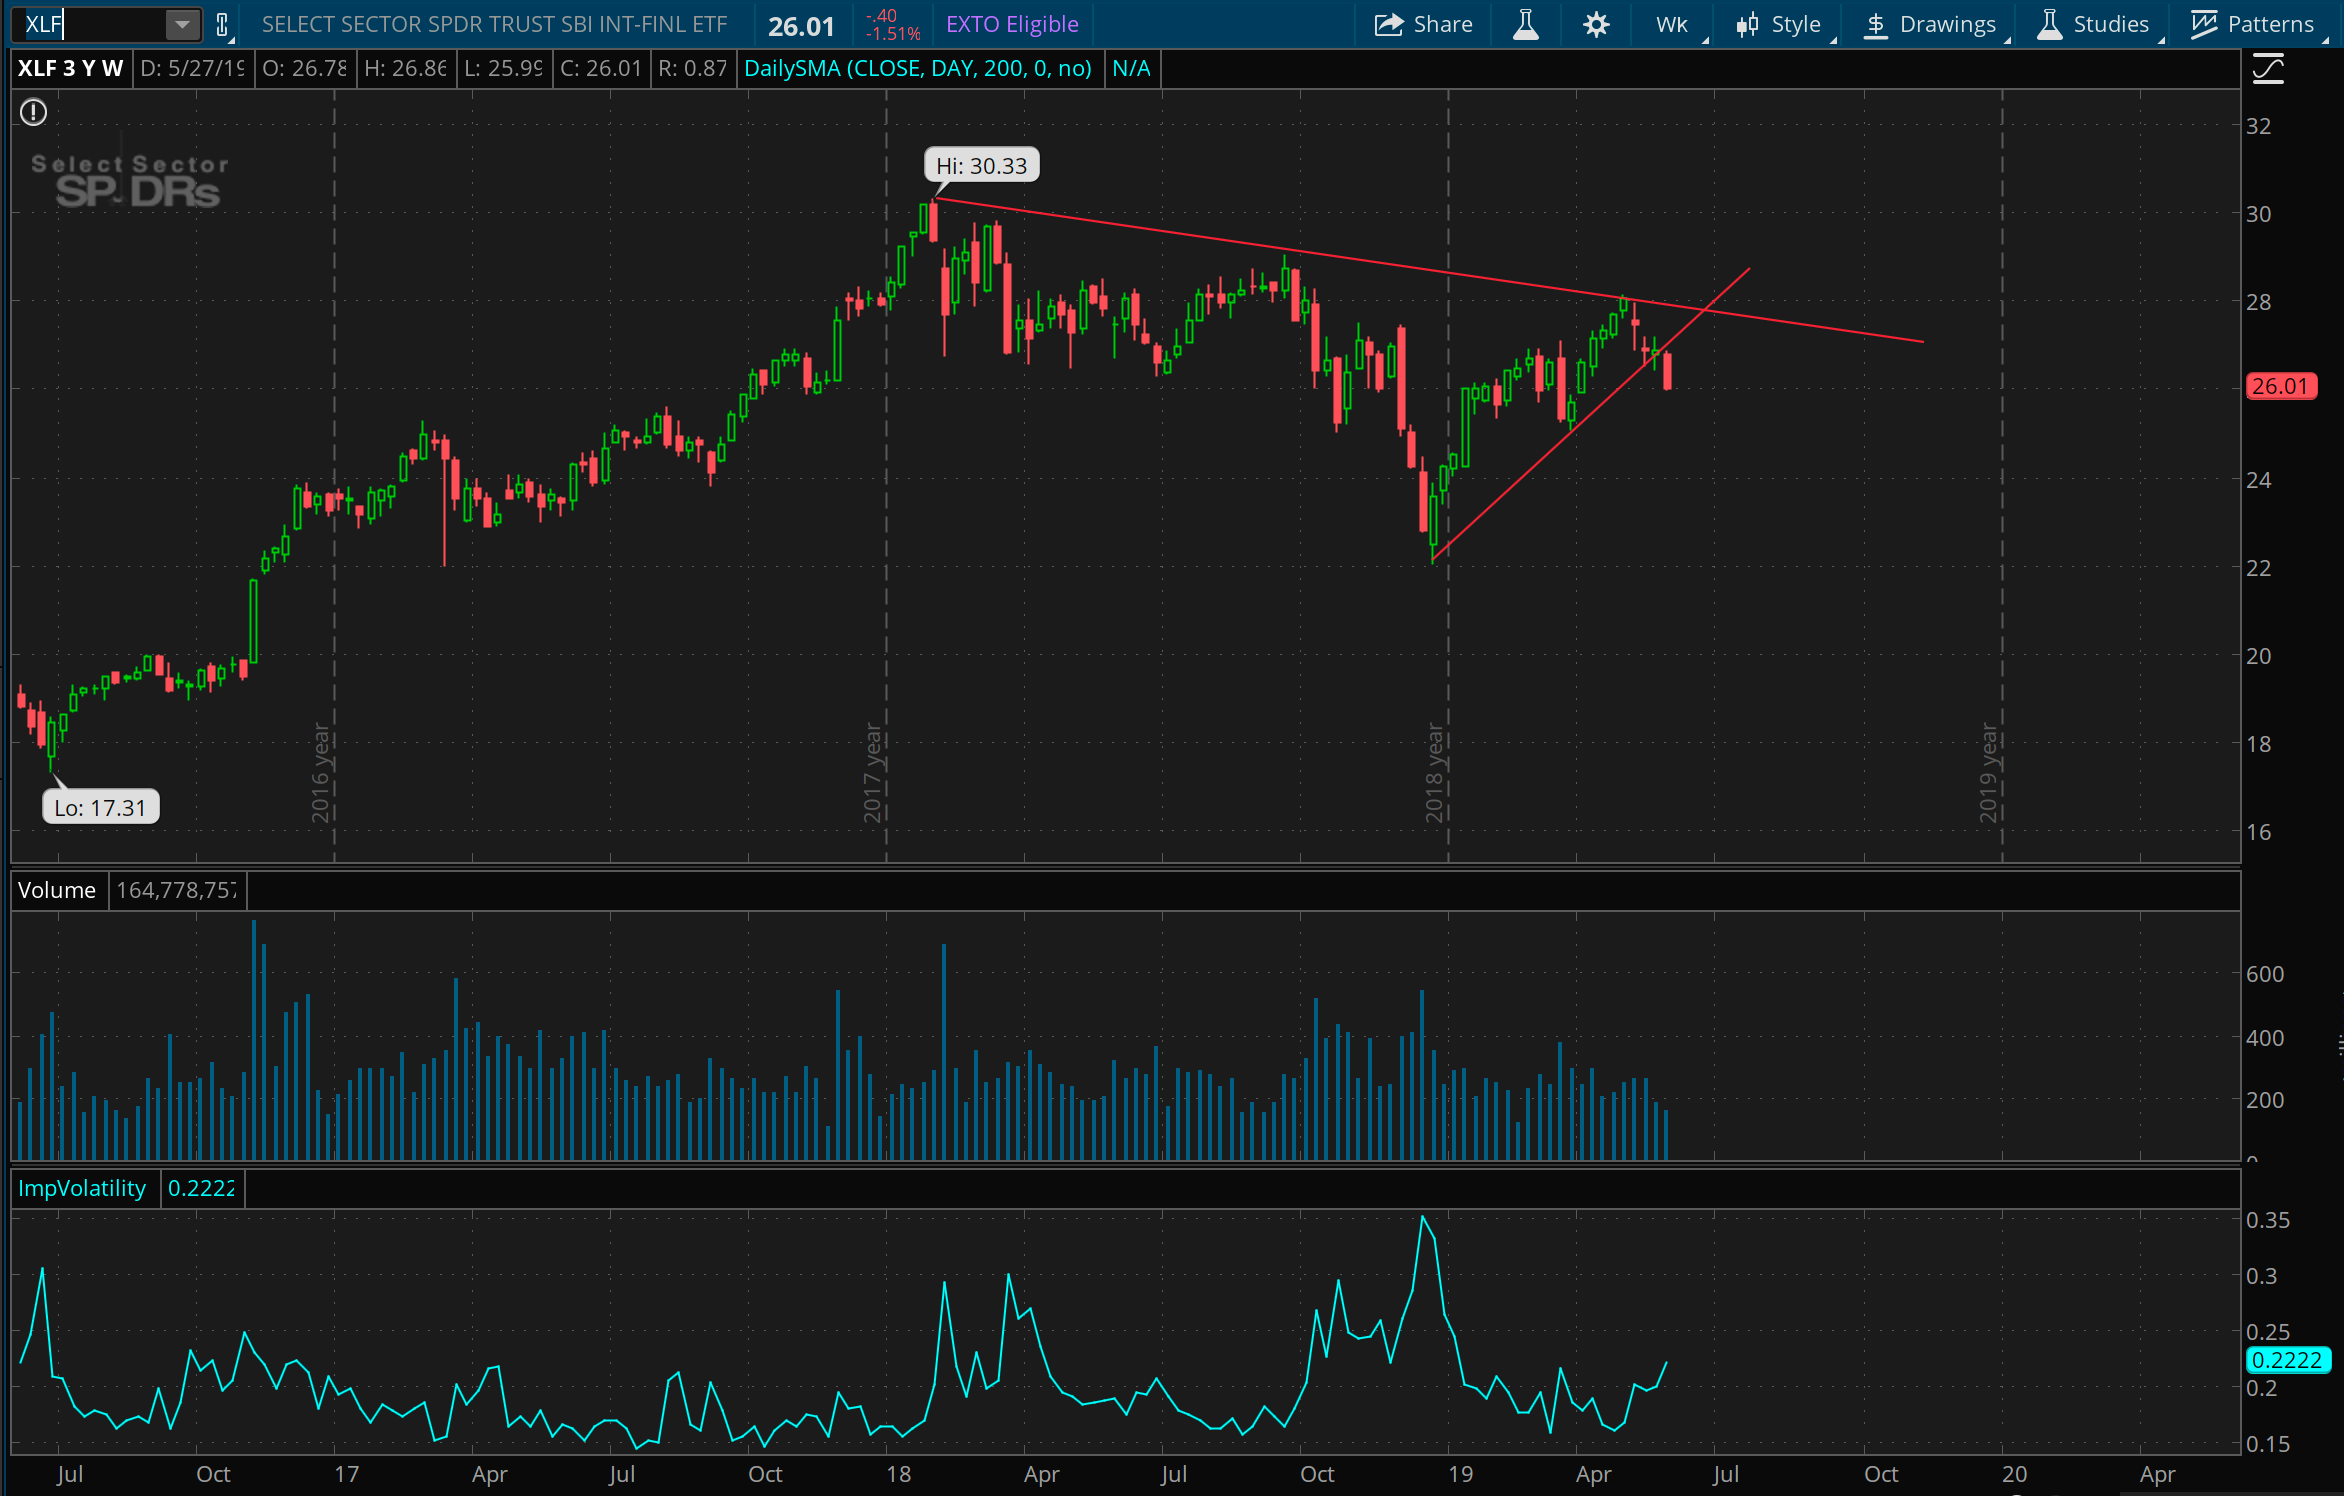
Here’s the same financial sector ETF on a 3 year chart, which paints yet more of a picture of downside possibility. This chart makes me want to really lean into the downside and maybe pick up some far out of the money puts in addition to an overhead resistance trade (i.e. call spreads).
A look at energy…
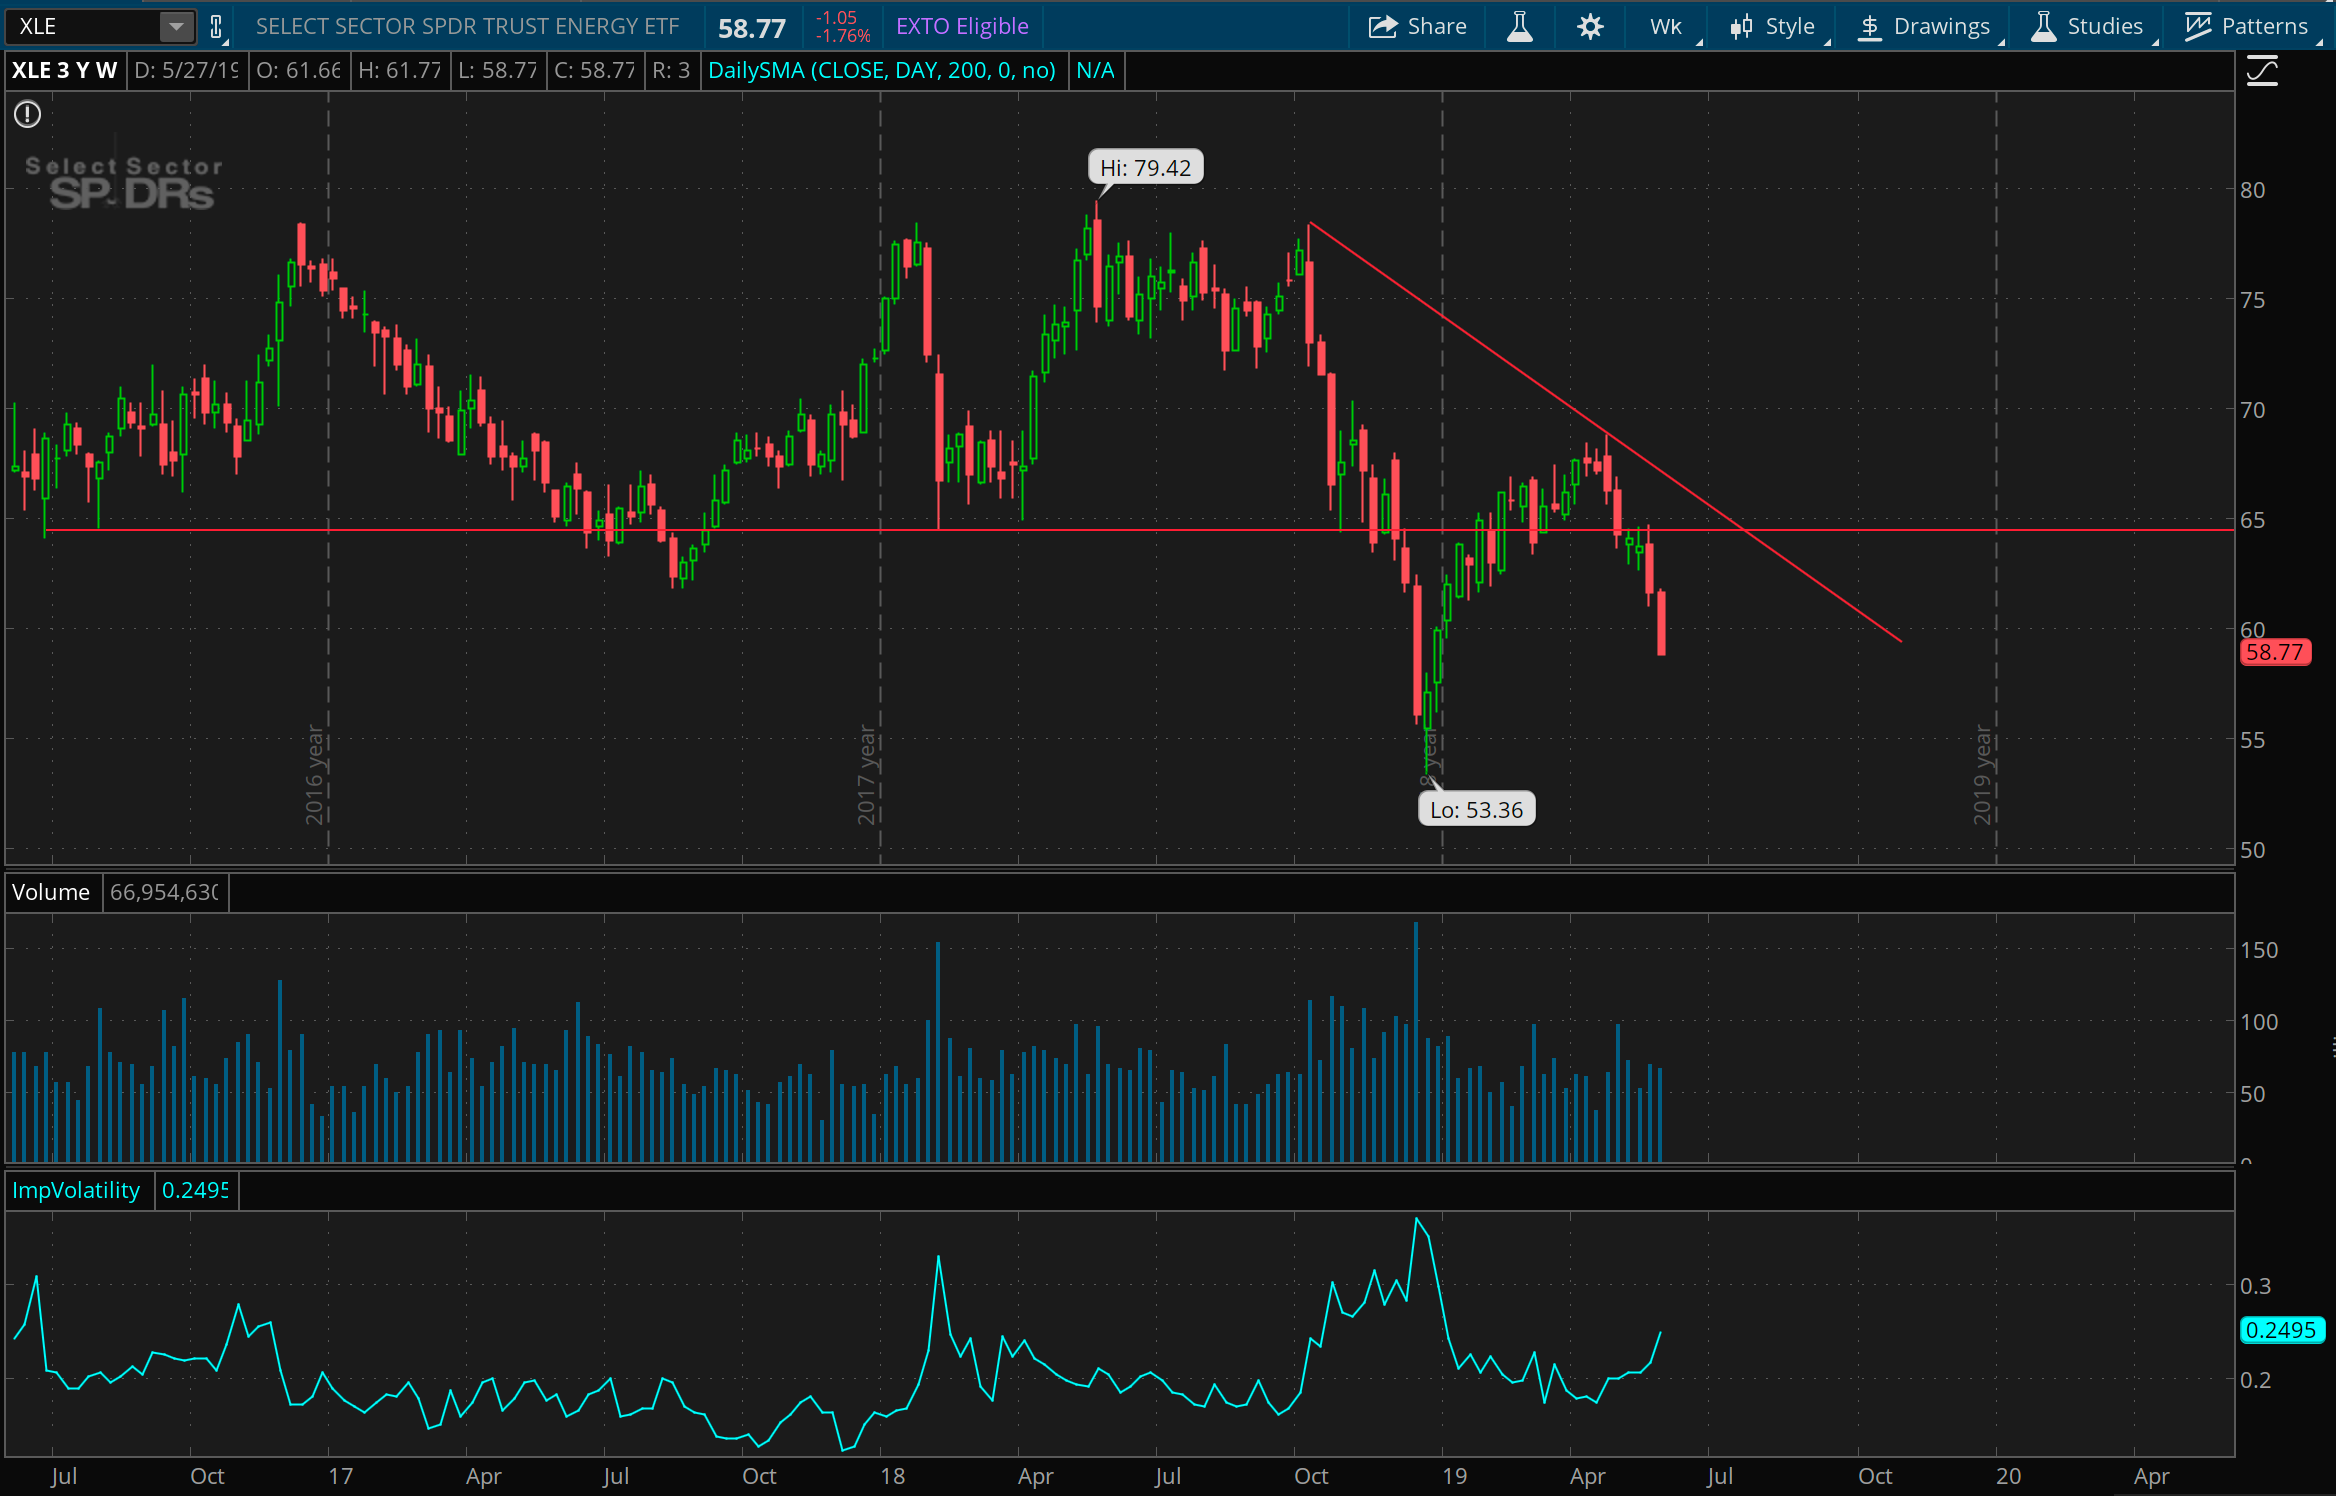
Last one, here’s the energy sector ETF, which I’m not sure is especially actionable, but felt like interesting price action to watch, with a big fall this week (corresponding to a big fall in oil prices). If it continues to crash this week, it might be interesting to put in some support trades down around 55 or 50.