
In our last post in this volatility series, we looked at two of the most popular applications of volatility in trading: gauging “extremes” in price movement, and deciding where to put a stop or entry.
In this follow up post, we’ll dig into the rest of the applications for the series, including using volatility to filter trades, size positions in a portfolio, and spot opportunities in the world of options.
Active vs Passive Filter
Last time, we talked about using volatility expansion as a signal to enter positions. Of course, you might be inclined to seek the opposite. While expanding volatility can lead to some fast and profitable trades, they are not for the faint of heart. And as we saw in the All-Weather portfolio series, minimizing volatility can lead to market-beating strategies with higher sharpe ratios.
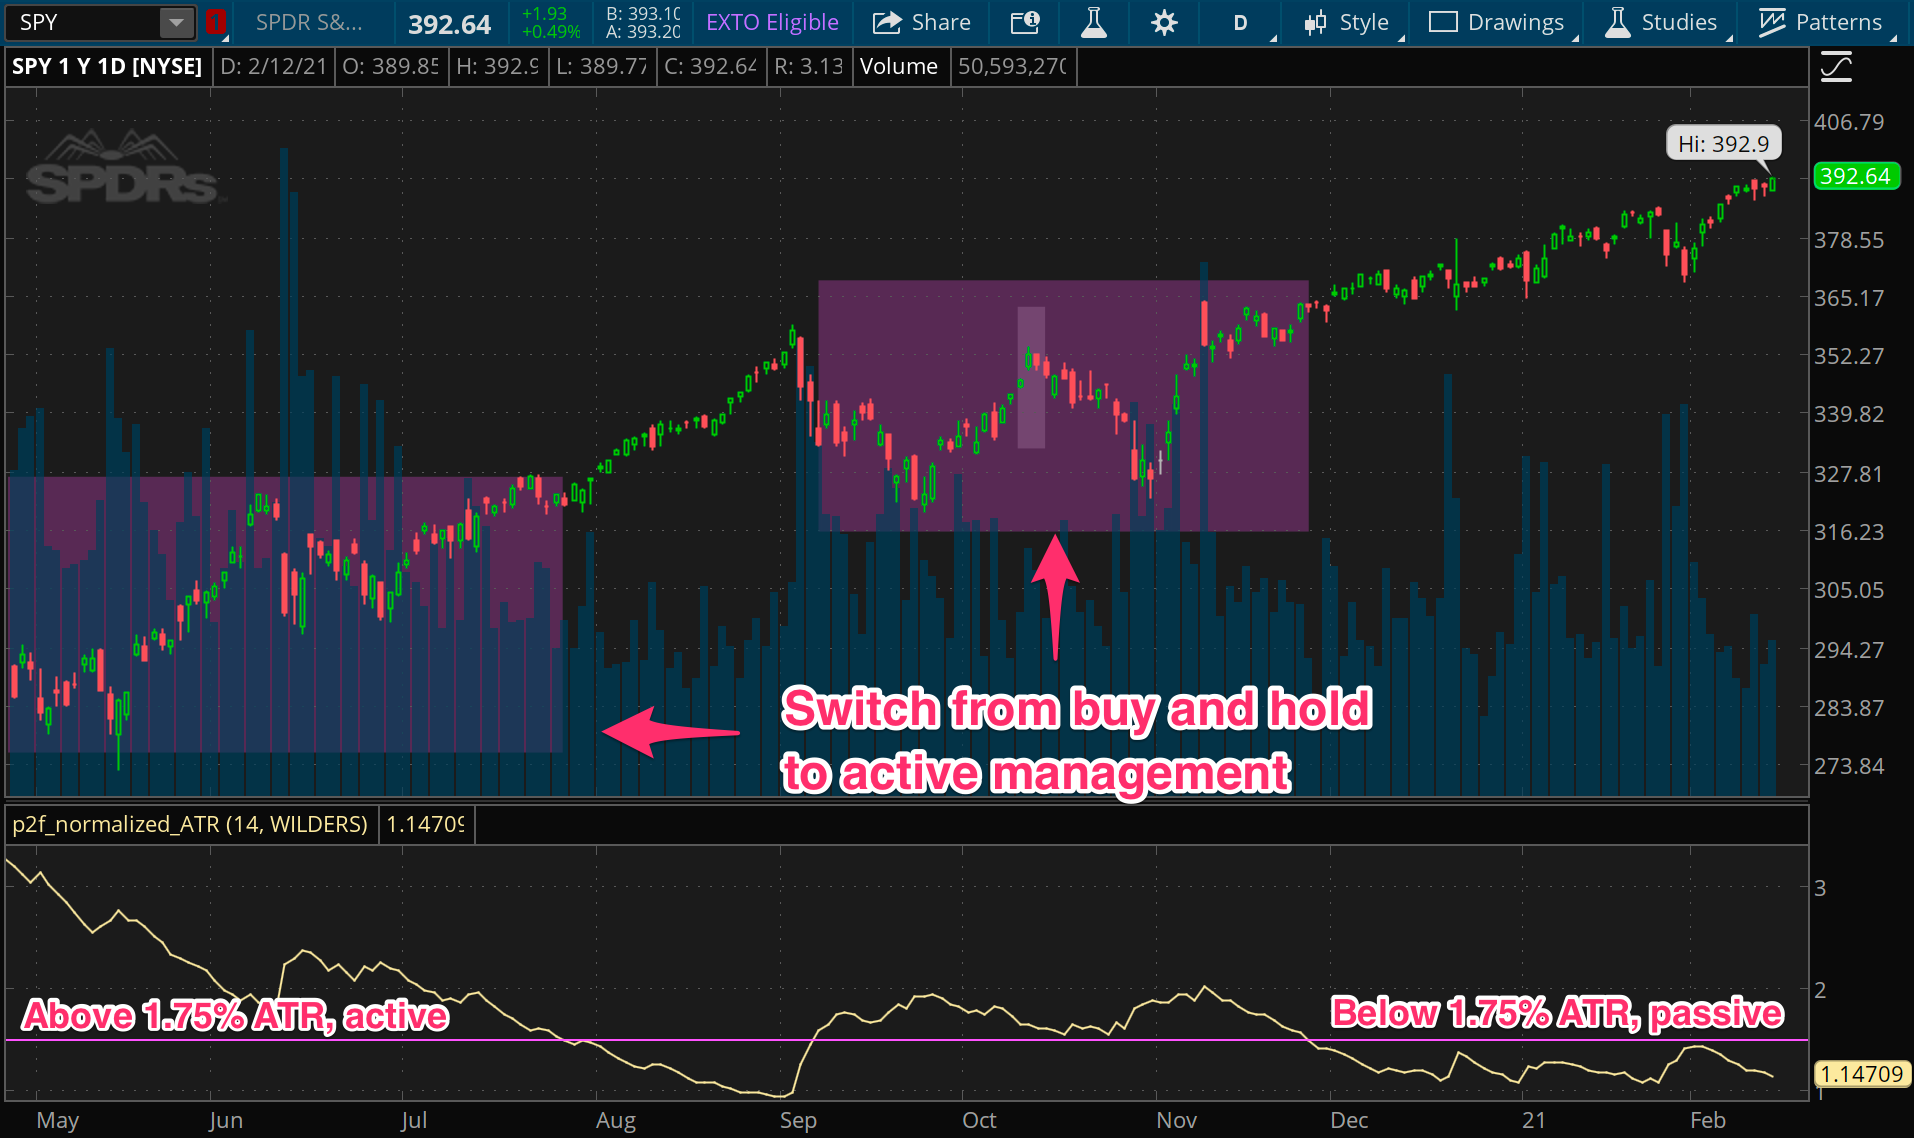
One direct way to minimize volatility is to stay out of a market when volatility is high, using a volatility filter. There is good money to be made in those long periods of steady, low volatility movement. This is certainly the case in broad market indices. So if we can make a rule about when to stay out, we might be able to realize better results. But the filter doesn’t need to mean “in or out”. It could just indicate whether we should be more active or passive. When volatility picks up, we want to get more active in managing positions.
We can create a volatility filter using the normalized ATR, which we covered in the first post of this series. Even a basic rule like “stay out when the ATR is over 2%” can be quite powerful. The final post in this series will show off a simple but effective strategy using a volatility filter on the S&P index. The example below shows a preview of this, using a normalized ATR value of 2% as the threshold to switch from passive to active.
Sizing Things Up
Minimizing volatility isn’t a requirement to a profitable strategy, but managing volatility is. Managing portfolio volatility is all about constructing positions that won’t wreck the whole portfolio. One approach is to directly manage how much any one position can move your portfolio around.
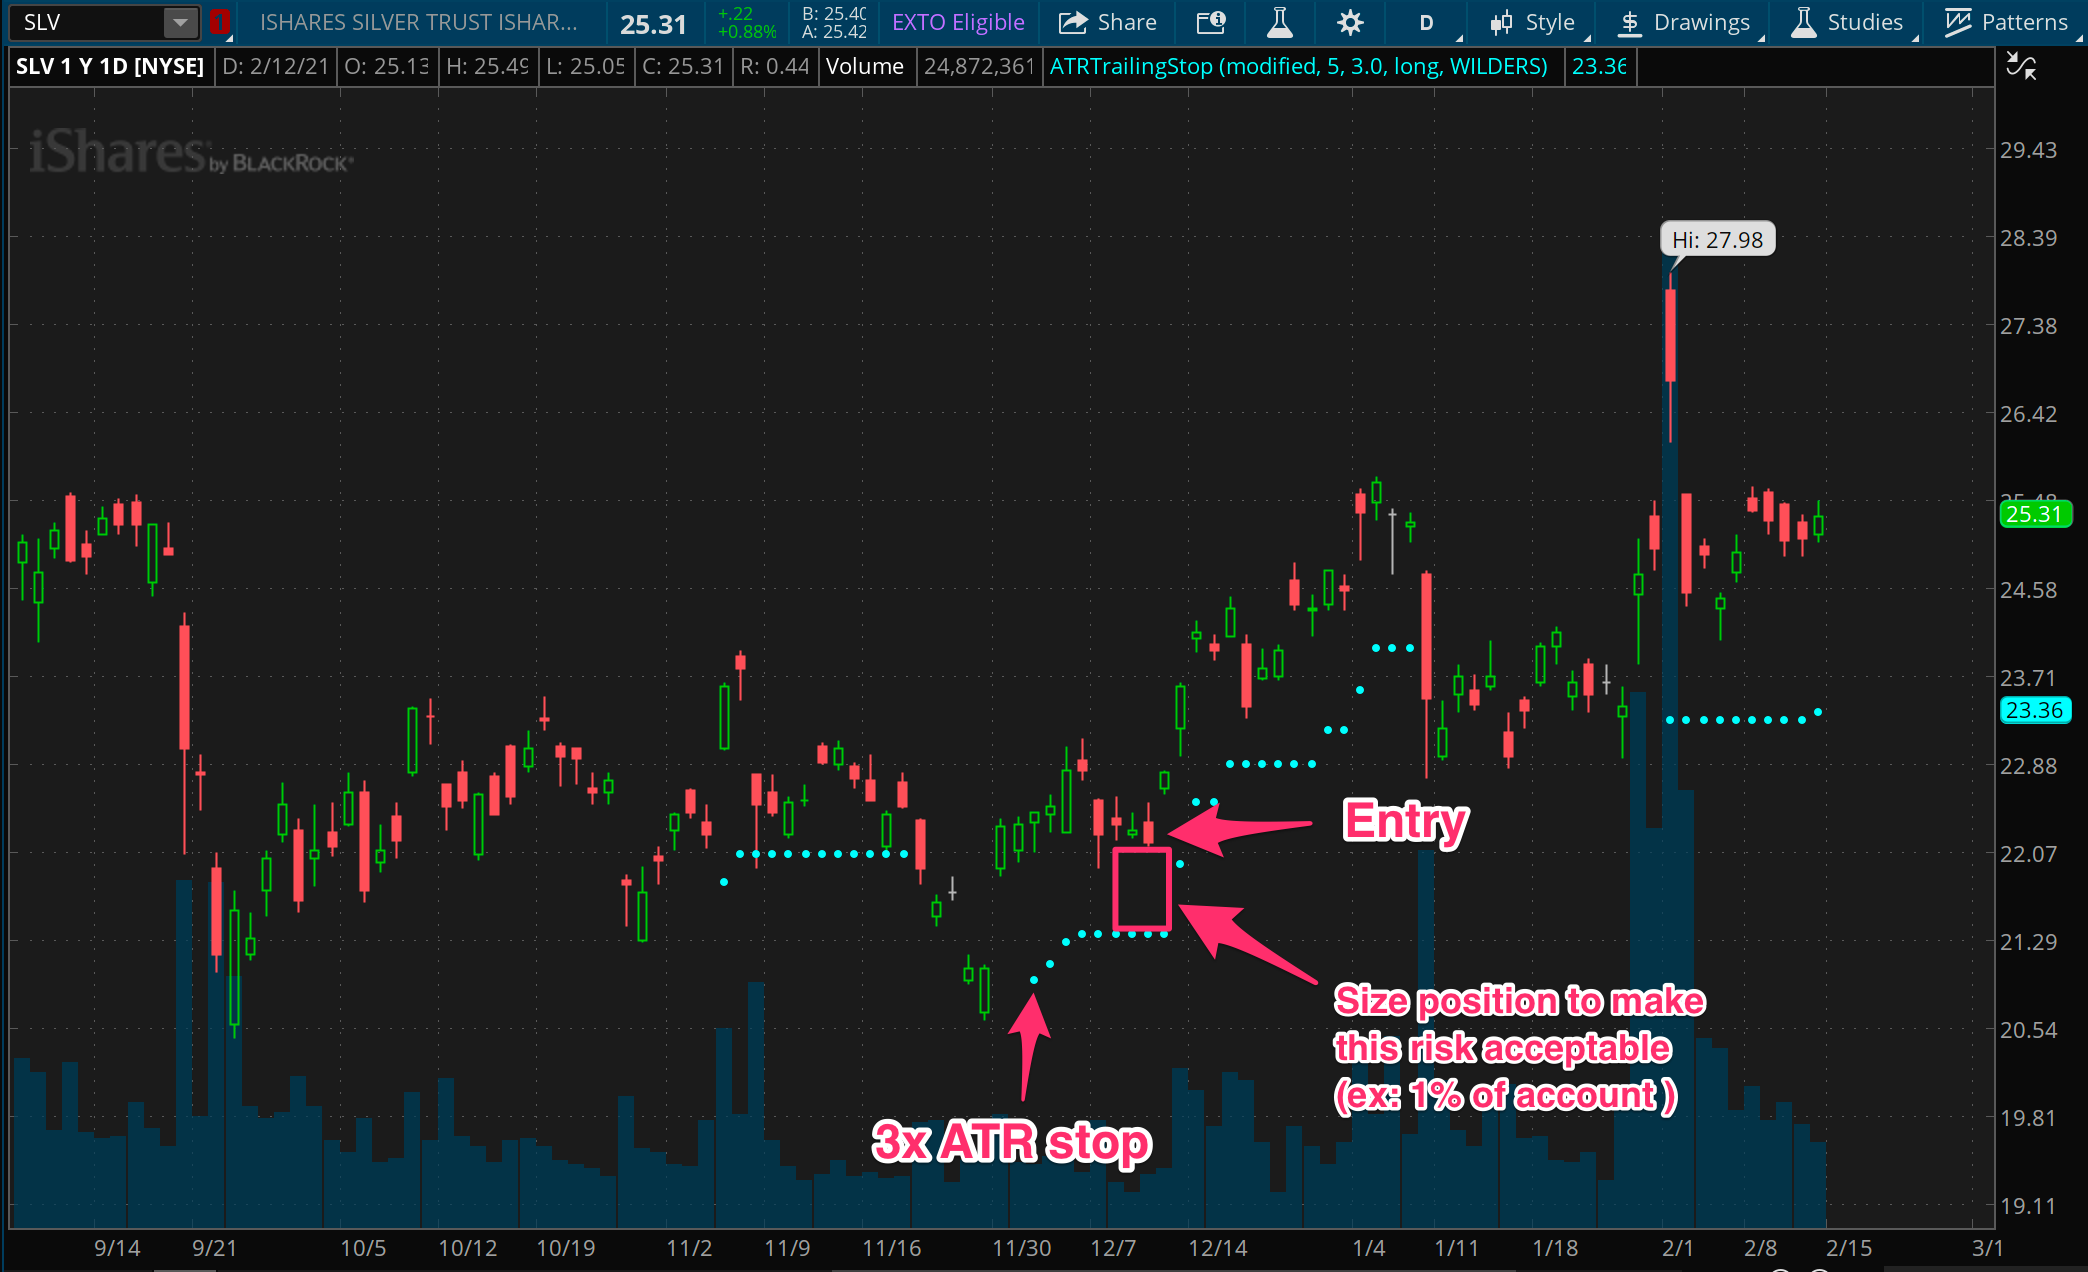
There a couple ways this can be done, including the use of a stop on entry (a technique we talked about in the last post), then sizing the position according to what you could lose if you hit the stop. This is a very common approach to sizing positions. For example, we might impose a rule of keeping the max loss on any one position to 1% of the portfolio, and then size each position based on that amount.
As a quick example, imagine taking a trade on SLV, around $25. The 3x ATR stop might be at $22. So your max loss (under normal circumstances) is around $3 per share. Let’s say your trading portfolio has a value of $30,000. If you’re putting 1% max at risk for any one position, that is $300 max risk. Therefore, a full position in that SLV trade is 100 shares, since 100 times the $3 per share risk is $300.
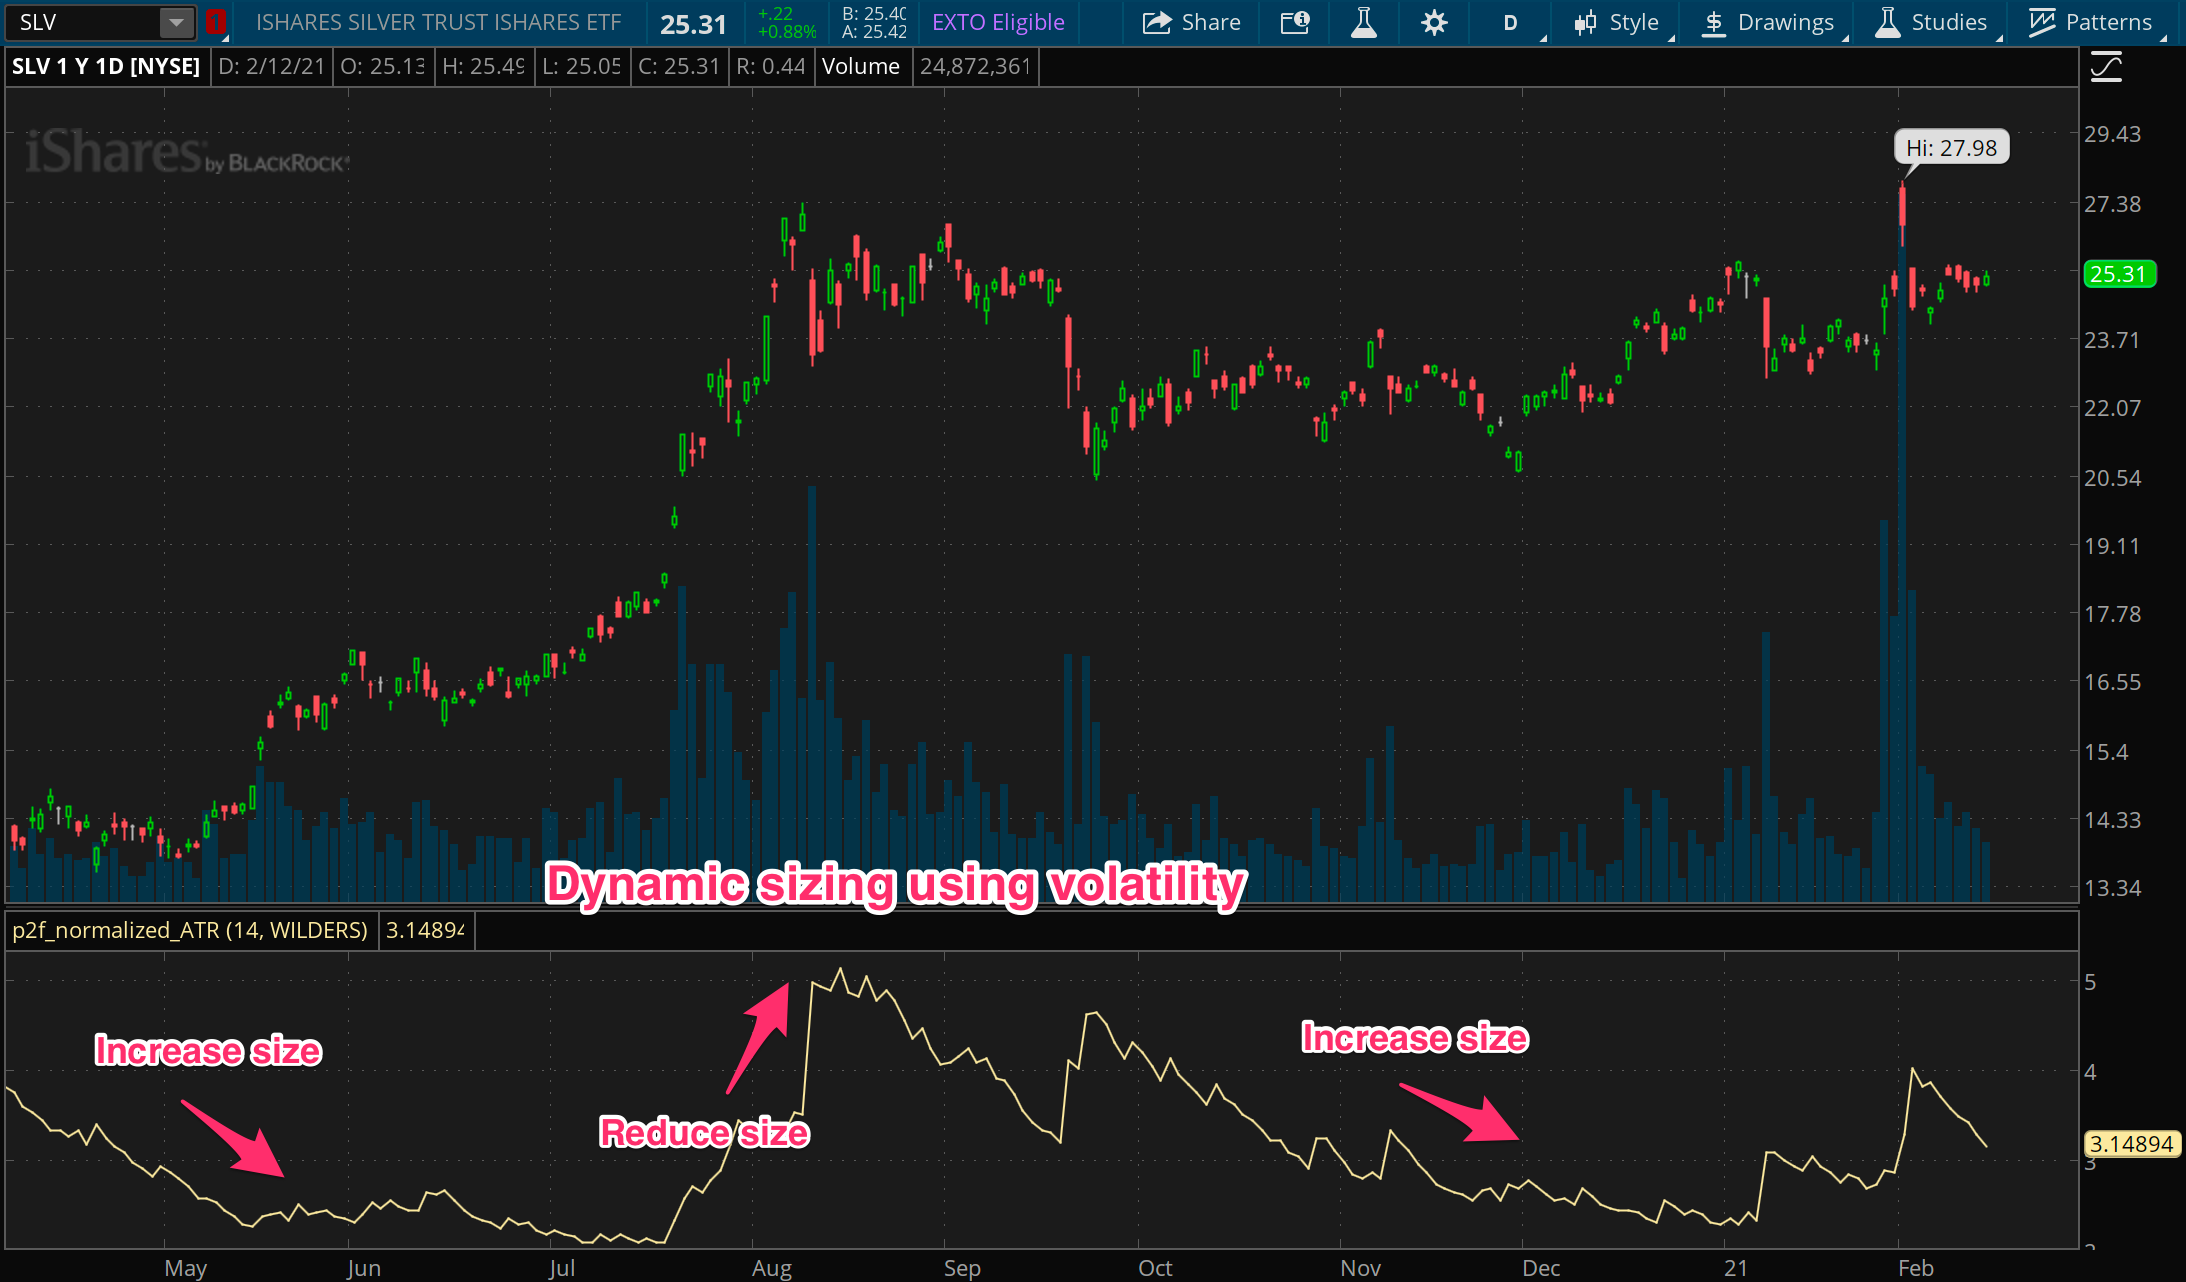
There’s another way to size positions using volatility which isn’t as popular, but just as viable. Instead of using stops to define risk and then sizing the position according to that, traders can also size positions to link instrument volatility directly to position volatility.
How does this work? Let’s consider that same SLV position discussed above. Imagine instead of the rule “no position should risk more than 1% of the portfolio”, we actually set a rule of “no position should move my portfolio around by more than 0.5% each day”. With a target daily position volatility of 0.5% (or 50 basis points), we can size it based on the instrument volatility.
So if SLV is currently moving around with a 5% daily volatility, we need to ensure that the 5% moves are only having an effect of 0.5% on the portfolio. This means we can allocate (0.5 / 5) of our total portfolio to SLV, which works out to 10%. If our portfolio is $30,000 then we can take a $3,000 position in SLV, or about 120 shares worth, at the current price of $25.
The thing is, the volatility will change! So the position needs managed and resized continually over time. Sometimes volatility can change quite rapidly, and break the portfolio risk parameter, so you should still set some ‘sanity stops’ as well.
Exploring Your Options
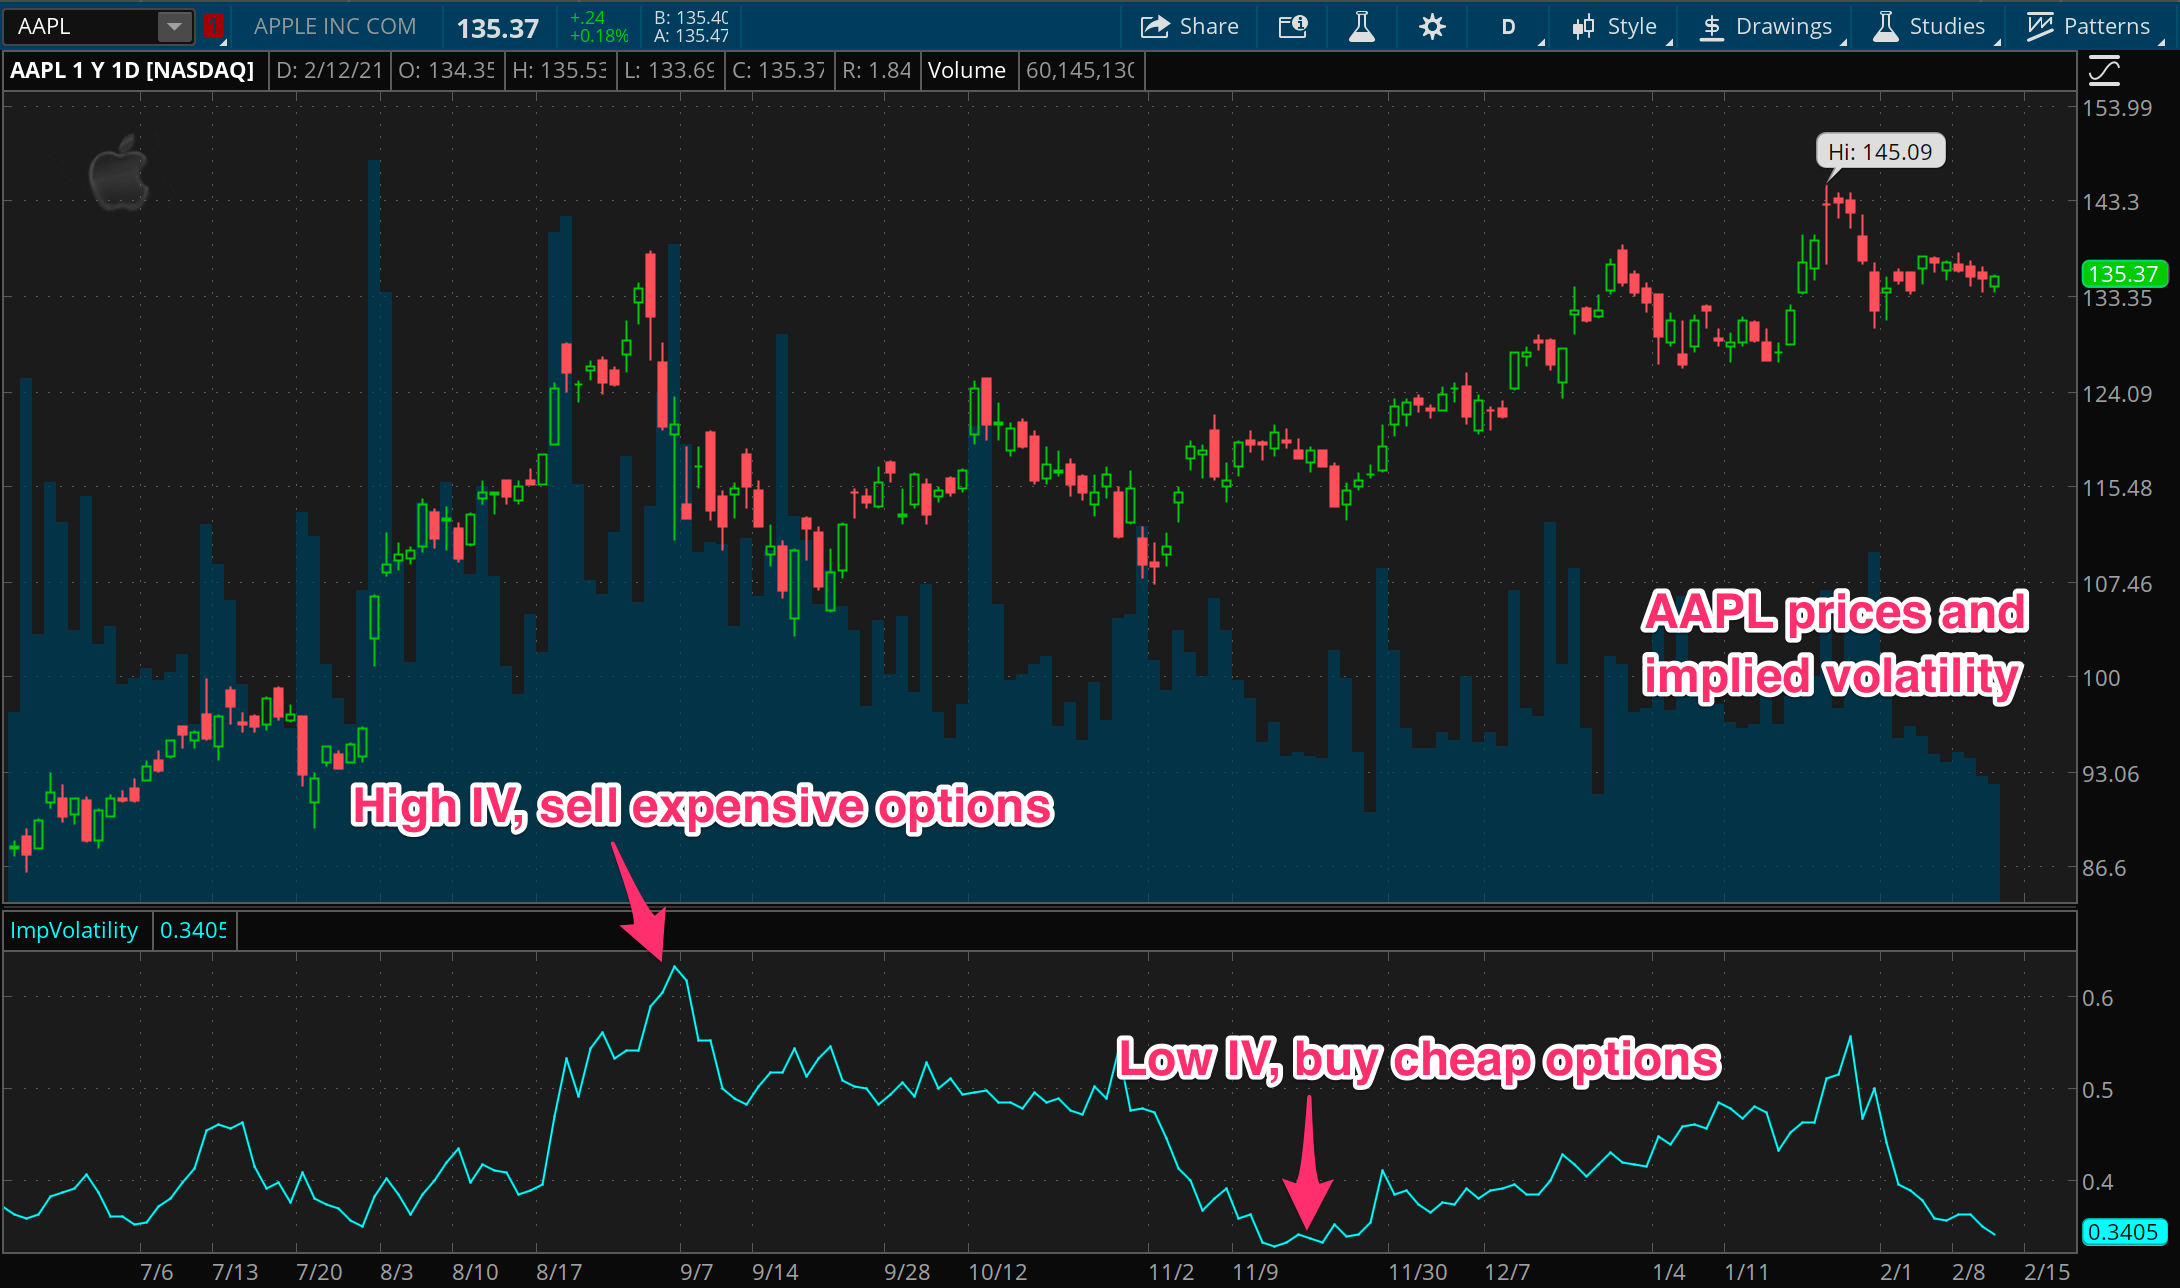
The last application of volatility we’ll cover here is related to buying and selling options. Recall from the first post in this series that there’s a key difference between realized volatility (like the trailing ATR) and implied volatility. While they are different, they are no doubt linked. Implied volatility, which is the forward expectation about volatility, is the primary indicator for how expensive or cheap the options on an instrument are trading.
The beauty with volatility, including implied volatility, is that it is mean reverting, unlike prices. While price might go in one direction and never return to a previous level, volatility will almost always cycle between periods of low and high volatility. The length of those cycles is hard to determine, but the process of unexpected changes followed by quiet periods seems to be a fact of financial markets.
Options can be used for all sorts of strategies that focus on price direction, changes in volatility, or simply the passage of time. But implied volatility, or IV, is important to all of them, and presents a viable ongoing edge for option sellers in particular. Simply stated, by selling options in periods of high IV, and neutralizing directional risk, it’s possible to bank on the cycle of volatility and buy back the options at a lower price, once IV has moved back down.
While this isn’t the place to go into depth about options, just remember that high IV means the options are relatively expensive (and are a better sale), while low IV means the options are relatively inexpensive (and are a better buy).
Reducing risk with a filtering strategy
That wraps up our dive into the different applications of the core volatility measures we started with in the series. There are many other ways volatility can be used for trading, but here we’ve covered some of the most popular ones you’ll see out there. In our next and final post in this series, we’ll go through building a very simple but effective volatility based strategy, step by step. You’ll see how it measures up well against buy-and-hold while cutting down on risk at the same time.