
In our last post in the series, we covered the fundamentals of volatility and the core methods for measuring it. In the next two posts, we’ll take those measures and put them in action by showcasing some applications. In particular, we’ll talk about using volatility to gauge the “normal range” for prices, as an input to calculate a stop exit or breakout entry, as a filter for taking trades, as a way to size positions, and for finding opportunities in trading options. You’ll see just how volatility really does show up everywhere.
Measuring Range and Extension
The last post in this series showed how volatility changes in response to price movement. But many traders work with volatility as a measure to help predict price movement.
They may not even call it prediction, but you’ll hear traders talk about “overbought” or “oversold”. What makes them “over” anything, anyway? What is it that makes a certain rise or fall in prices extreme?
Remember volatility is just a measure of expected range over some period of time. If prices move beyond that range, either volatility is moving up, or the price is “over extended” and will pause or return back into range.
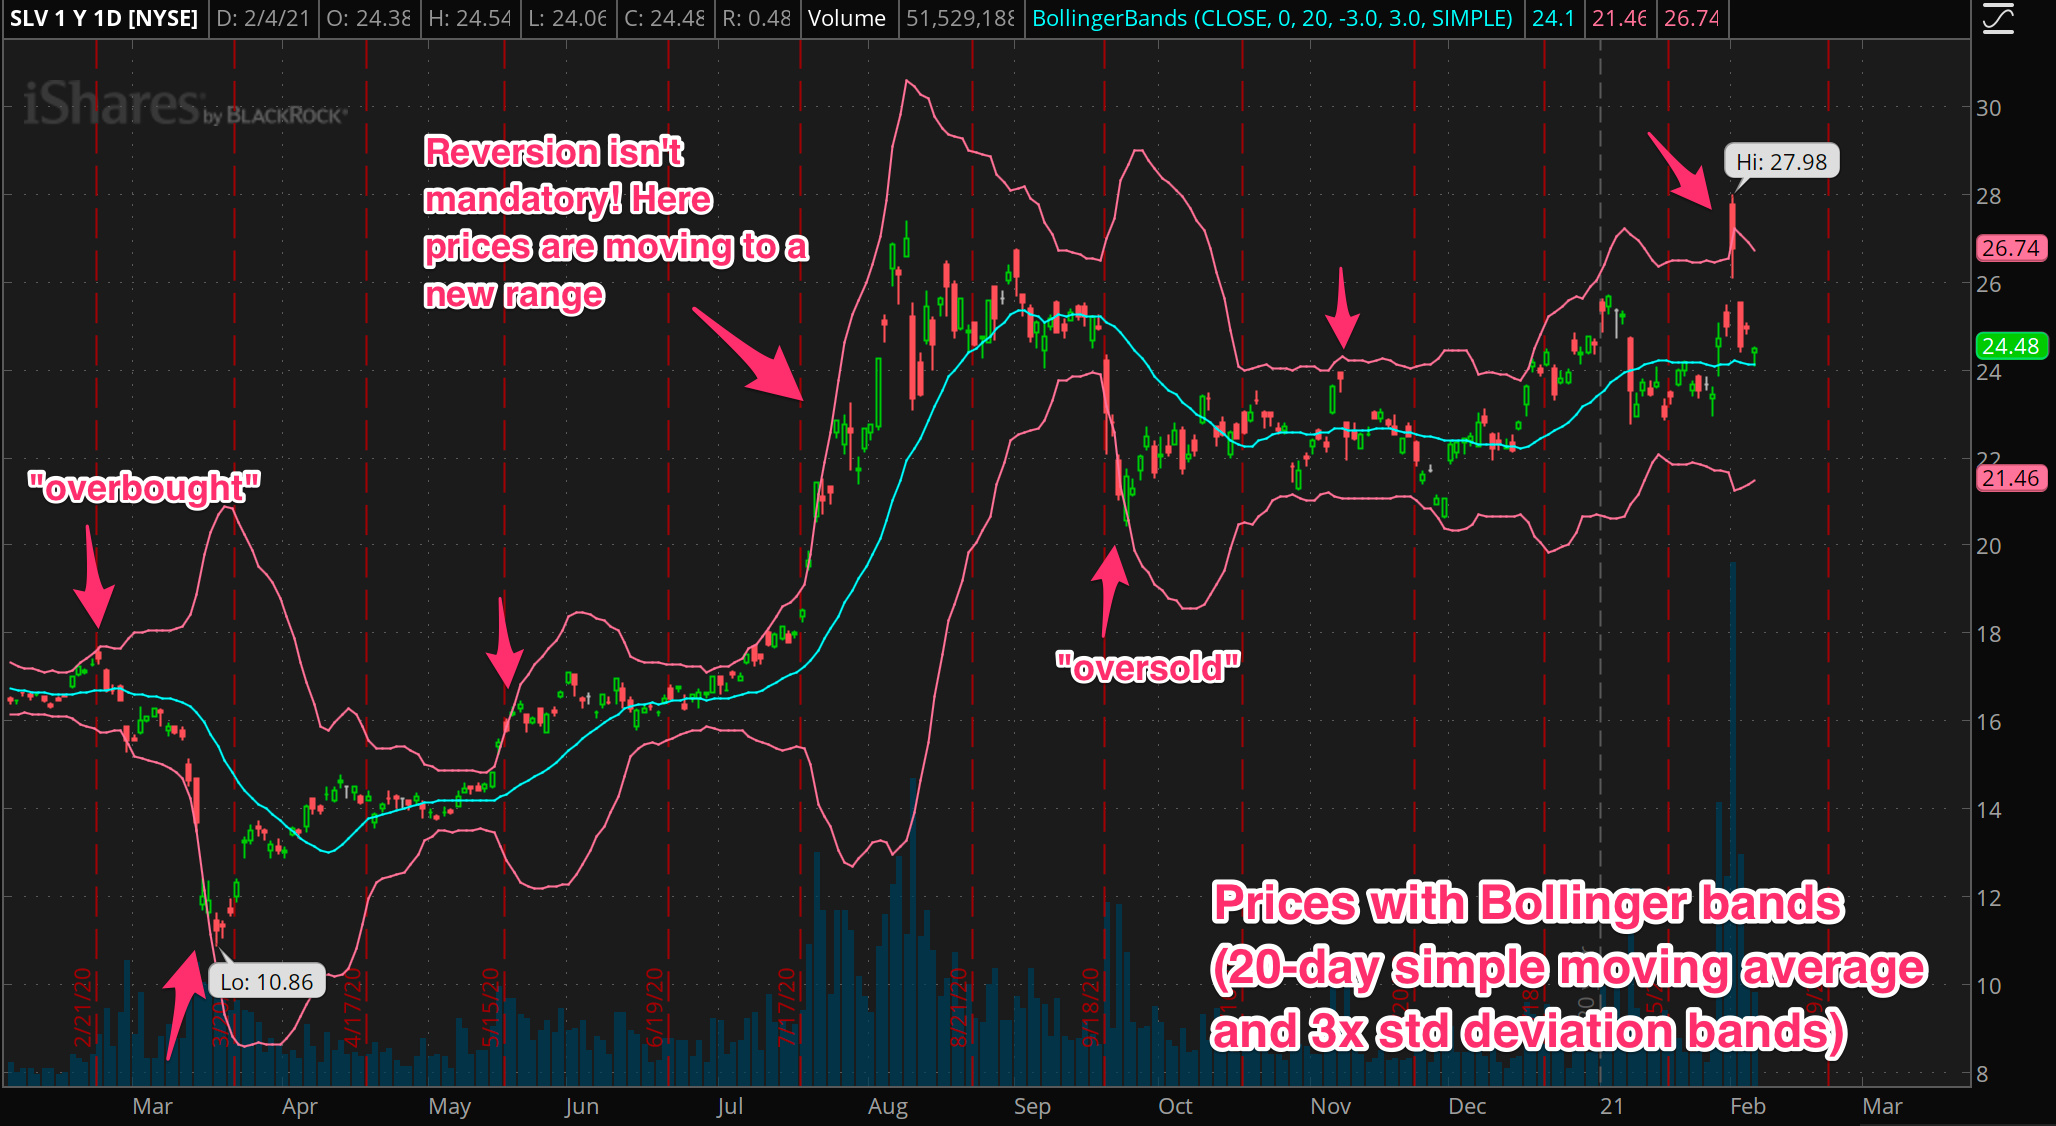
The above chart shows one of the most popular indicators of all time, Bollinger bands. Apparently ginned up by John Bollinger, this is just a basic but effective use of two key statistics of the price series, the average and the standard deviation.
Both of these are calculated on a moving basis, so they adapt as the price series goes on. So, in essence you have the moving average defining a center, and the bands are set 1, 2, or however many standard deviations away.
Remember from the last post that the standard deviation has this interesting property in statistics for ‘normally distributed’ variables (which price returns mostly are): the next value should fall within -1 to +1 standard deviations away from the mean about 67% of the time. And it should fall into the range of -2 to +2 standard deviations about 95% of the time.
So Bollinger bands, under the right circumstances, can suggest if an instrument has moved in a way that is “too much too fast” and may want to reverse course (or at least chill out and move sideways).
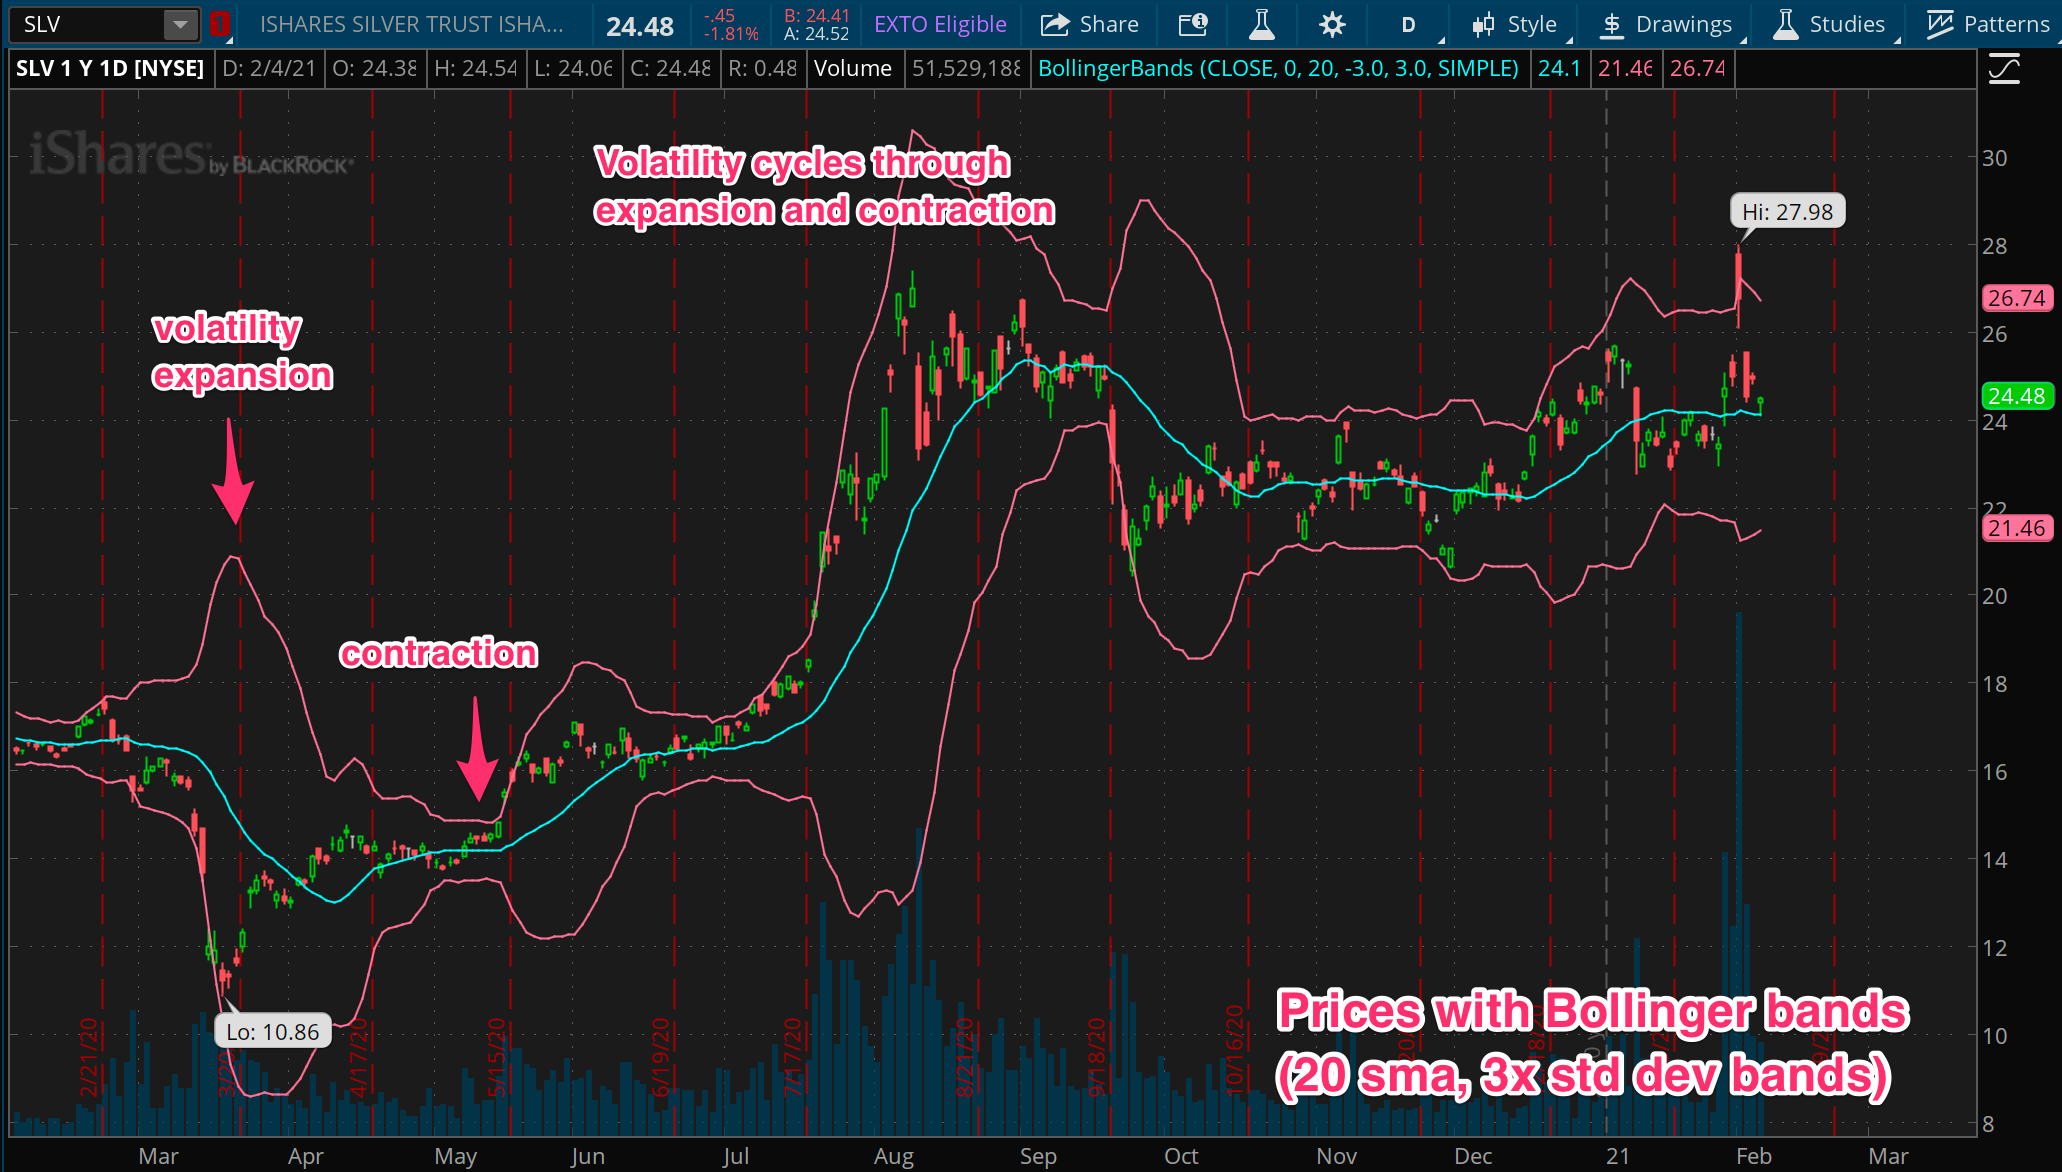
They also give us a view into how volatility is expanding and contracting, as the bands move apart and squeeze together. This is useful information, since volatility tends to cycle between low volatility to high volatility and back.
Side Alley: Keltner Channels
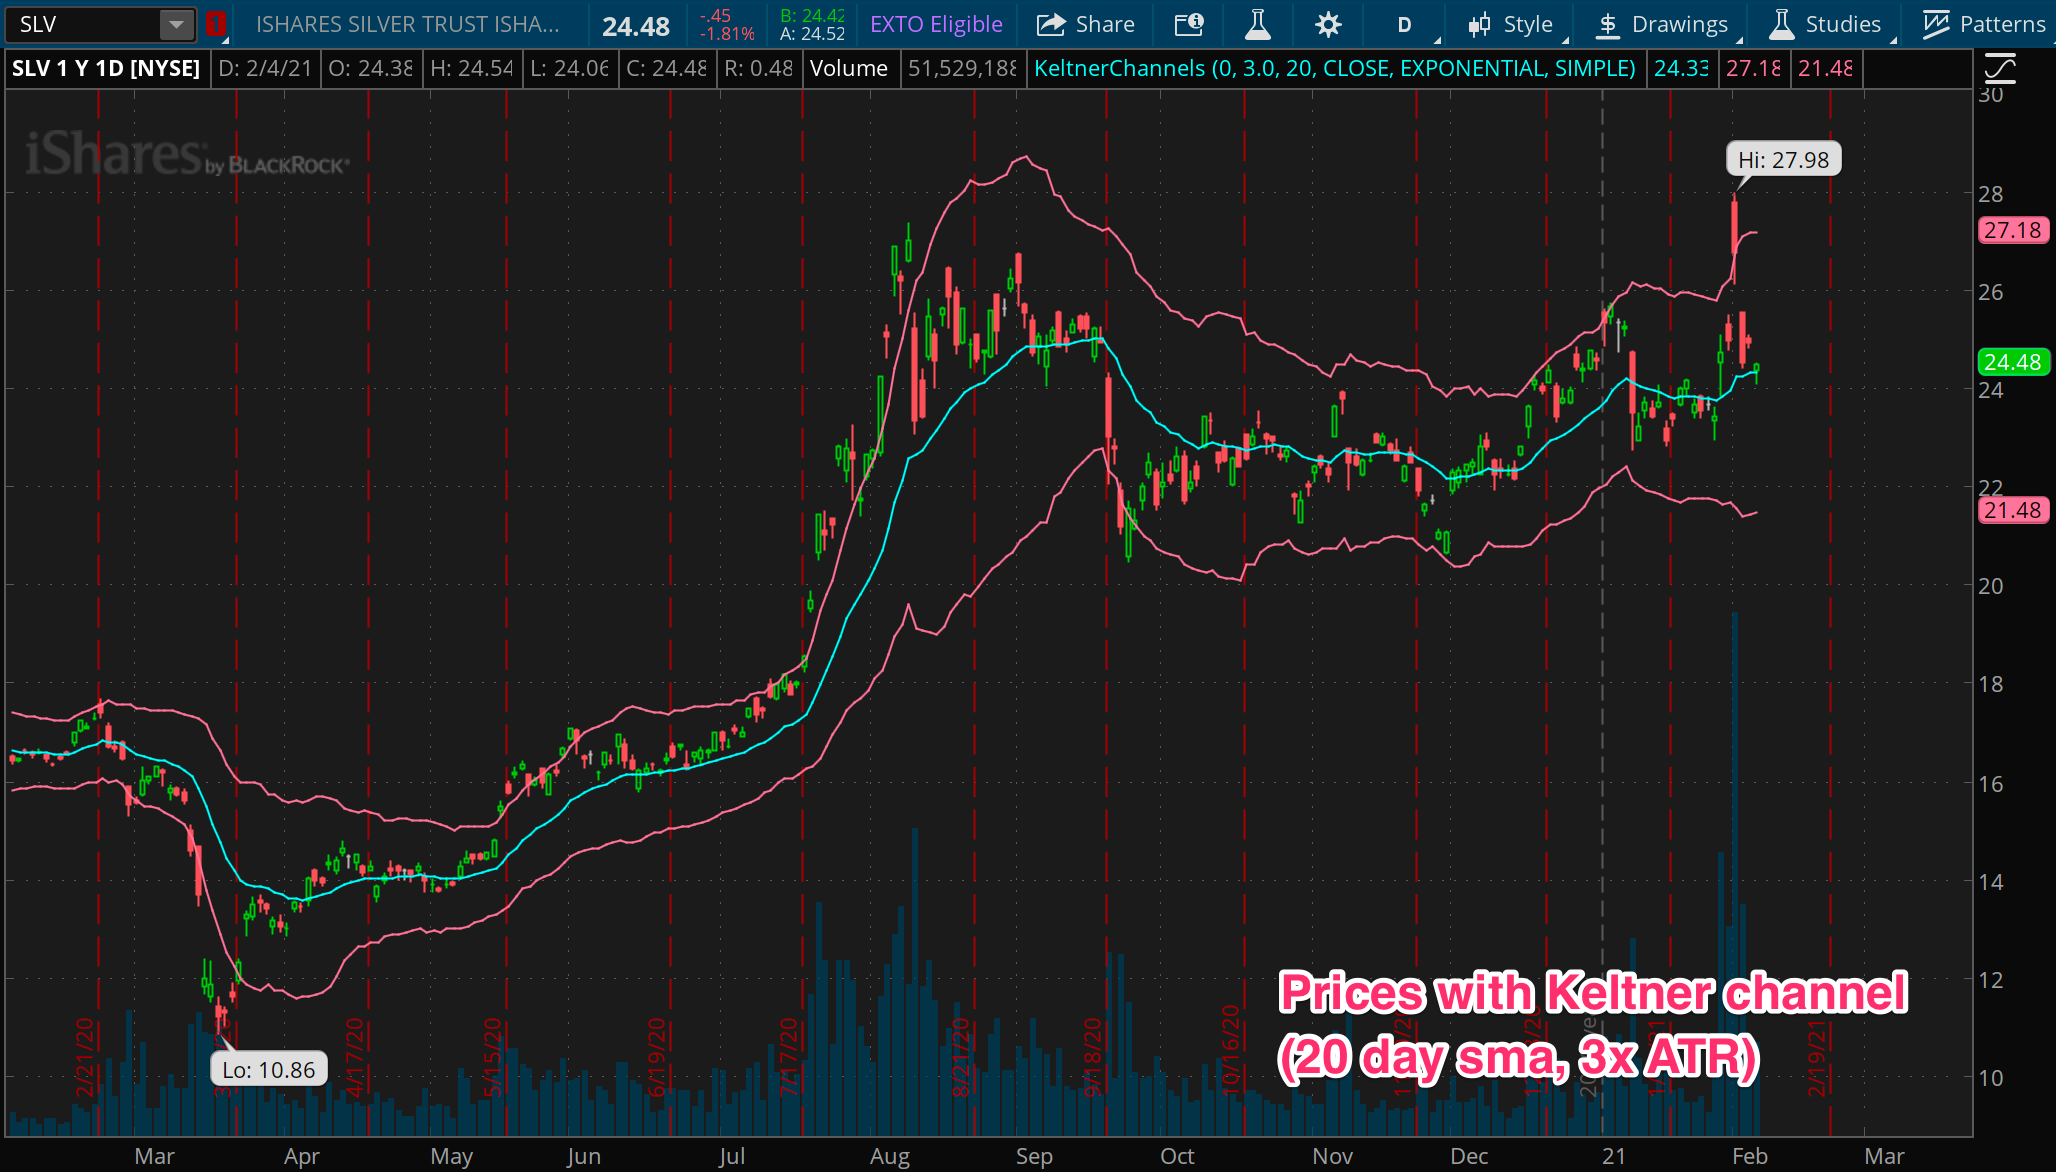
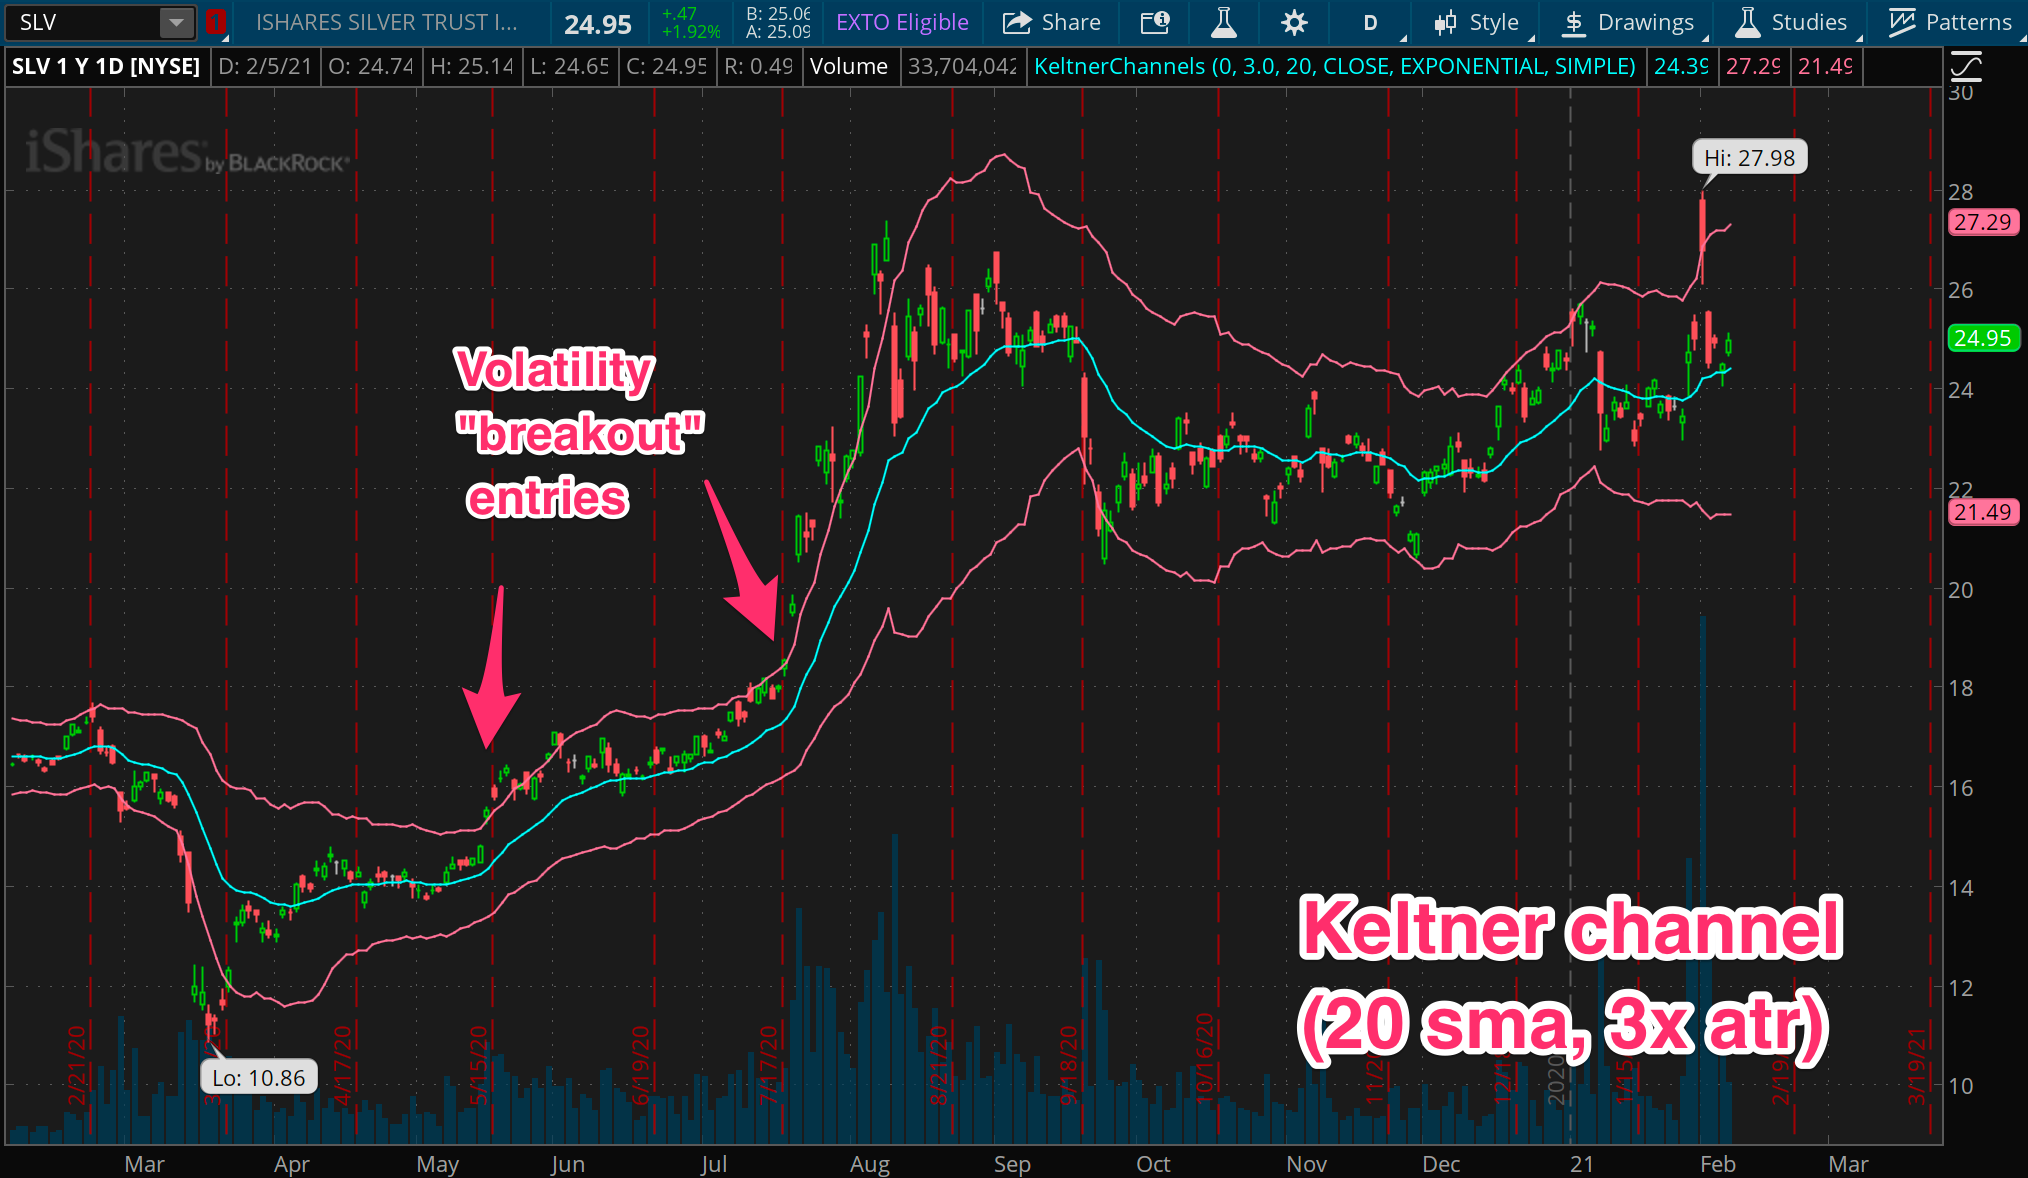
I would be remiss if I didn’t bring Keltner channels into this. Keltner channels and Bollinger bands are definitely cousins, if not brothers. Keltner channels are also made up of the same kind of two components: a moving average and a range defined by volatility. The twist is that instead of using the standard deviation, KC bands are based on the ATR, which we talked about in depth in the previous post in this series.
Some swear by Keltner channels, while others rely on Bollinger bands. Just like some swear by ATR, while others rely on standard deviation. Ultimately they are telling very similar things, and it’s up to the individual to decide which speaks clearer for their strategy. Because Keltner channels move slower, they are better suited to trend following, while Bollinger bands are more of a mean reversion tool.
Setting Stops and Finding Entries
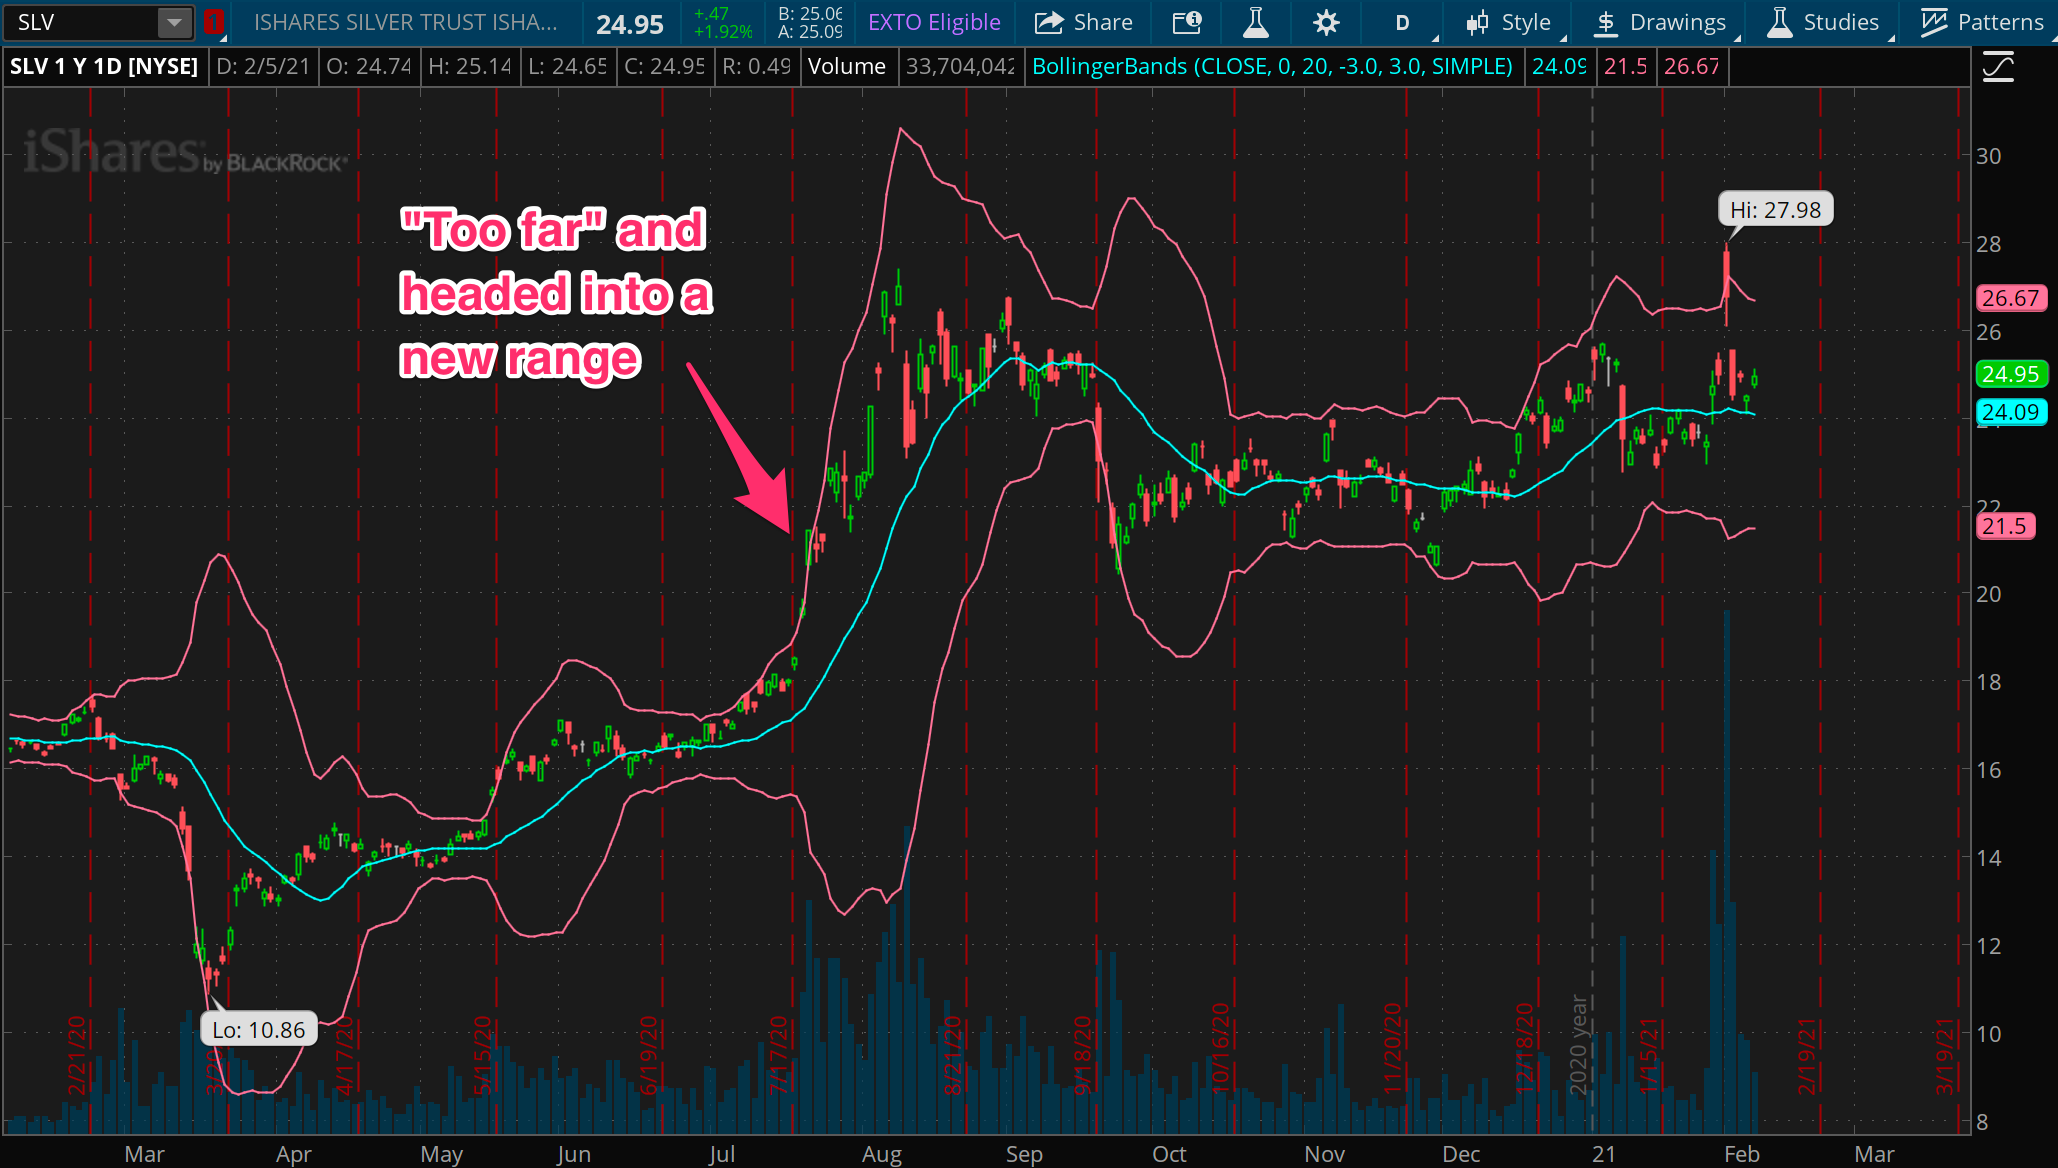
Now, the thing is, if an instrument has become over extended but doesn’t turn around, it wasn’t over extended after all! Instead, it is changing prices in a more fundamental way, or else volatility is expanding.
If you’re in a stock and it’s moving unexpectedly far, in the wrong direction, it doesn’t really matter if it’s a price shift or volatility shift, you probably want to get out and rethink it.
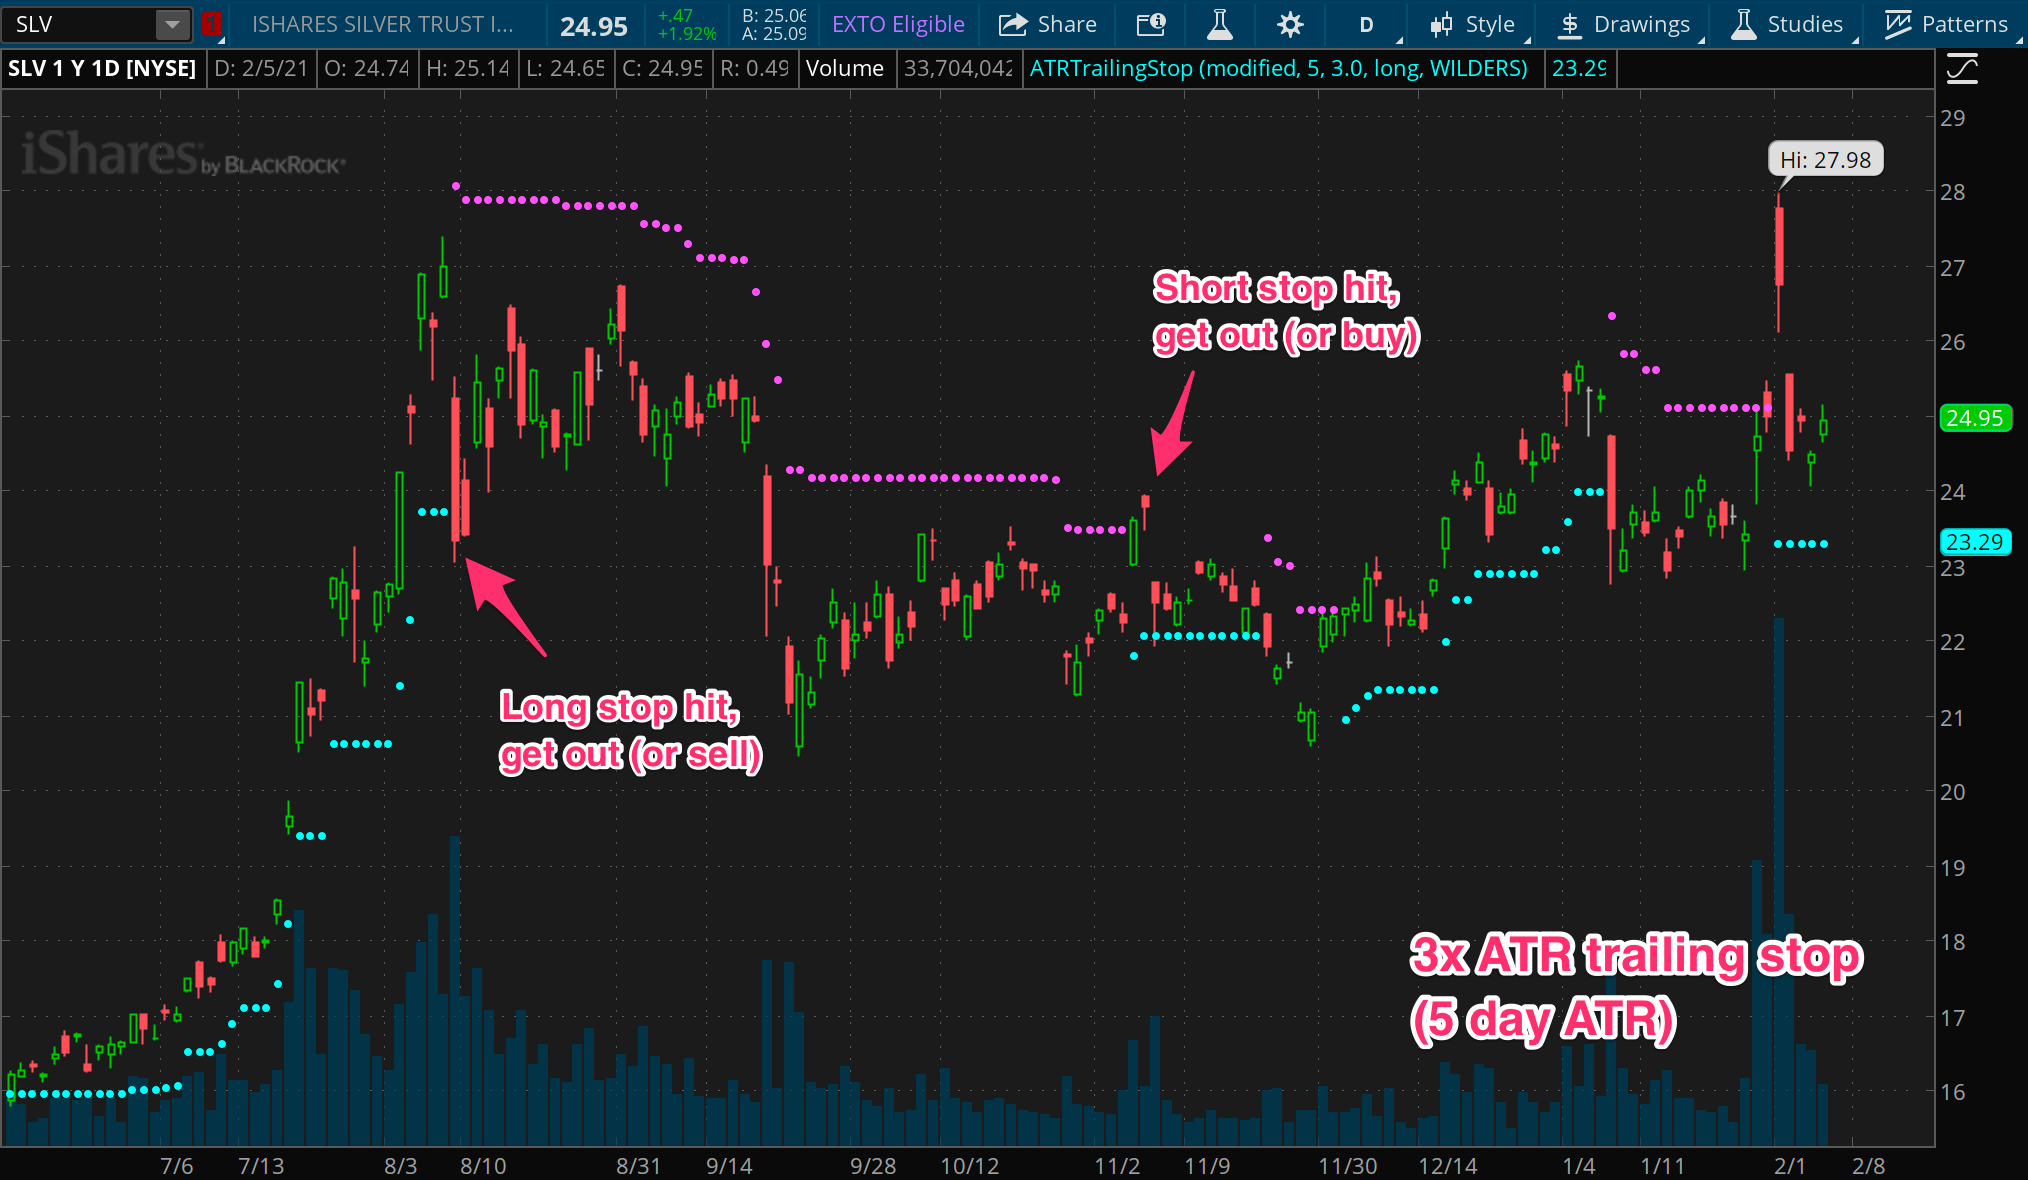
It’s for this reason that volatility can used to set a stop on a position, putting a line in the sand that says “if we move past here, something has changed, and it’s time to get out”.
In any momentum or trend following strategy, you need to give your positions some “room” to move around. How much room to give is informed by how much room it typically uses, or in other words, what the recent range has been, or in other words, the current volatility.
A classic volatility-based stop is the 3x ATR stop. Recall from the last post in this series that the ATR is an alternative to standard deviation for measuring volatility. The 3x ATR stop sets a rule that if an instrument moves more than 3 times the average true range against you, you cut the position.
Breakout entries
Now, an interesting bit that’s often looked over: If moving in one direction past the expected range signals a possible shift and reason to get out, why wouldn’t it also be a signal for getting in?
As it turns out, these sorts of moves can be excellent entry points. A strong and sudden movement outside the normal range can signal a rapid spread of interest or disinterest in a stock. Parabolic rises and big crashes are both characterized by expanding range in one direction, which is what a volatility based entry rule is built to find.
More Applications
In this post, we’ve looked at the two of the most popular applications of volatility measures, which should prove quite valuable tools for your trading. But we have plenty of ground left to cover. In the next post, we’ll look at some lesser known but still highly valuable applications such as using volatility as a trade filter, as a way to size positions in a portfolio, and for spotting opportunities in the world of options.