
In the last post in the series, we covered some basic groundwork and built up an intuition around the concept of momentum. In this post, we’ll roll up our sleeves and start getting more specific about measuring momentum, defining some quantitative measures that we can apply to our trading. In the final post of the series we’ll finish off by using these measures in a quantitative trading strategy.
Momentum measured
In some ways, momentum measures are much simpler than all the volatility measures we covered in the volatility series. In the simplest terms, momentum can be measured as just percent change over some period of time. It may sound too simple to be true, but some very successful momentum strategies rest on buying instruments that have had the most positive price change over one year, for example, and selling those with the most negative price change.
Remember from the discussion in the last post in this series that momentum is often a function of information disseminating into the market, and the feedback loop of reactions that start from it.
One way to get a basic read on momentum is to just track a moving percent change. This can help quantify the price action you’re looking at on the chart. Here’s an example, which uses a Thinkorswim script to track total percent change over a configurable amount of time, in this case 1 month.
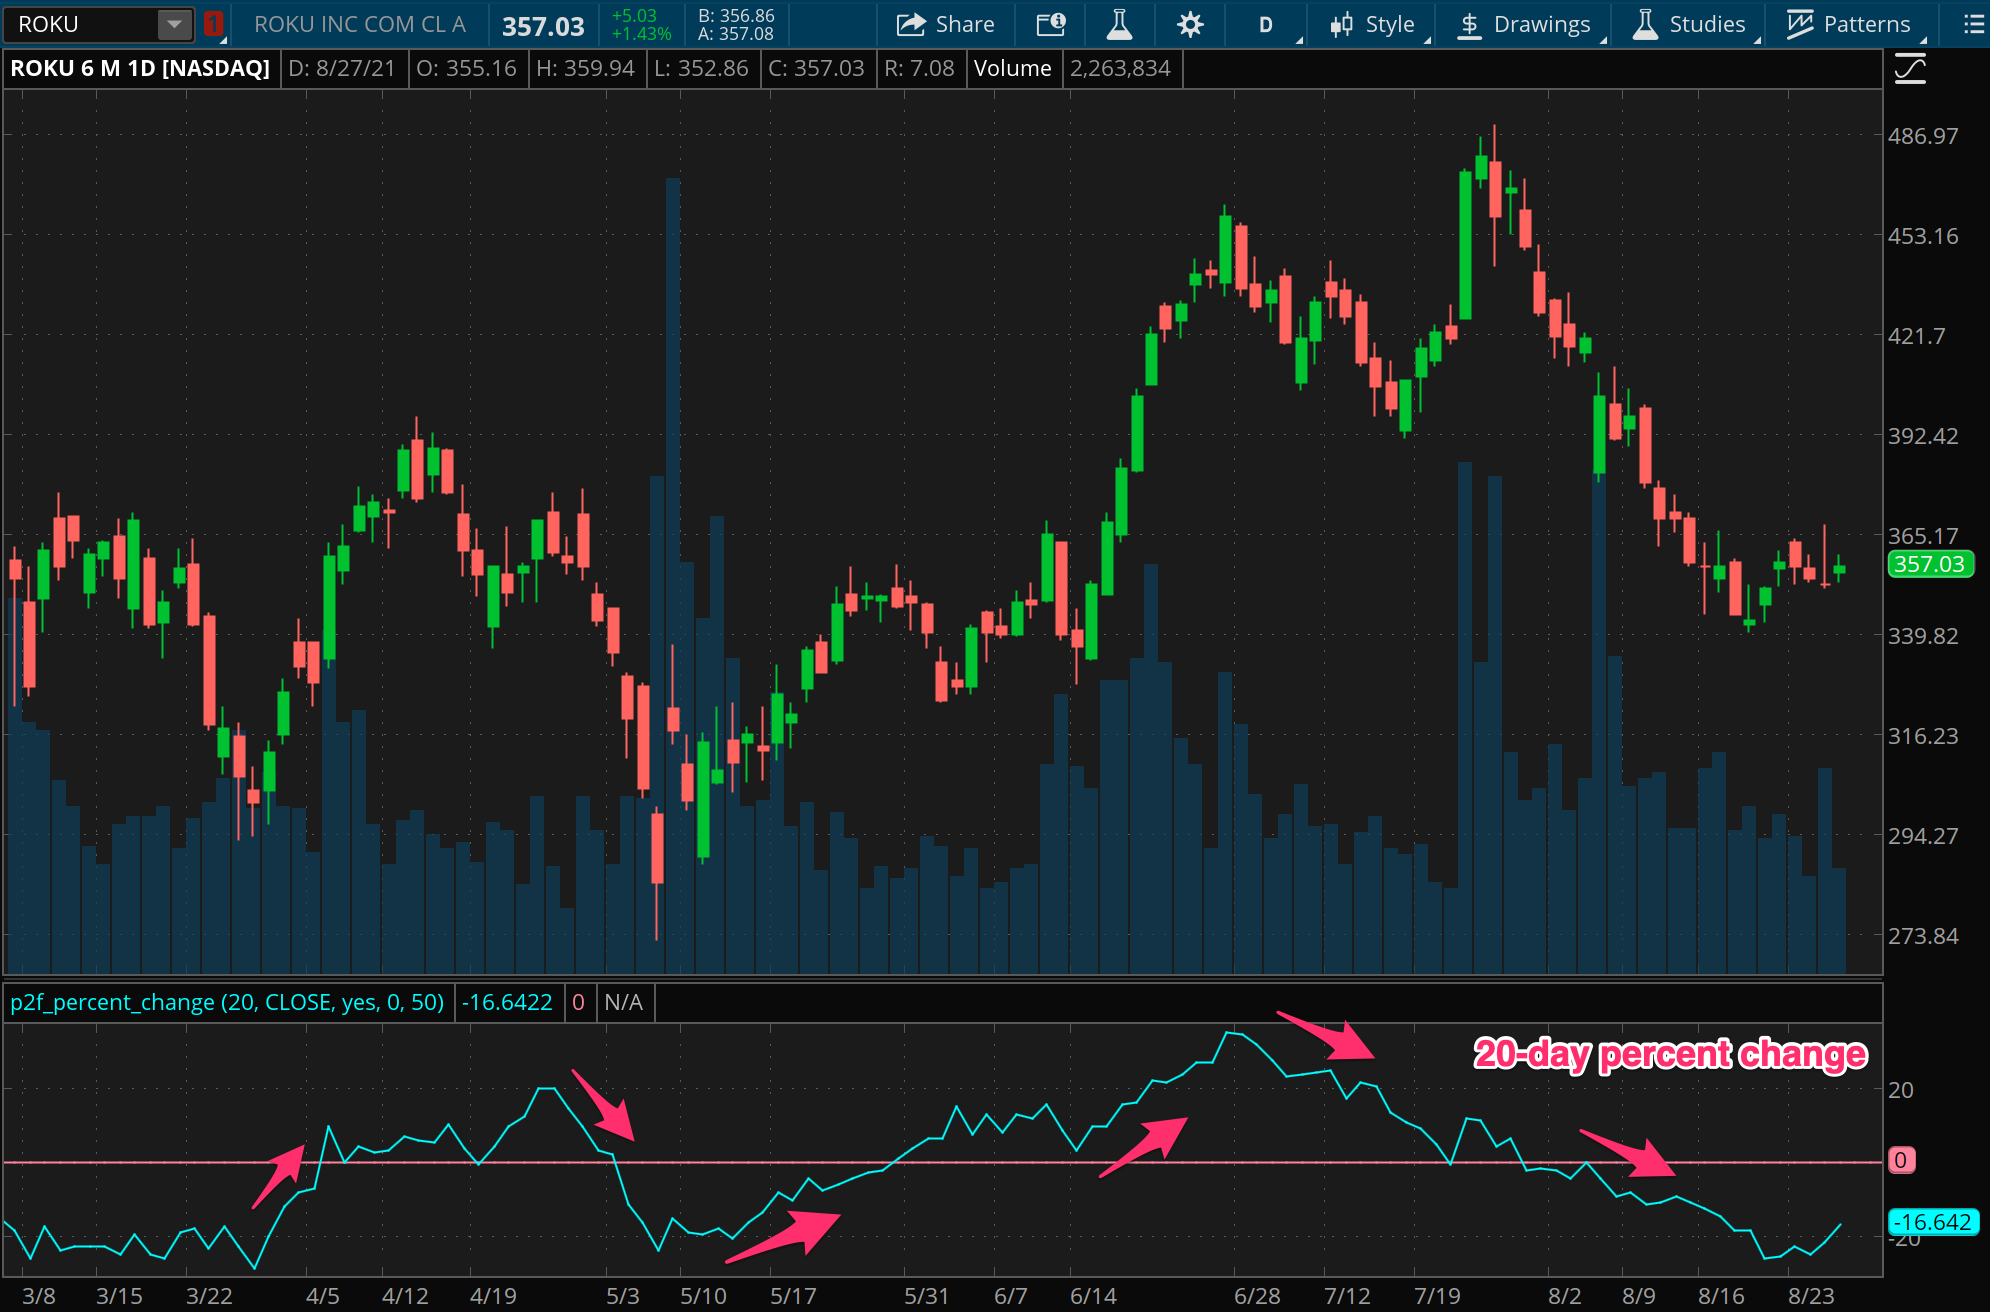
How should we interpret this information? How do we make any use of the measure? Looking at the chart above, we can see that the direction of percent change is at least as important as the current value. In fact, this is really what momentum is, the continuation of gains or losses for the participants involved. We see from the chart that there can be opportunities when price and momentum diverge (in the example, this happens around the beginning of May, the end of May, and the end of July).
Quantitatively, we can look for any regular predictive power by plotting this alongside the actual returns of the next period, for some future period. If we can find alignment between the percent changes that just occurred and those about to occur, we may be on to something.
Here, we’ll use another instance of the same indicator, with a shift to show us what happened along with what is about to happen.
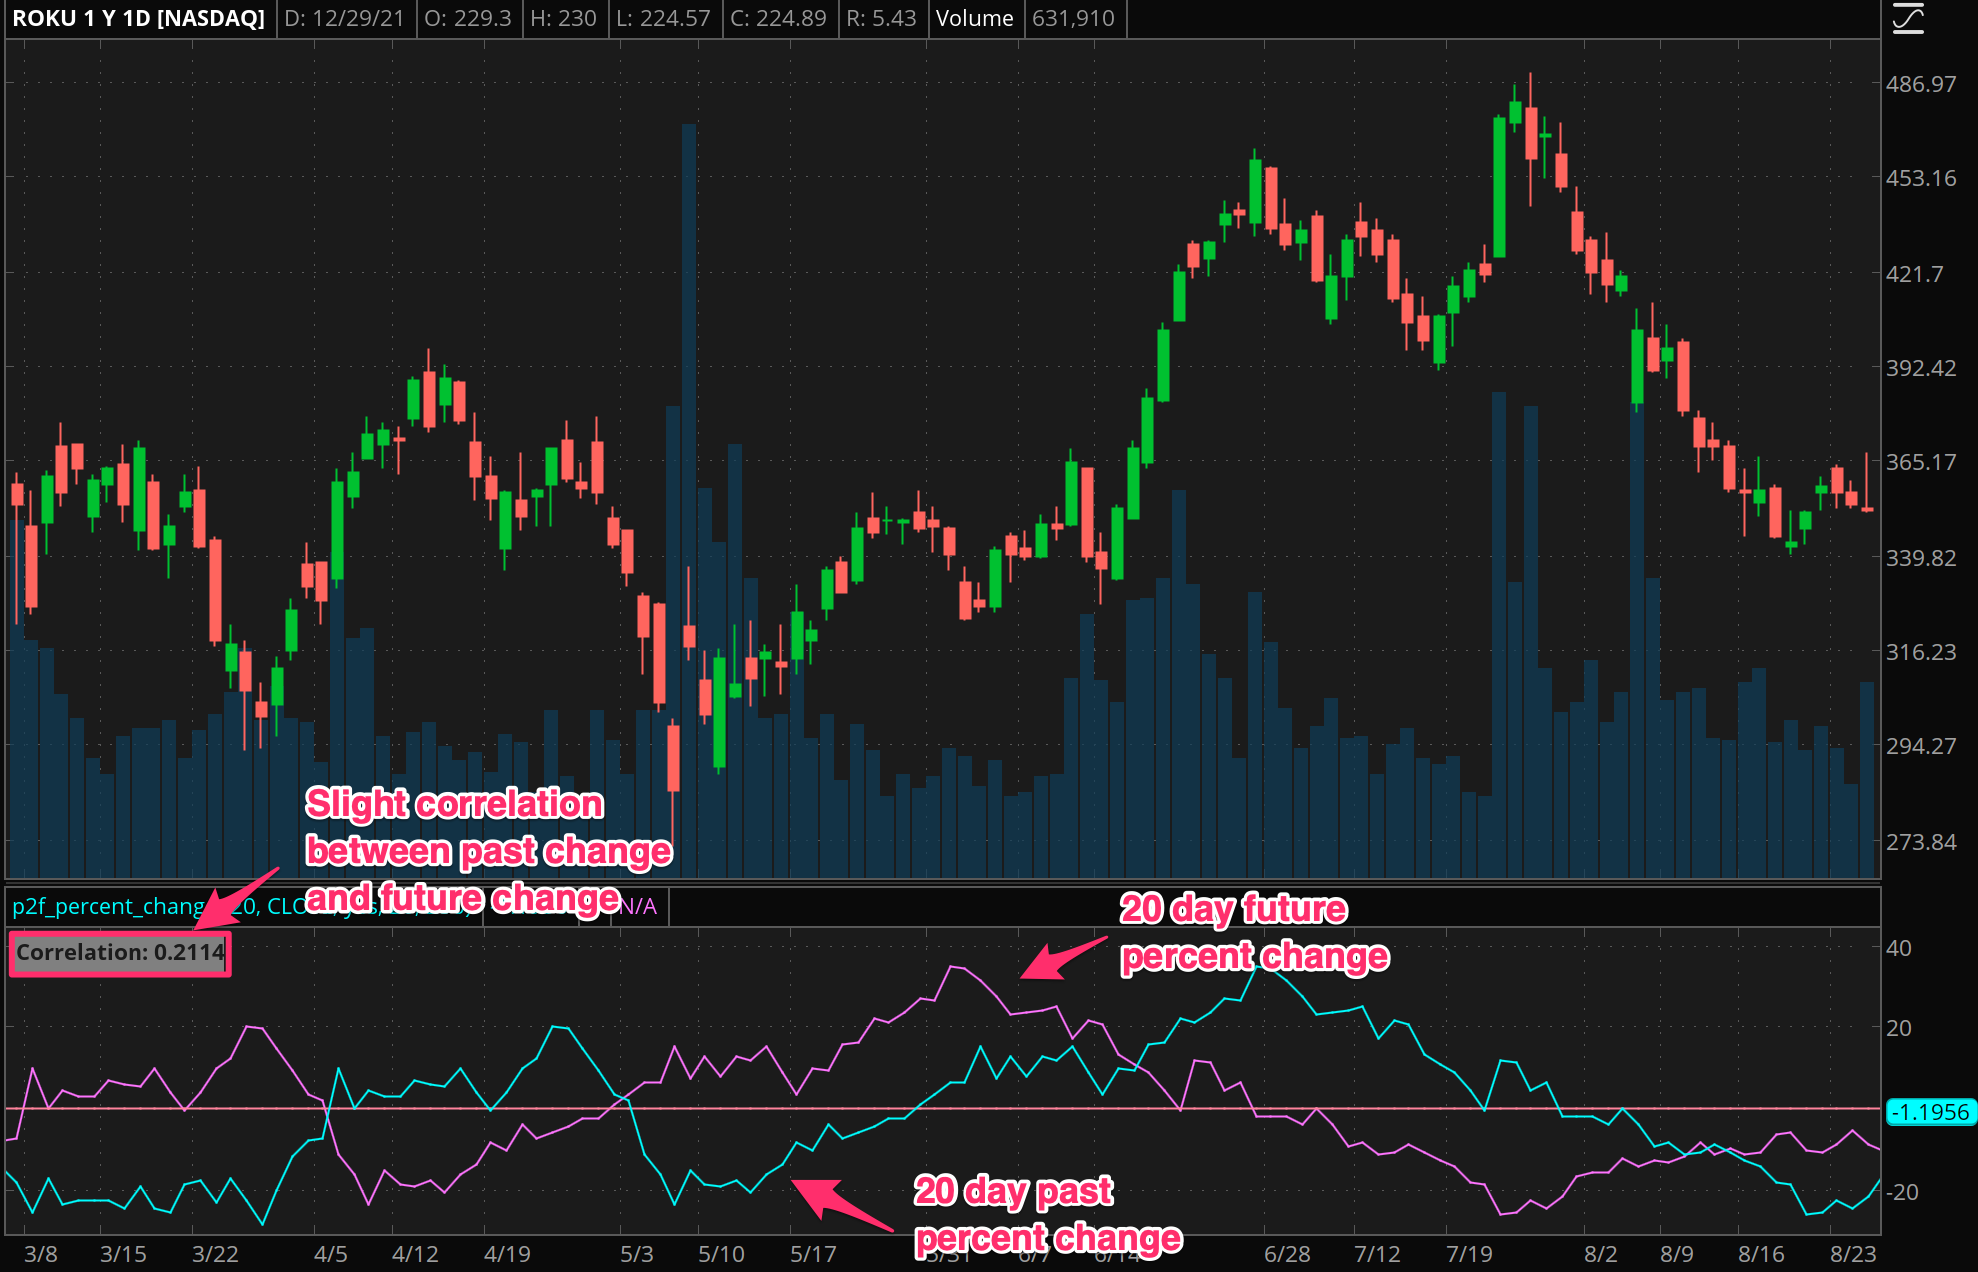
This search for correlation between an N period change and future M period change should be conducted with data mining techniques, but these visual tools can also be helpful. By testing different values, you might find an approximate relationship that represents an average “time to settle” for momentum in that particular instrument.
More often than not however, momentum is driven by news and events that have bigger or smaller impacts, which move through price quicker or slower. This makes it difficult to consistently use a simple measure like this for automated strategies. For a discretionary strategy however, this can serve as another data point for overall context, to use for scans in order to find momentum driven setups, or potentially even to anticipate price exhaustion.
Refining momentum
There are a couple of ways we can refine our measurement of momentum to get a better signal, including volume, speed, and consistency.
Volume
The simplest of these is considering volume in the movement of price. Generally, large moves on higher than normal volume are more likely to represent fundamental shifts in the market. This is true whether that shift is about important new information, or widespread behavioral phenomena (e.g. a “meme stock” effect from a retail driven feedback loop). It’s not a prerequisite, but is a great confirmation.
Quantitatively, we can look at a Z-score of the volume (indicator here), looking out for values above 1 (which correspond to volume that is more than one standard deviation above the typical range of volume).
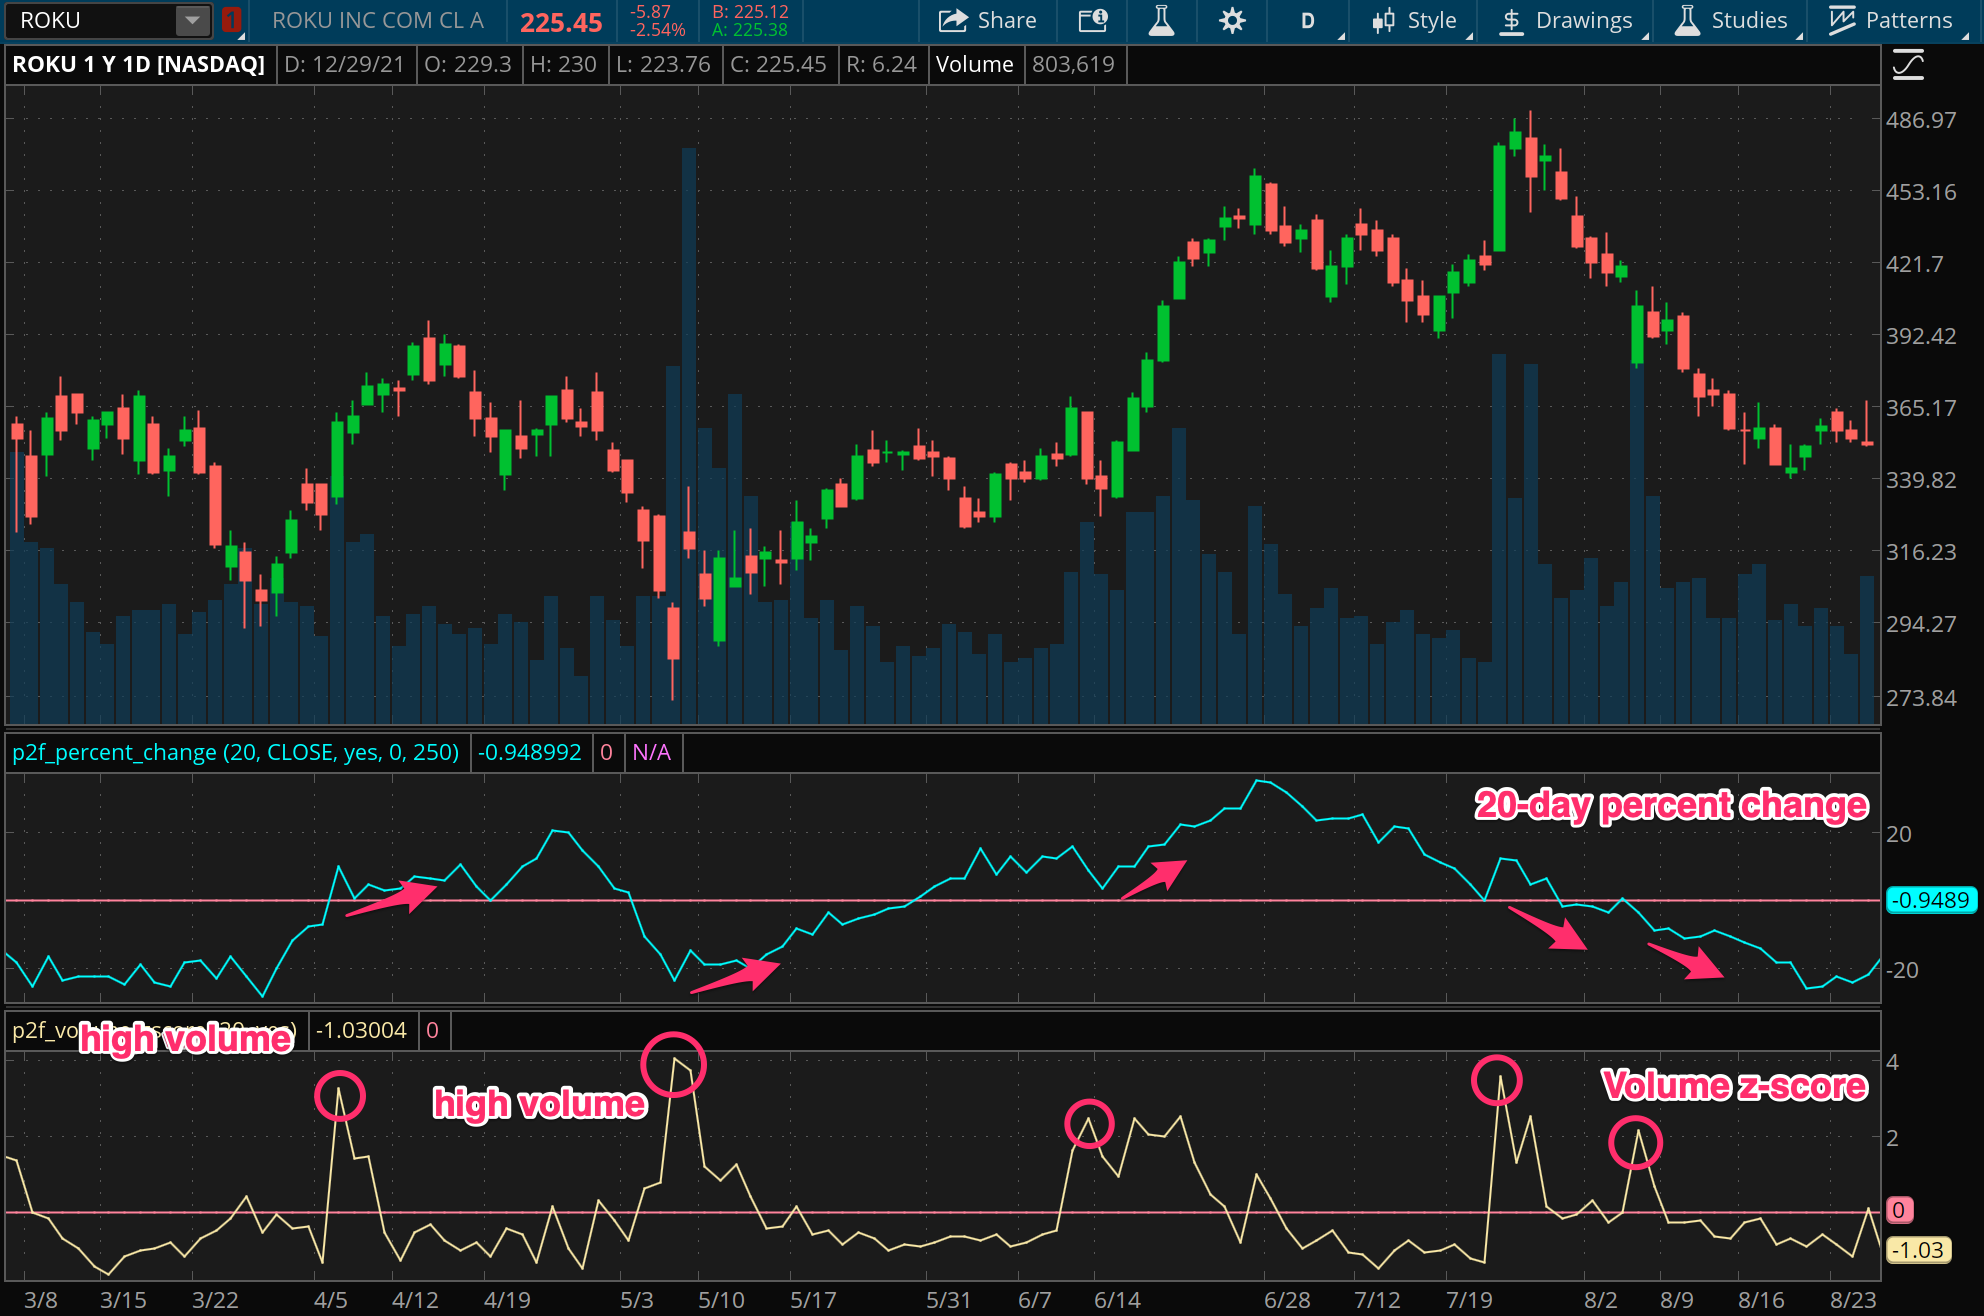
Note in the chart above how the direction of momentum after high volume days appears to predict continuation of price in that direction for some time.
Speed
Next let’s consider speed as an element of momentum. In some ways, this idea is redundant with our core measure. Our basic percent change measure is based on a trailing time period, and so it measures not just distance (total price change) but also velocity (distance divided by time). Yet it misses information about whether this price change is unusually “far” or “fast”.
For that, we can turn to volatility as a complimentary measure to price change. By looking for instances of strong directional price movement that is paired with range extension, we can be more confident that the momentum we are seeing is more than what should be possible under “normal” circumstances.
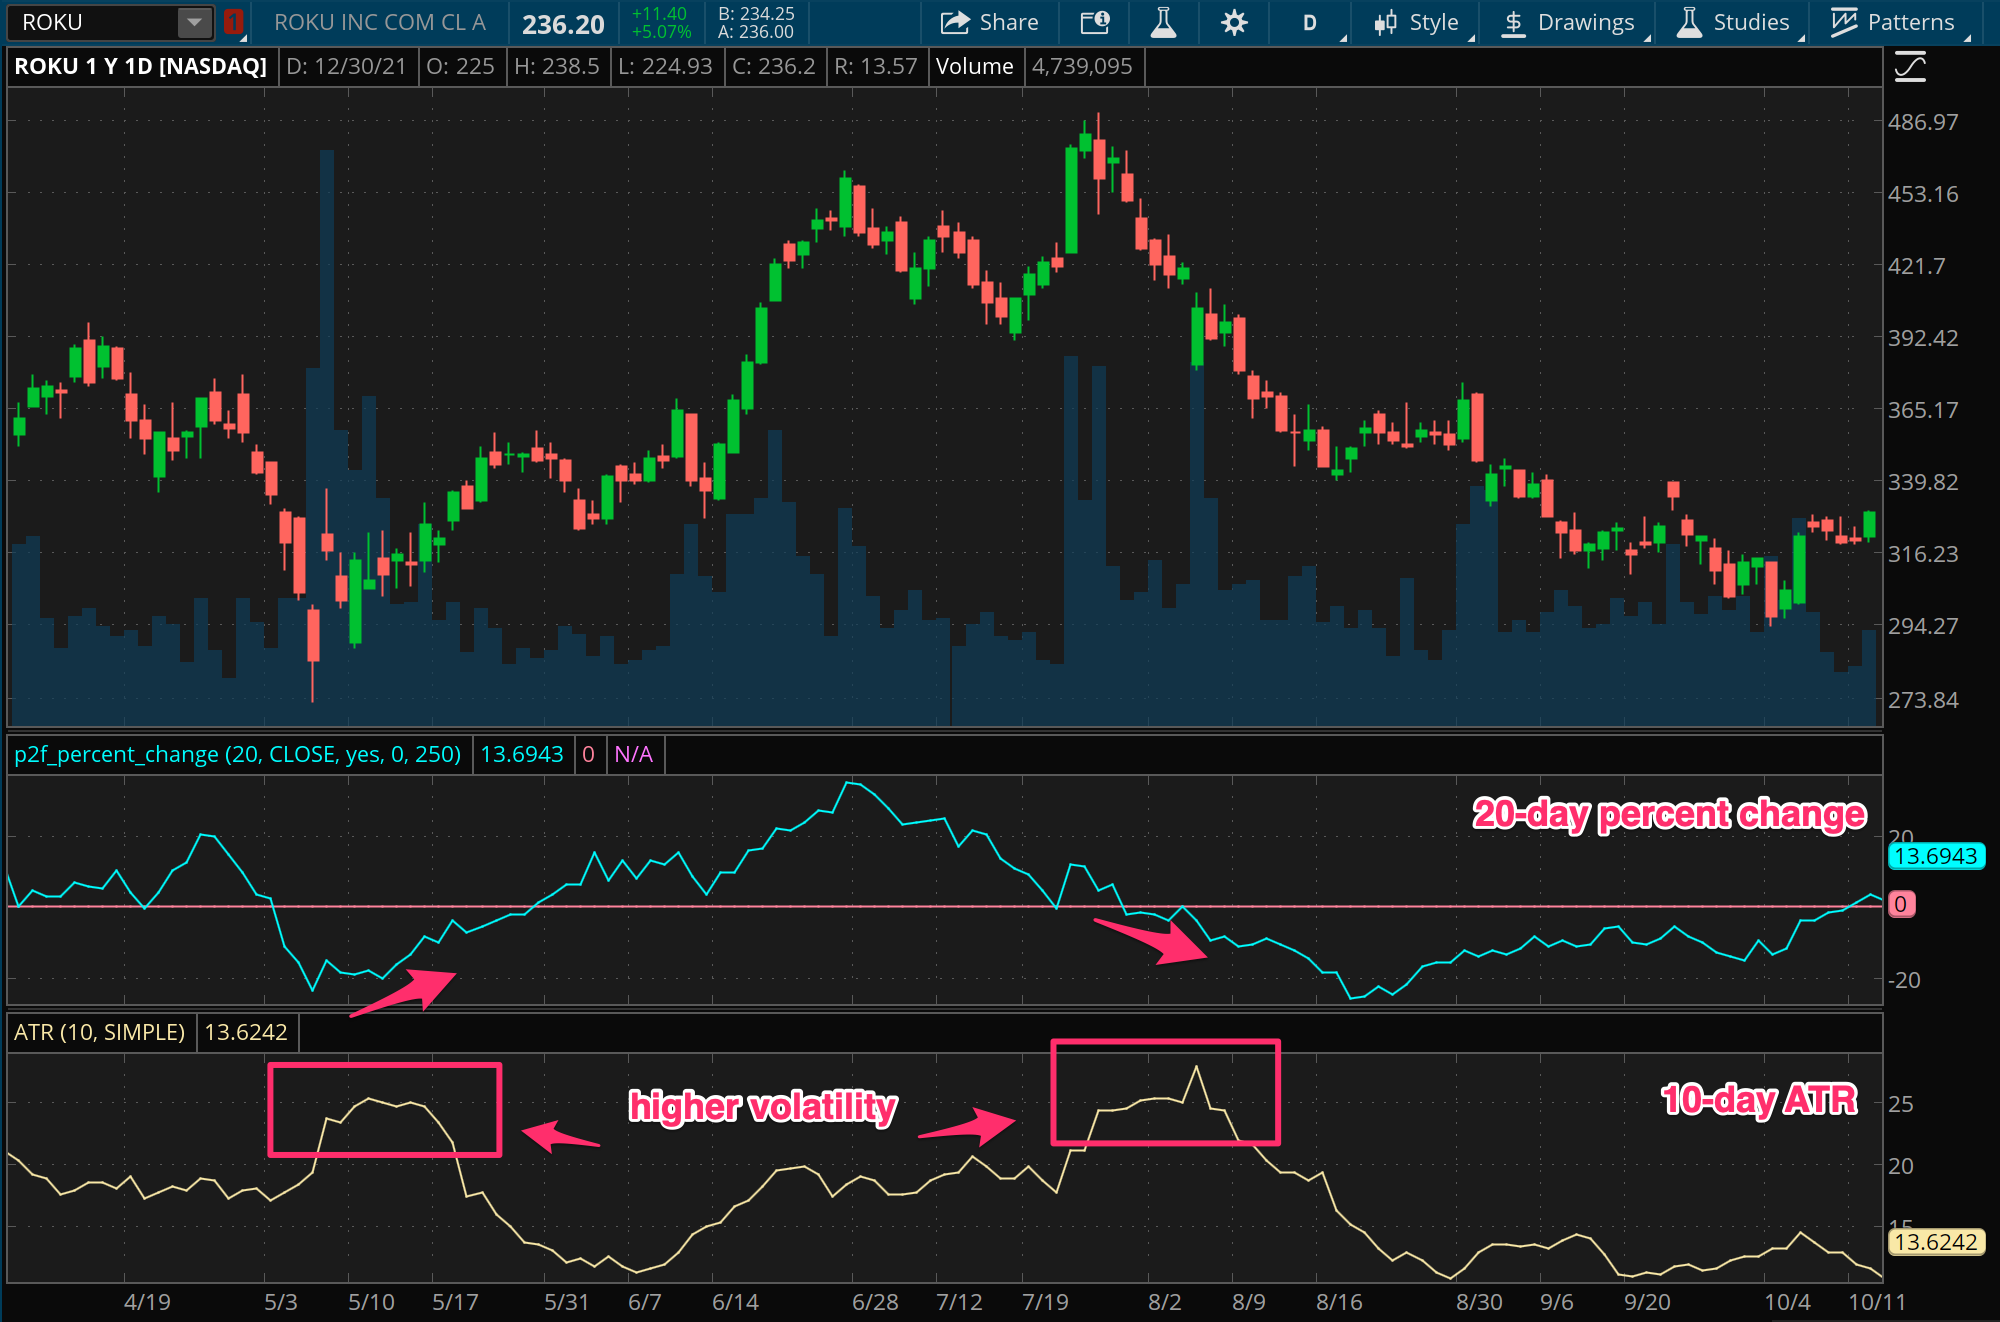
This pairing is the basis of volatility breakout strategies, which we’ll look at more closely in a future post. The main idea though is that a force big enough to move the price so suddenly is not easily reversed, and we should look at an opportunity for continuation of price in the direction that follows that higher volatility.
Consistency
Finally, let’s look briefly at consistency as a dimension of momentum. Here consistency means how steadily price is moving in one direction. A simple and effective measure for this is just a moving count of the number of bars that go in the direction we’re observing. This added dimension can filter out price changes that just happen from one time events like mergers.
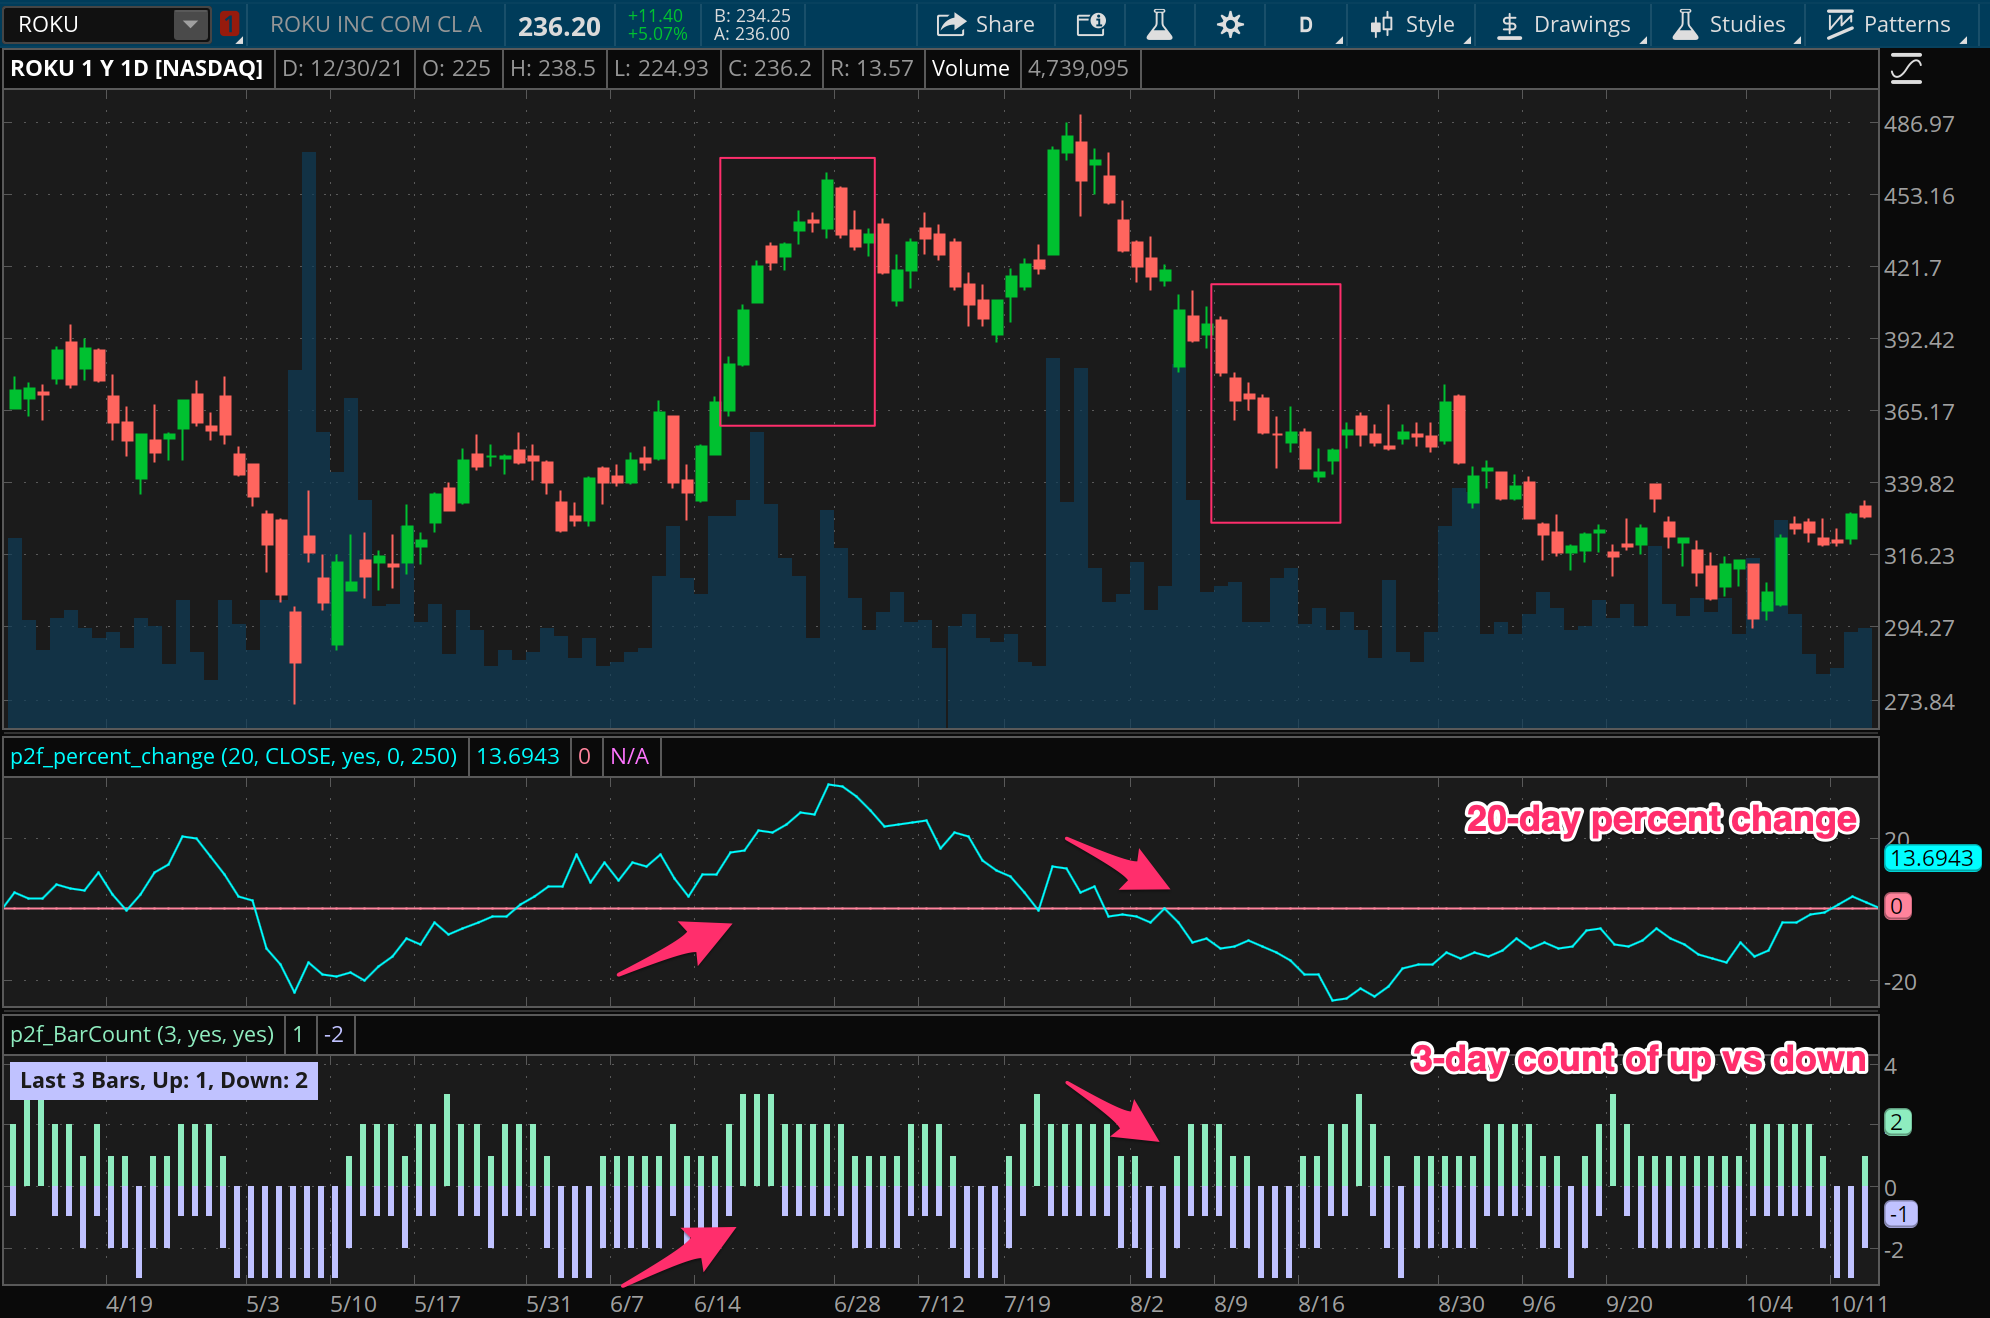
Consistency can emphasize a different sort of momentum than the volatility based measure above, and can indicate, for instance, a slow and methodical accumulation by large buyers, rather than some sudden shift in tone from news or events.
Relative strength index
A discussion on measuring momentum would be incomplete without mentioning the Relative Strength Index, or RSI. This is an extremely popular indicator used by thousands of traders every day. For better or worse, this indicator is often used to generate “overbought” and “oversold” signals that are supposed to help identify turning points in price due to price exhaustion. Experienced traders know that price can stay in “overbought” or “oversold” territory for a long time though.
Actually, there’s often an opportunity in buying into the overbought state, or selling into the oversold state. Why? Because the RSI is in fact just a measure of momentum, and these “extreme” states are signaling strong momentum in one direction. In fact, the RSI is not all that different from our simple percent change measure.
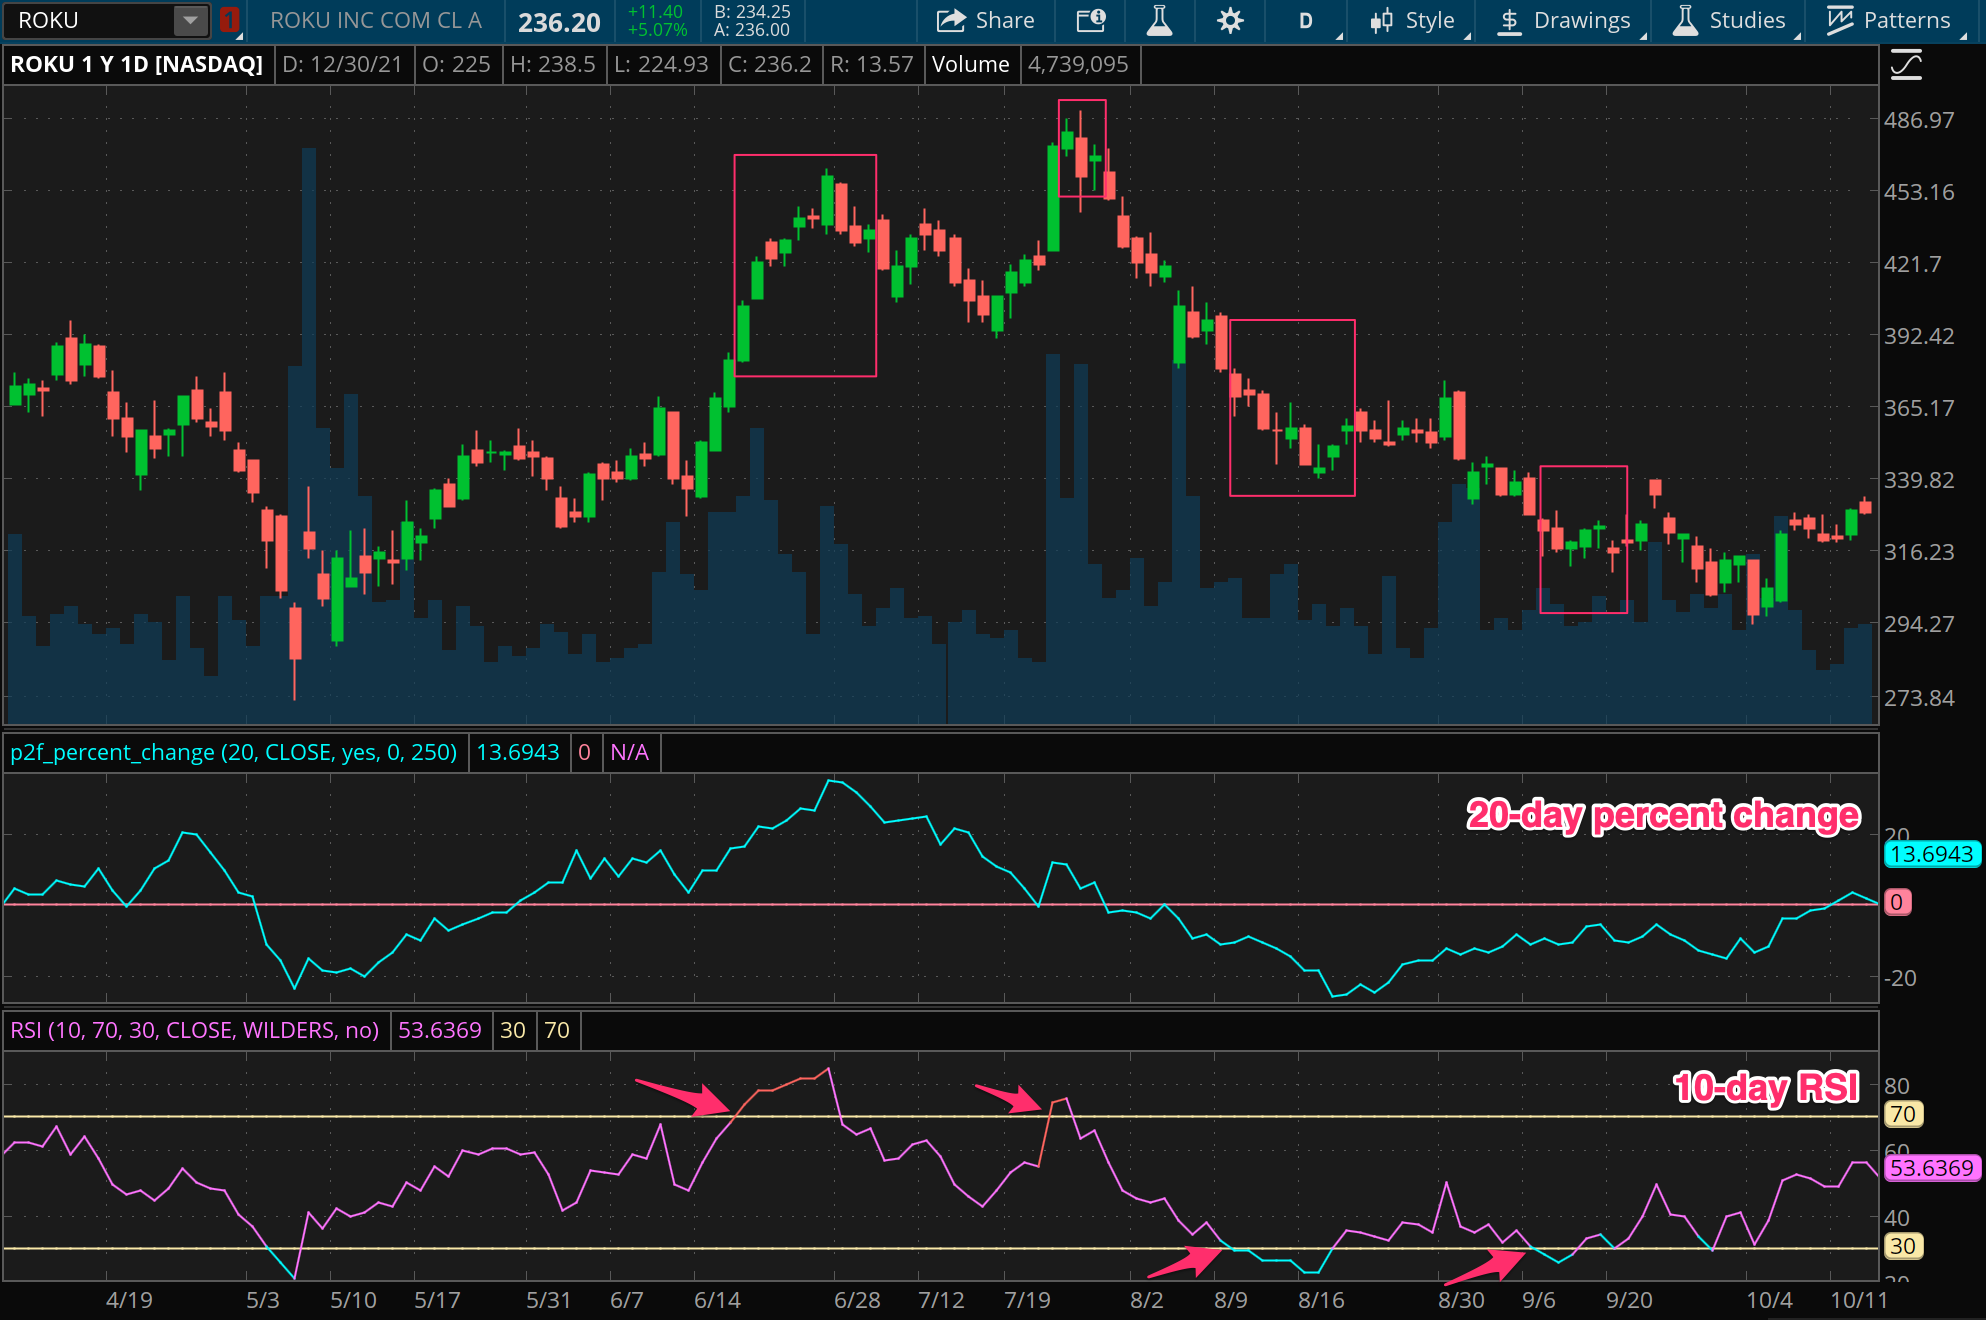
We won’t do a deep dive into how the RSI is calculated here (though we will cover this in a future post), but the essence of this indicator is that it incorporates the consistency dimension into a percent change measure, and then normalizes that measure onto a 0 to 100 scale using the range of moves recorded in both directions (in other words, using volatility to normalize the measure).
Putting momentum into action
In this post, we’ve covered the core measures of momentum and provided a few tools that you can use for both discretionary and quantitative strategies. In the final post in the series, we’ll put together a simple quantitative strategy using momentum and explore some different aspects of its performance. As is so often the case, we’ll see that simple strategies can be the most effective.