The Relentless Rise Continues…
SPY
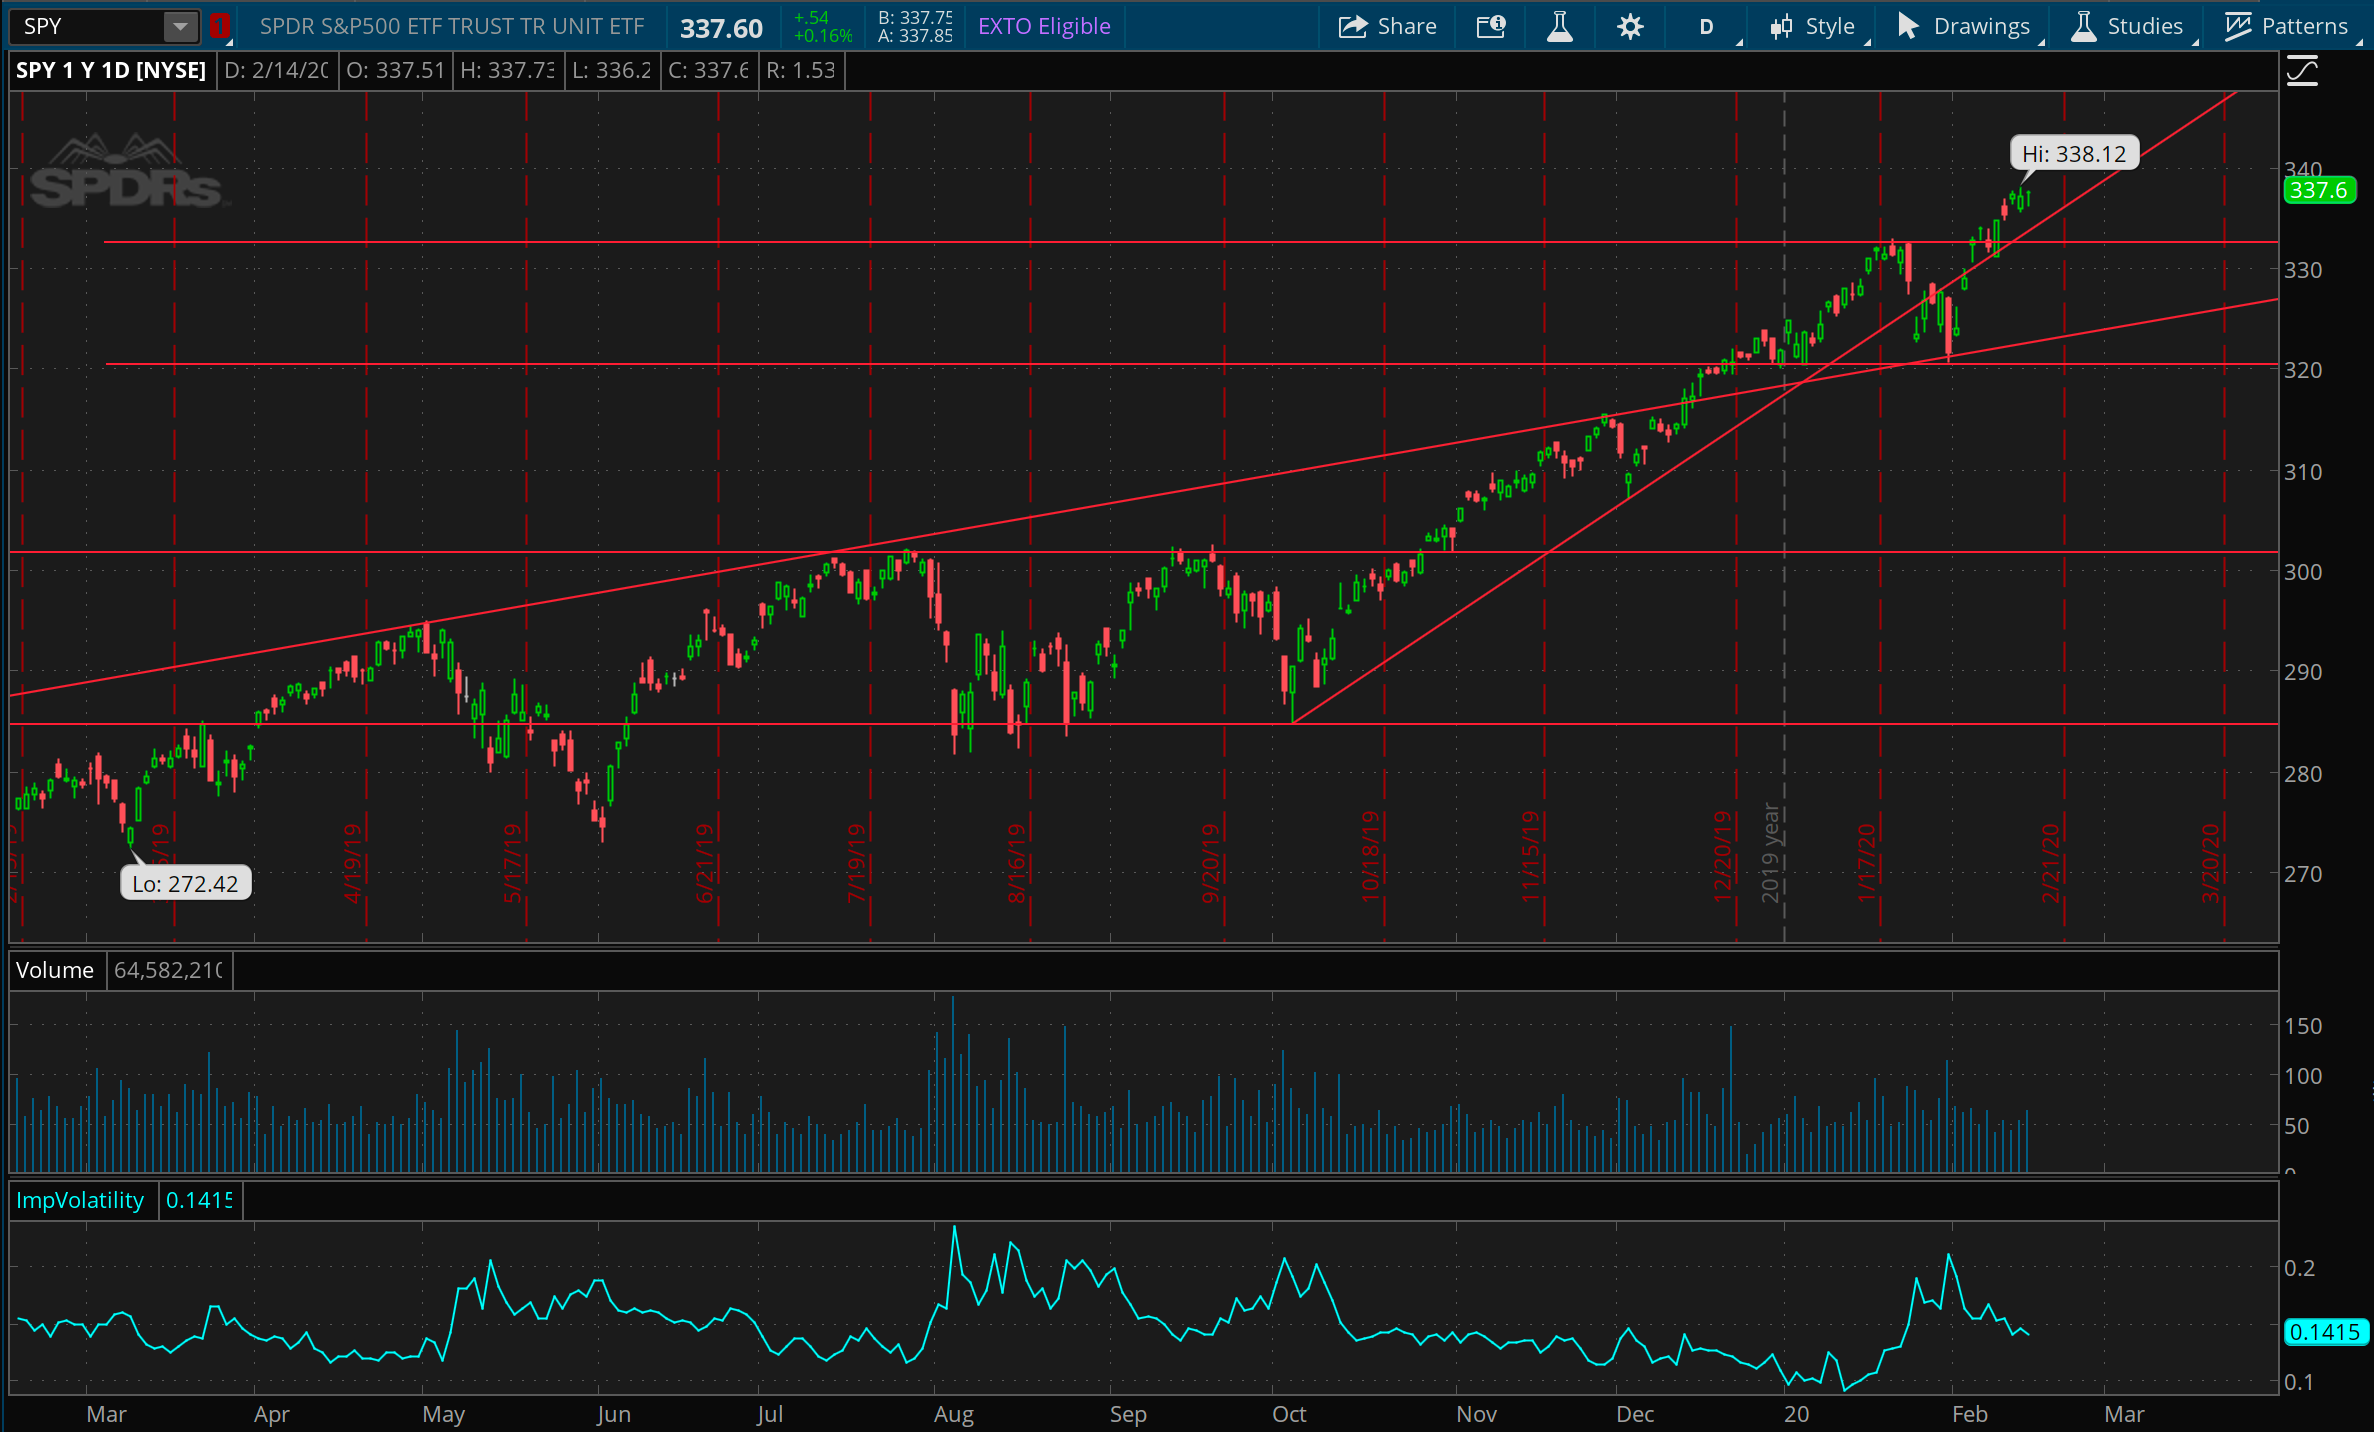
The S&P 500 continued to march forward this week, seemingly right on pace with the upward trendline that’s been in place since October, which was reclaimed last week. However, as mentioned last week, recent minor bouts of volatility suggest there may be more to come. In any case, this trendline is becoming a little less certain in terms of support. It feels like the market is just beginning to slow it’s pace against this rising trend. As such, my take from last week remains, which is that we should see some back-and-forth action between 340 and 320 for the next few weeks.
TLT
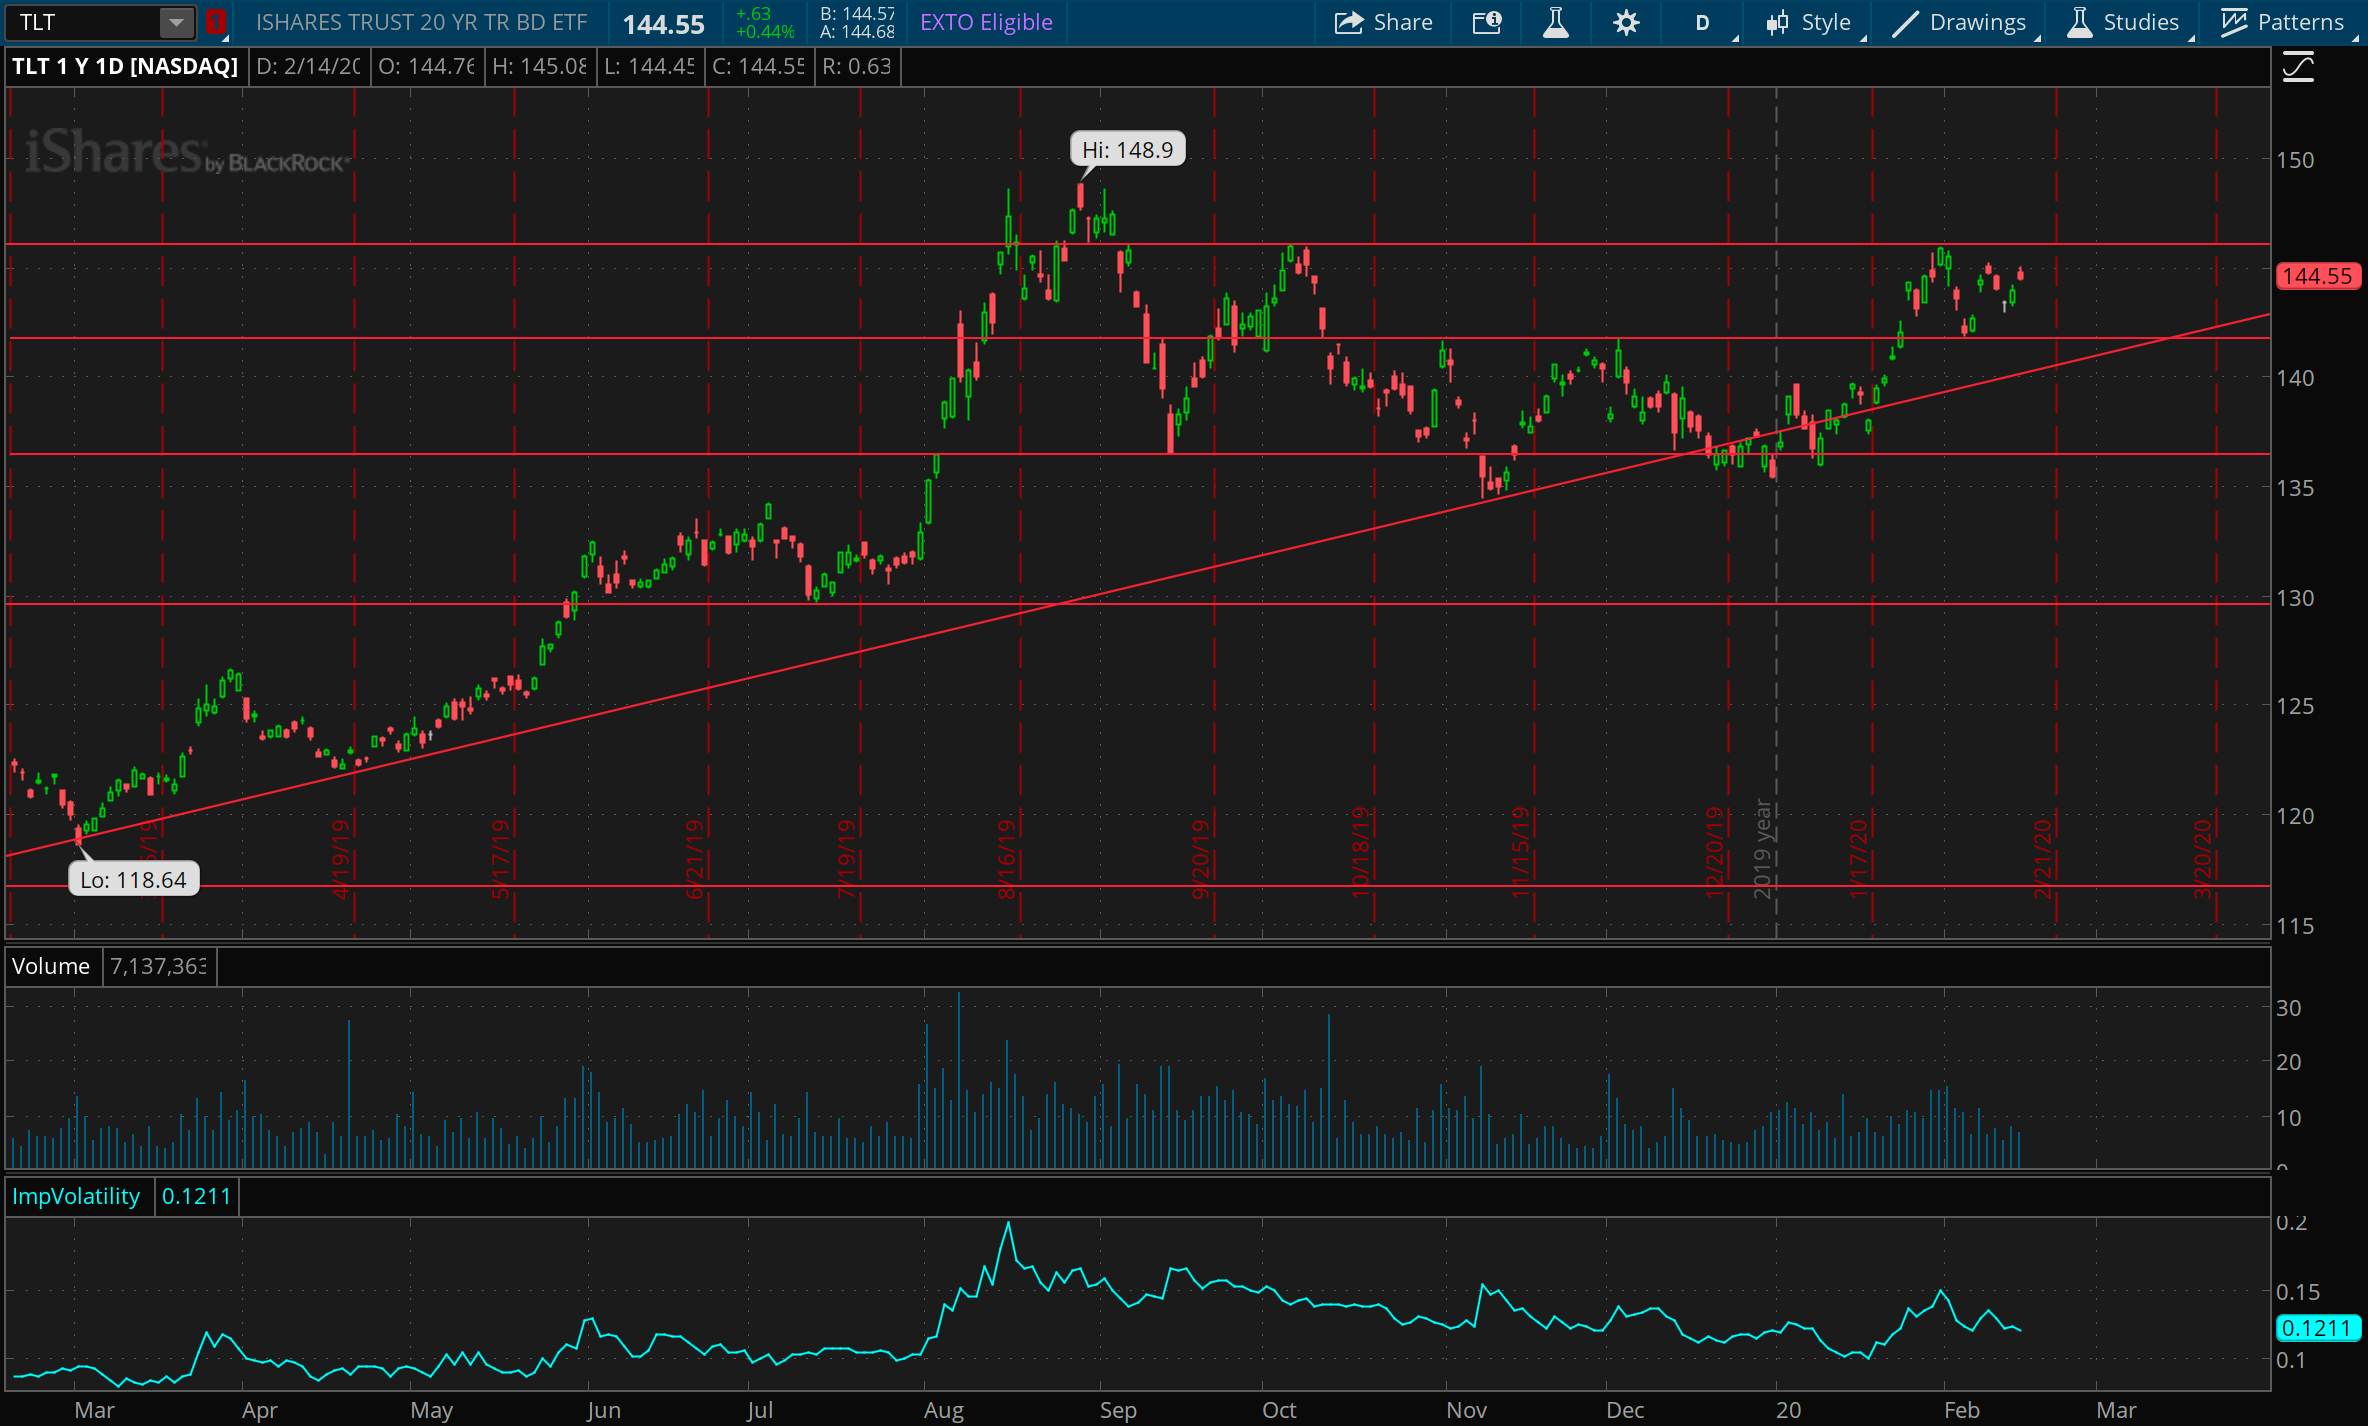
Bonds appear range bound for now, with an unchanged week inside of the current range between 142 and 146. As mentioned last week, I think there is a trade here for a break out of this range in either direction. Both the upper and lower bound appear well established according to prior pivots in price, though it looks like 142 is stronger as support than 146 is as resistance. Prices continue to insist and press towards the resistance line, and could proceed towards 149 on a break over 146. An unusually strong scenario would have TLT reach beyond the prior high of 149, but that feels less likely for now.
GLD
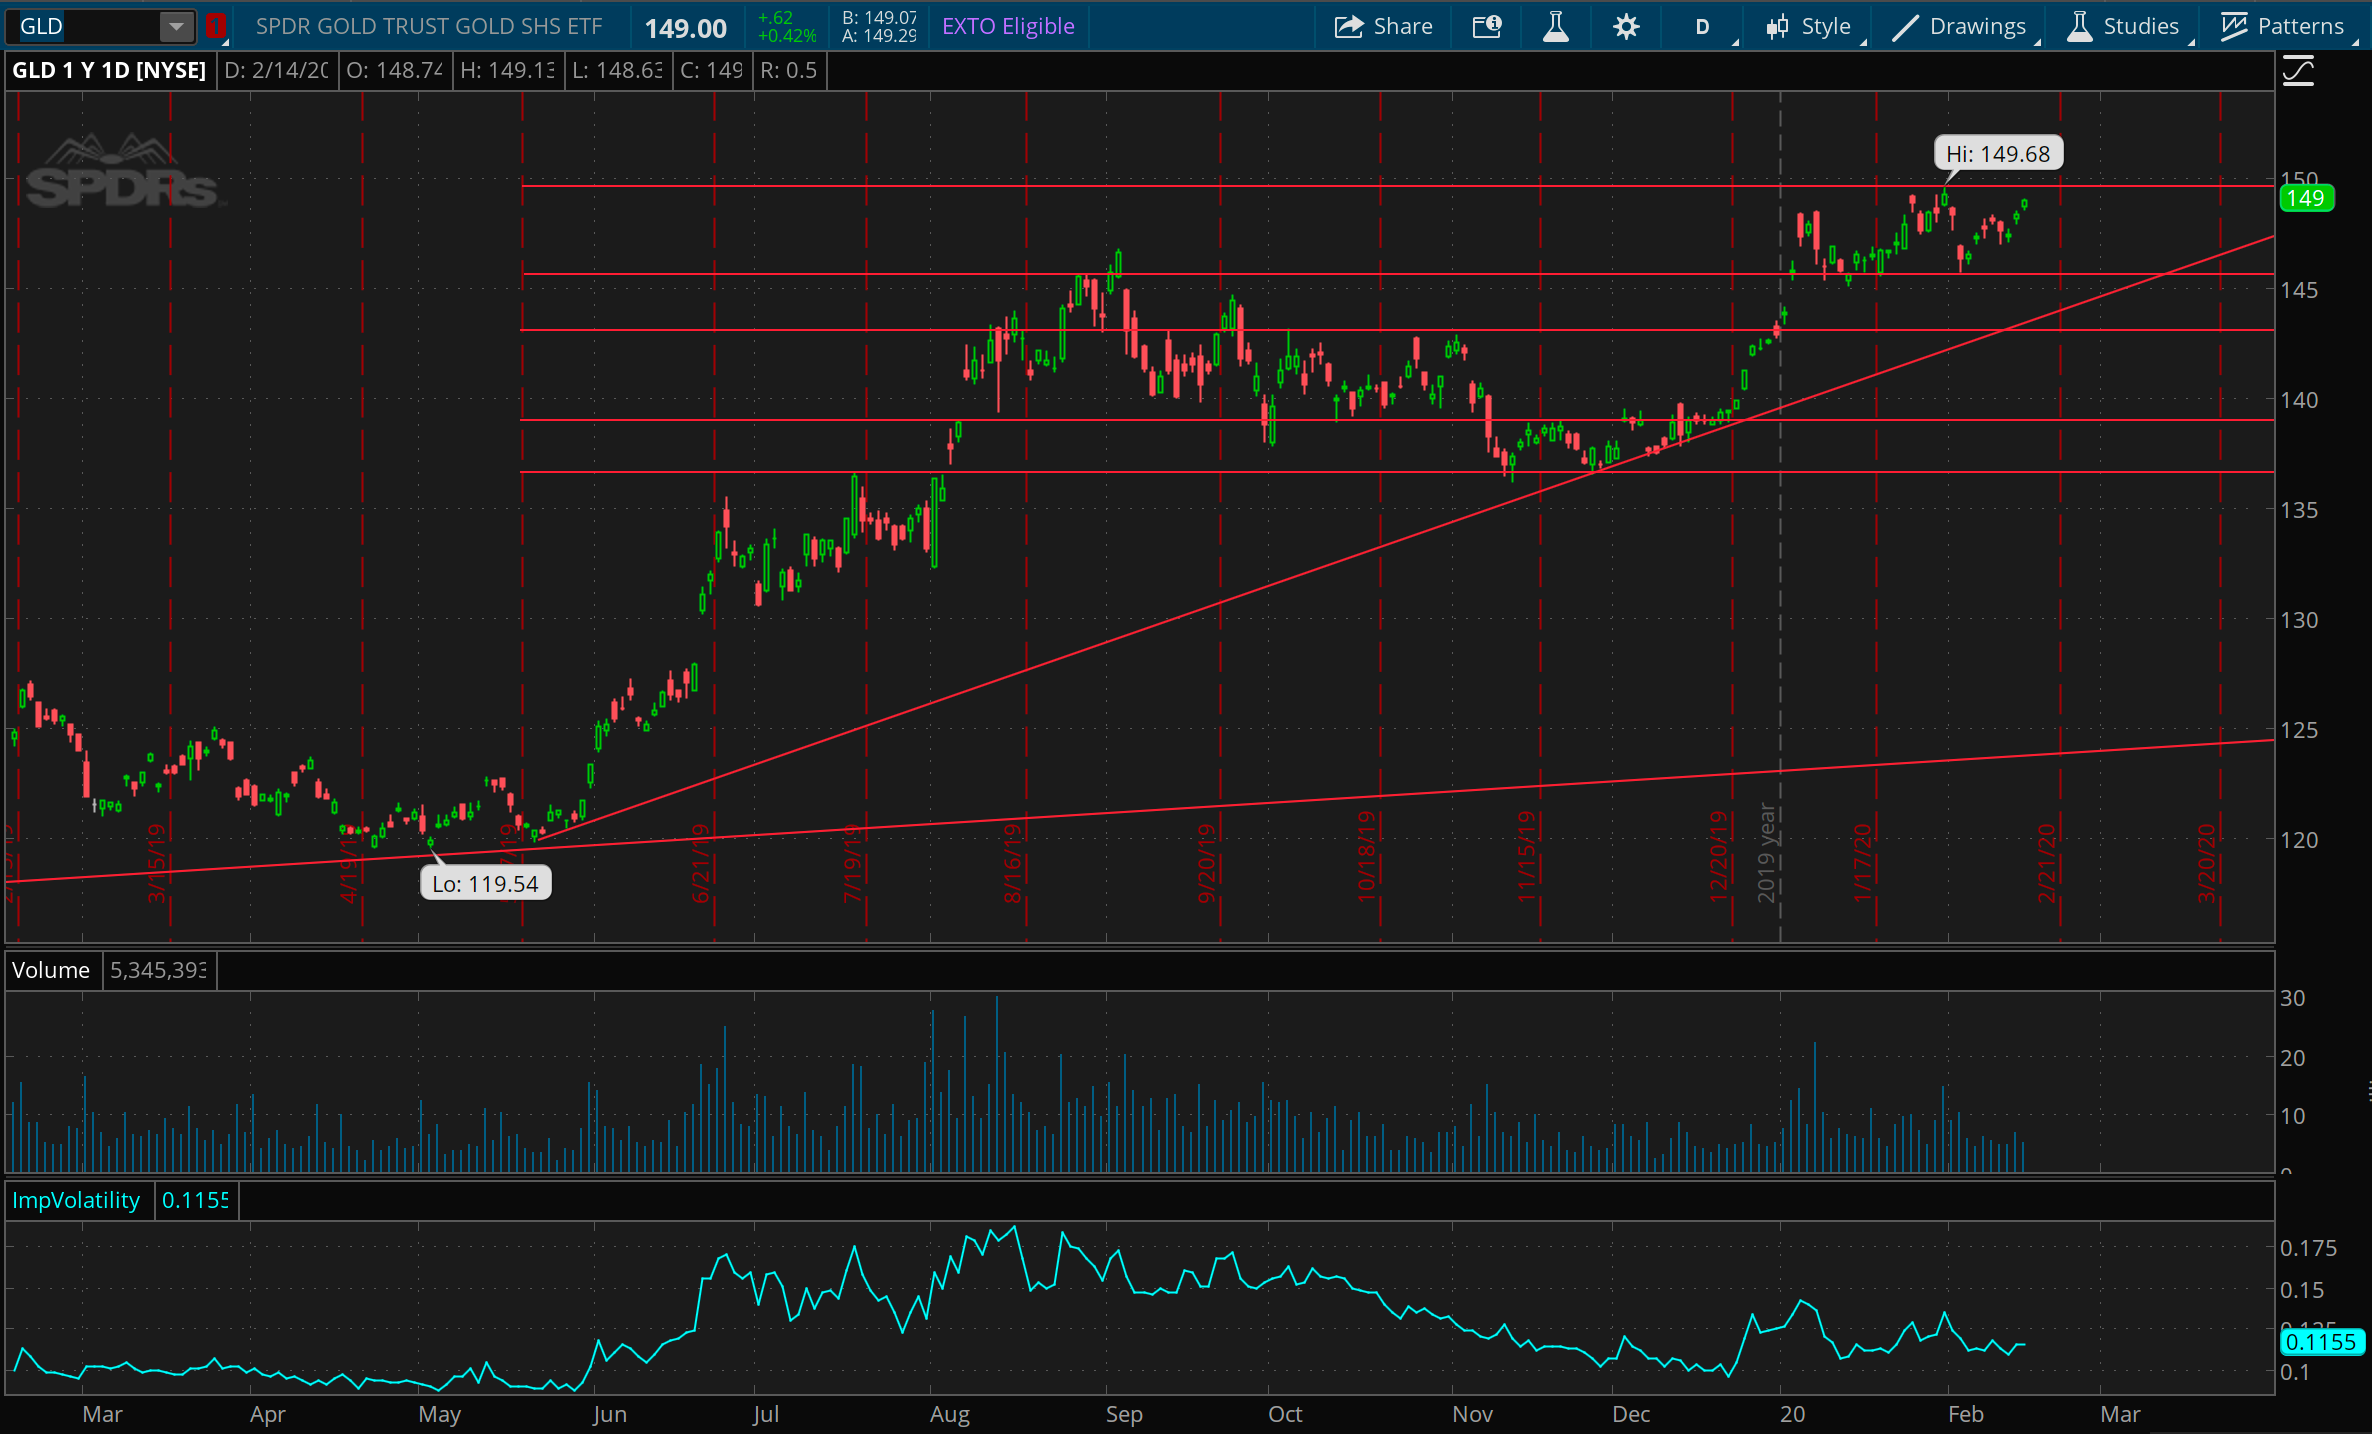
Gold has also been range bound for many weeks now. It looks like 150 is the number to beat in GLD. It continues to look well supported around the 145 level (and below), similarly to last week, and I would imagine a break of this range will be to the upside, though it’s hard to tell when. However, if and when it does break over 150, it seems very likely to show some upward momentum through that level. I currently have an alert set for that scenario, and will put on some aggressive short term long positions in that case.
USO
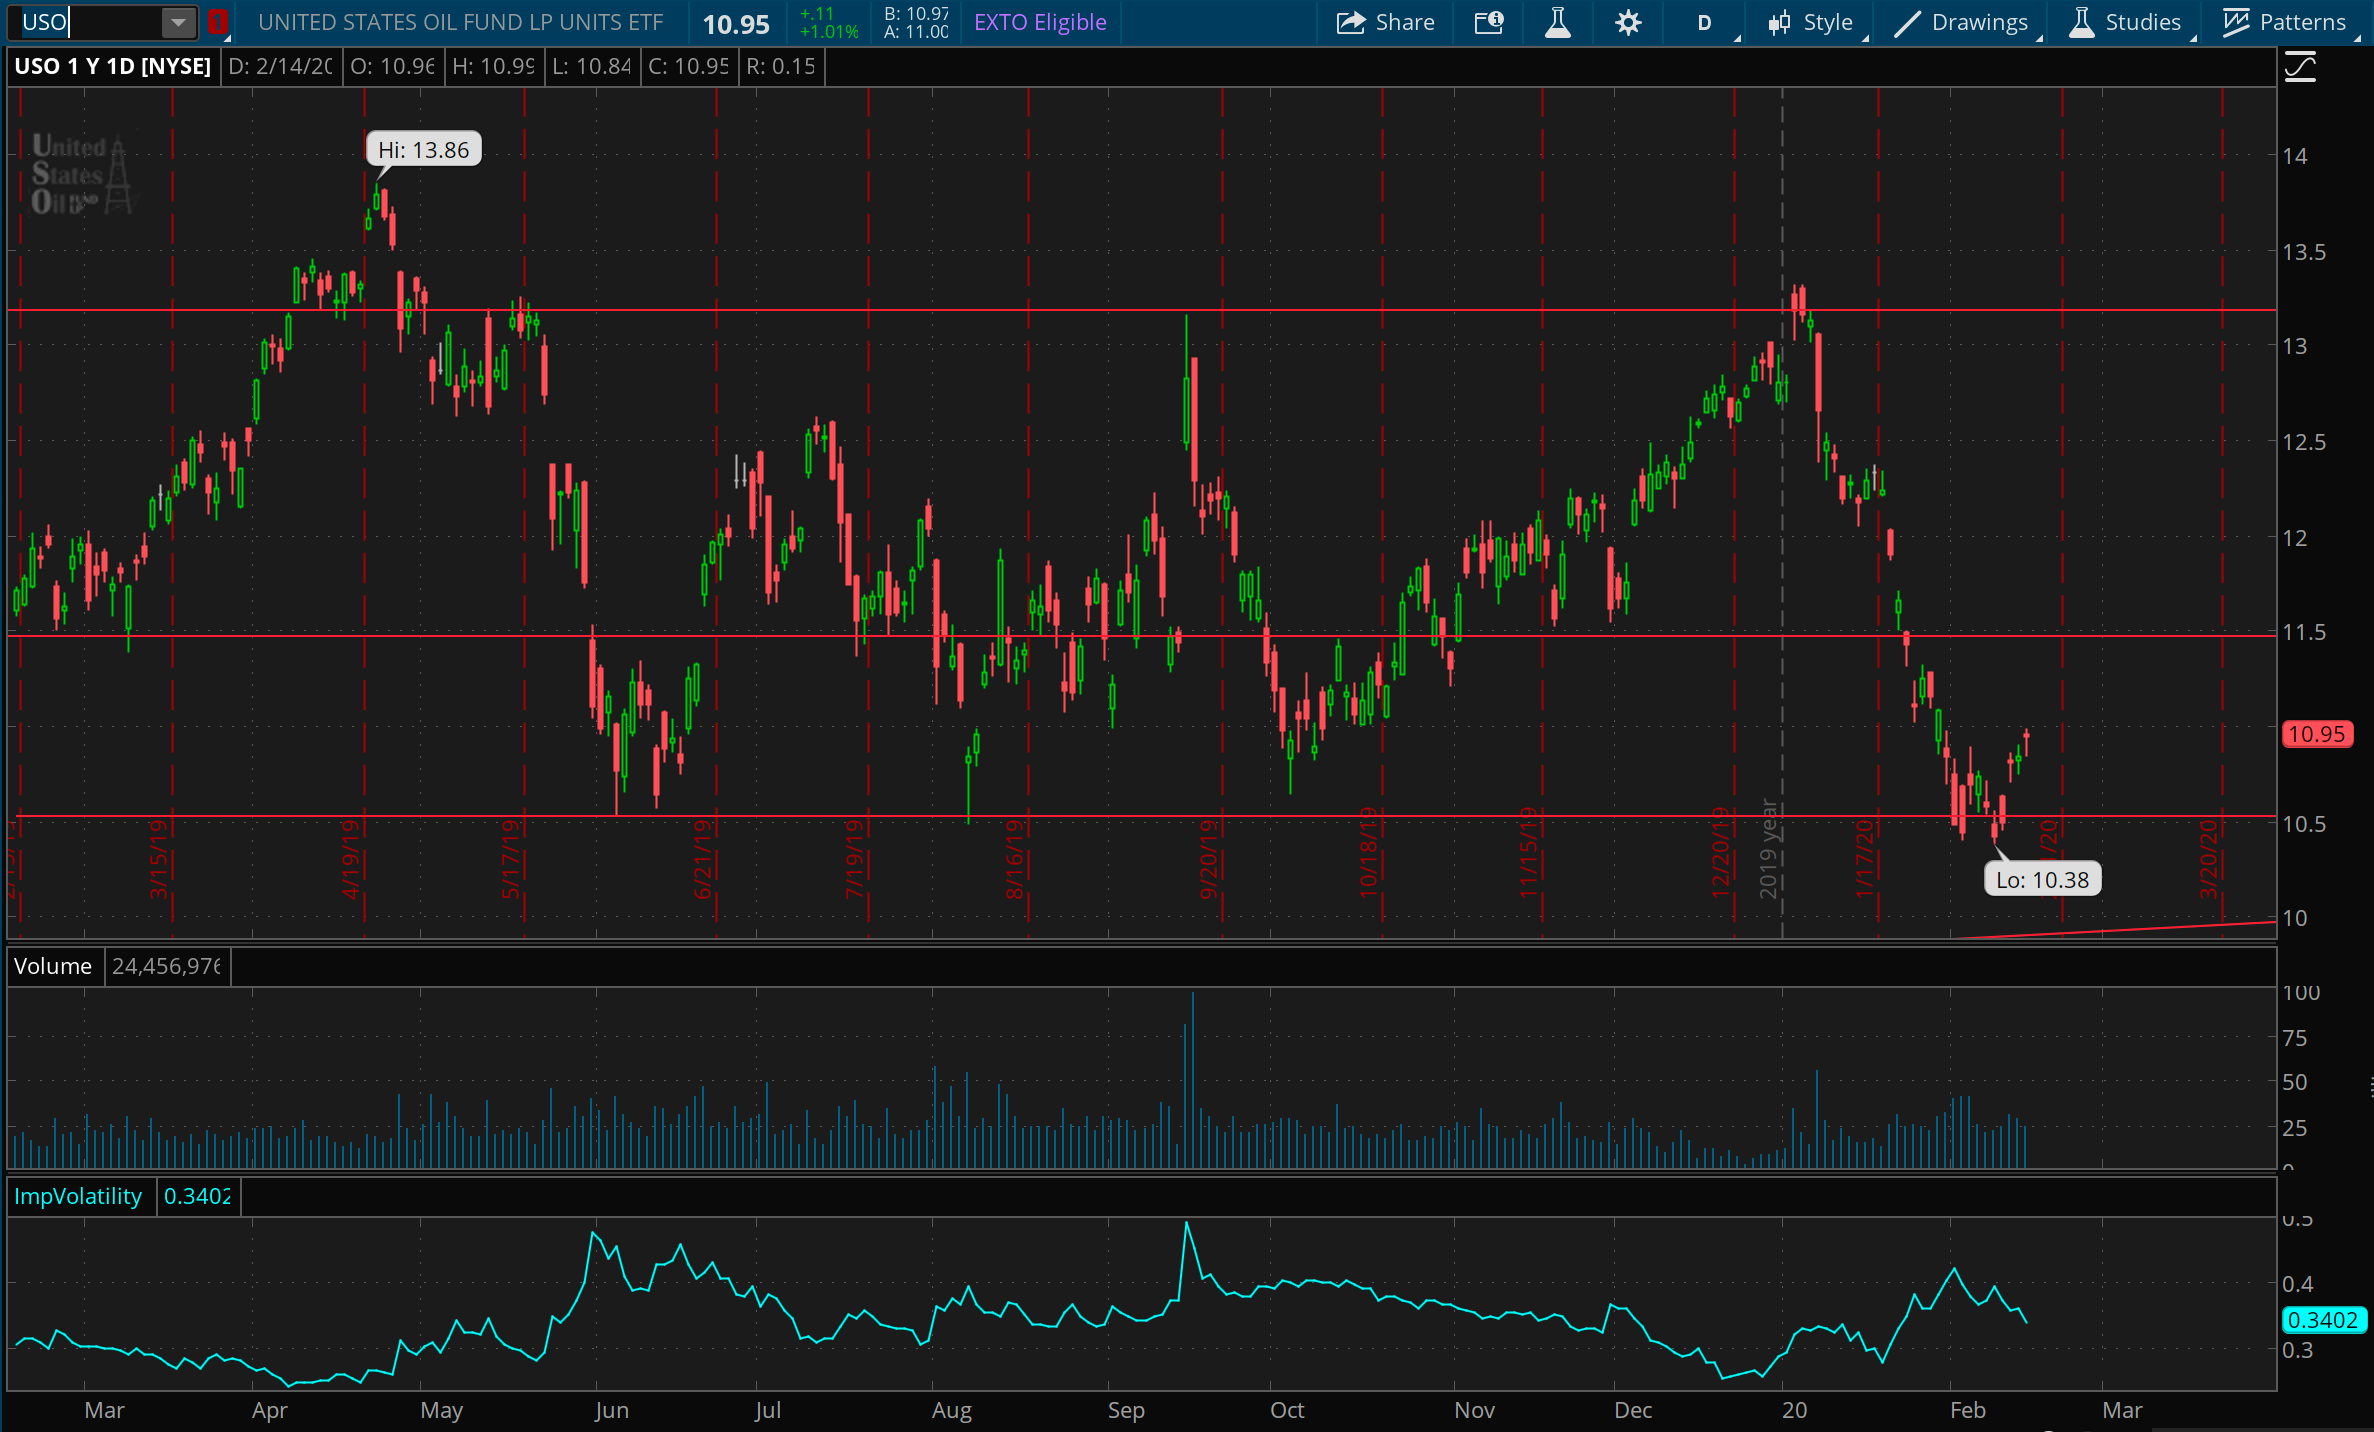
Oil is finally getting a bounce off of the make-or-break low that we reached last week, and one saw three other times in the past year. If oil is the key indicator of the global economic outlook, as I’ve been thinking for some time, this bounce is generally good news and may be showing us an improving outlook. However, it seems the equity markets never reacted to the huge downside move in oil that started at the beginning of 2020. Given that they did follow oil prices in the prior visits to this low, there is a unique divergence between equities and oil prices right now that I have to think will show up in equity markets soon. While QE is fueling ever more optimistic valuations for equities, it can’t simply create more global demand for oil. This is why I think oil has been the most honest price action throughout the coronavirus scare.
Copper
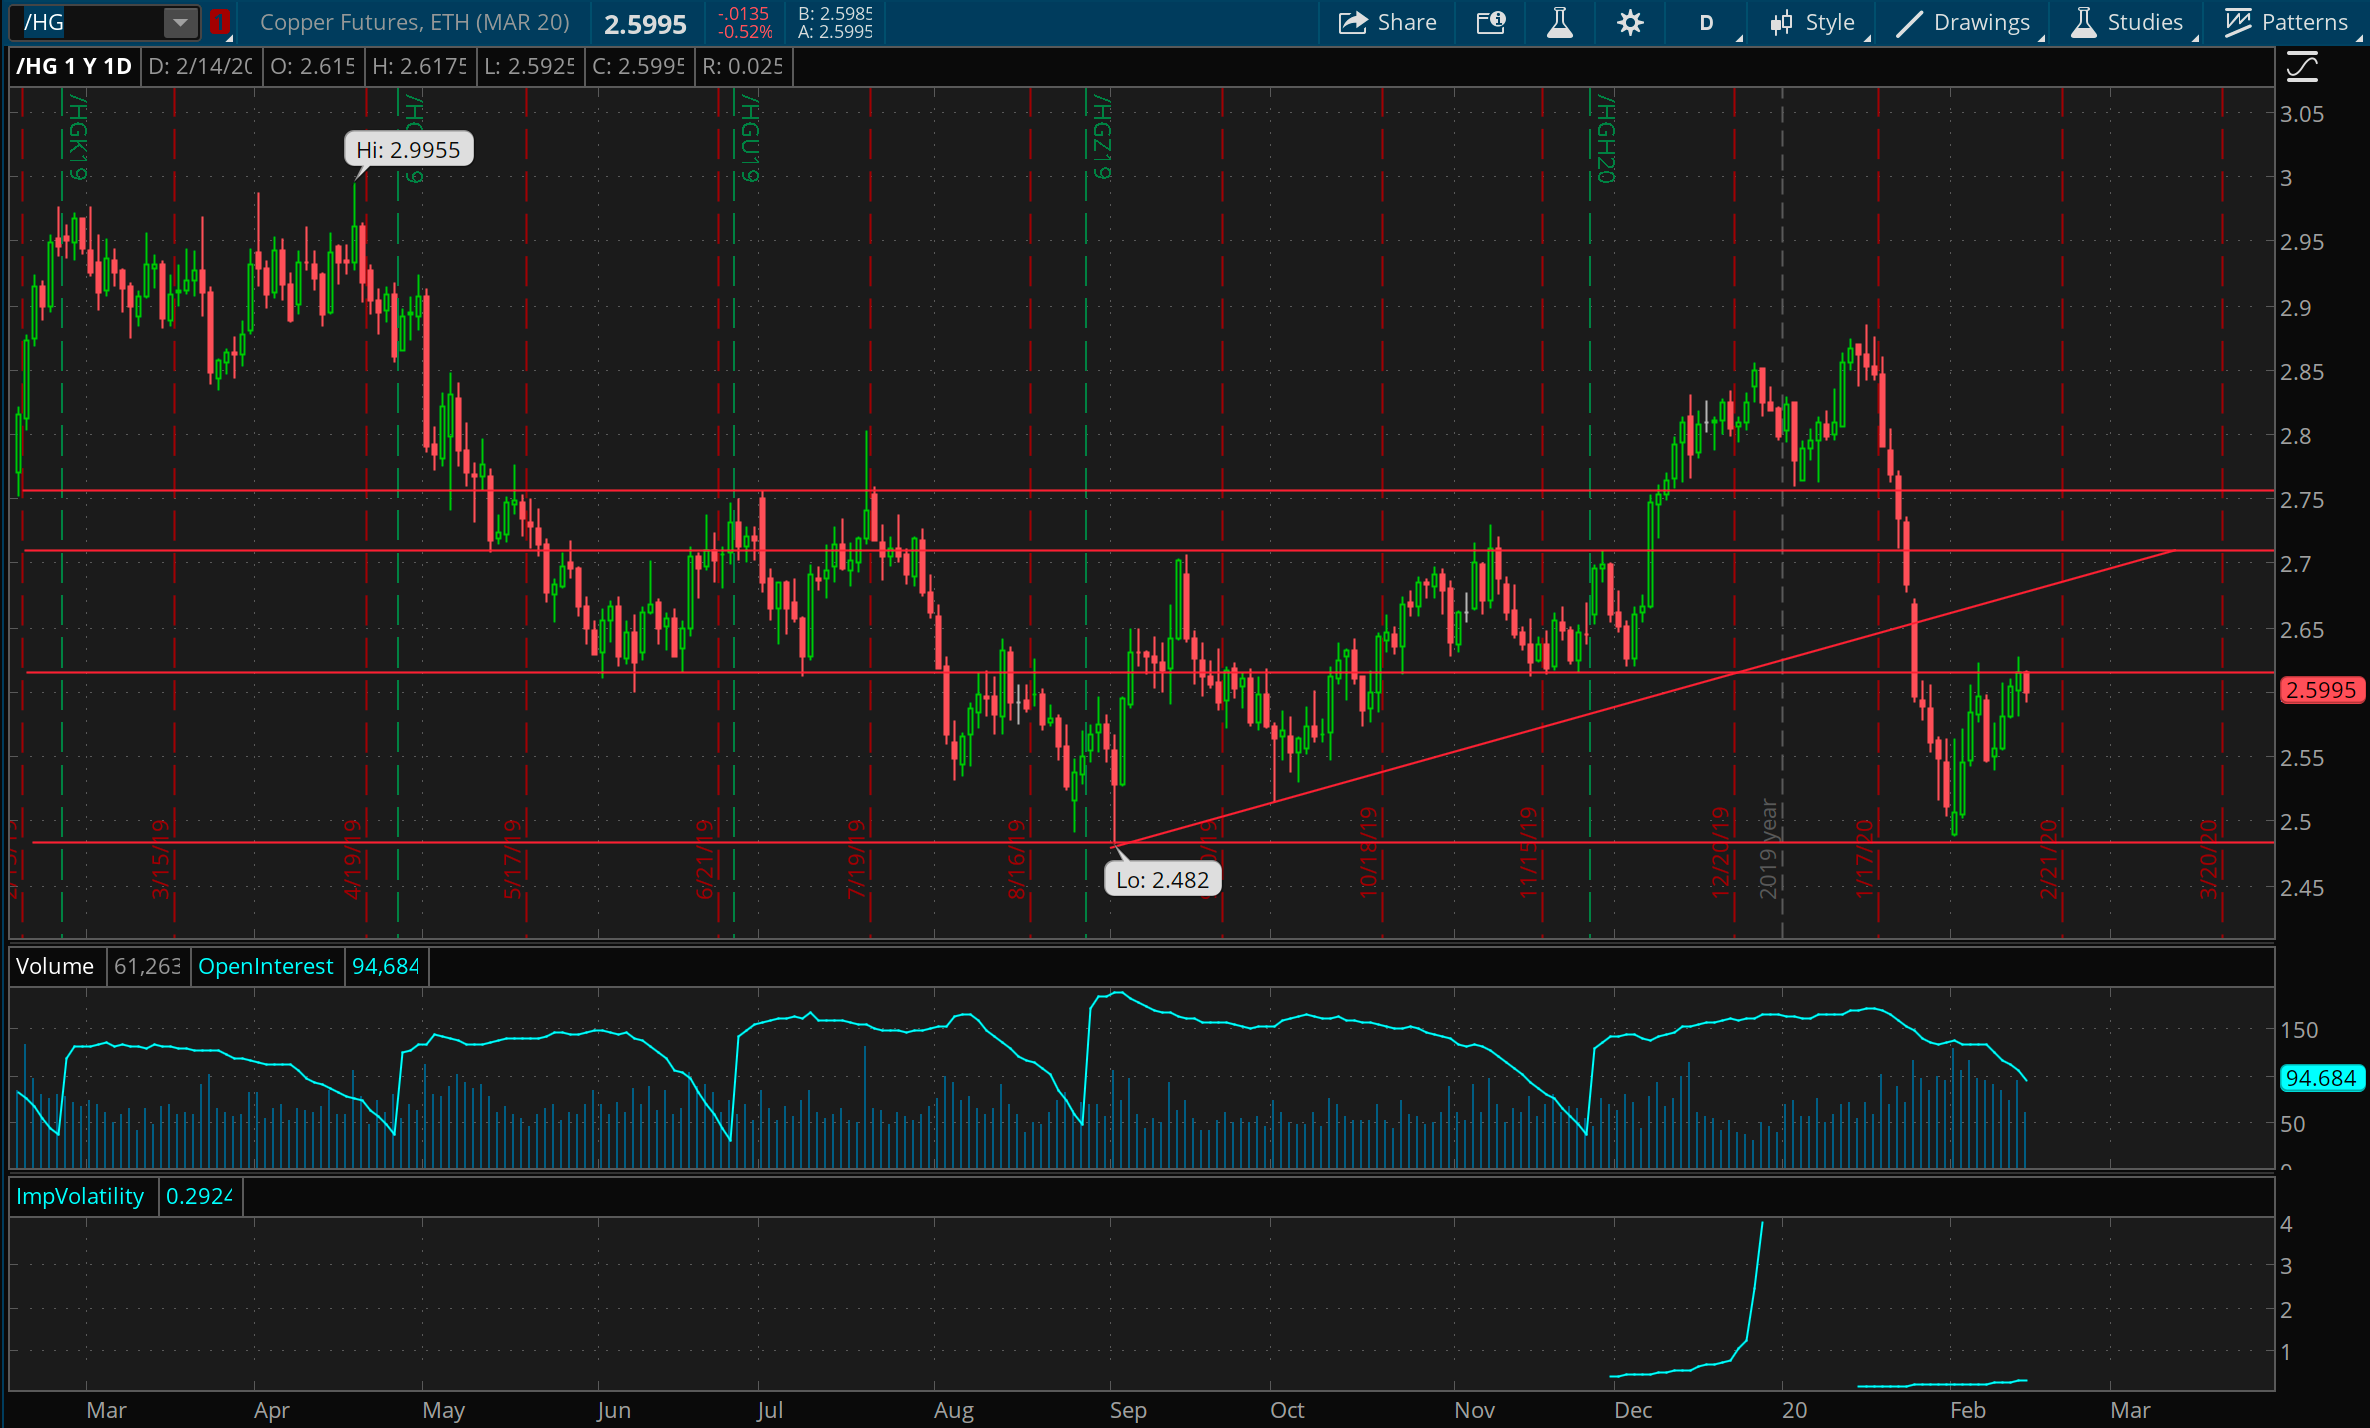
Speaking of signals of global demand, take a look at this chart of Copper futures. Because copper is used so widely in manufacturing, copper prices tend to be a proxy for forward looking global demand of manufactured goods. It’s no surprise that this looks quite a bit like the oil market, marking a significant decline since the beginning of 2020, and finally getting a bounce off of the lows over these past two weeks. There appears to be resistance at 2.6 where prices were rejected on Friday, and it seems prices will not want to stay at this level, either breaking free of 2.6 and likely marching on to 2.7, or else falling back down to 2.5.
Bitcoin
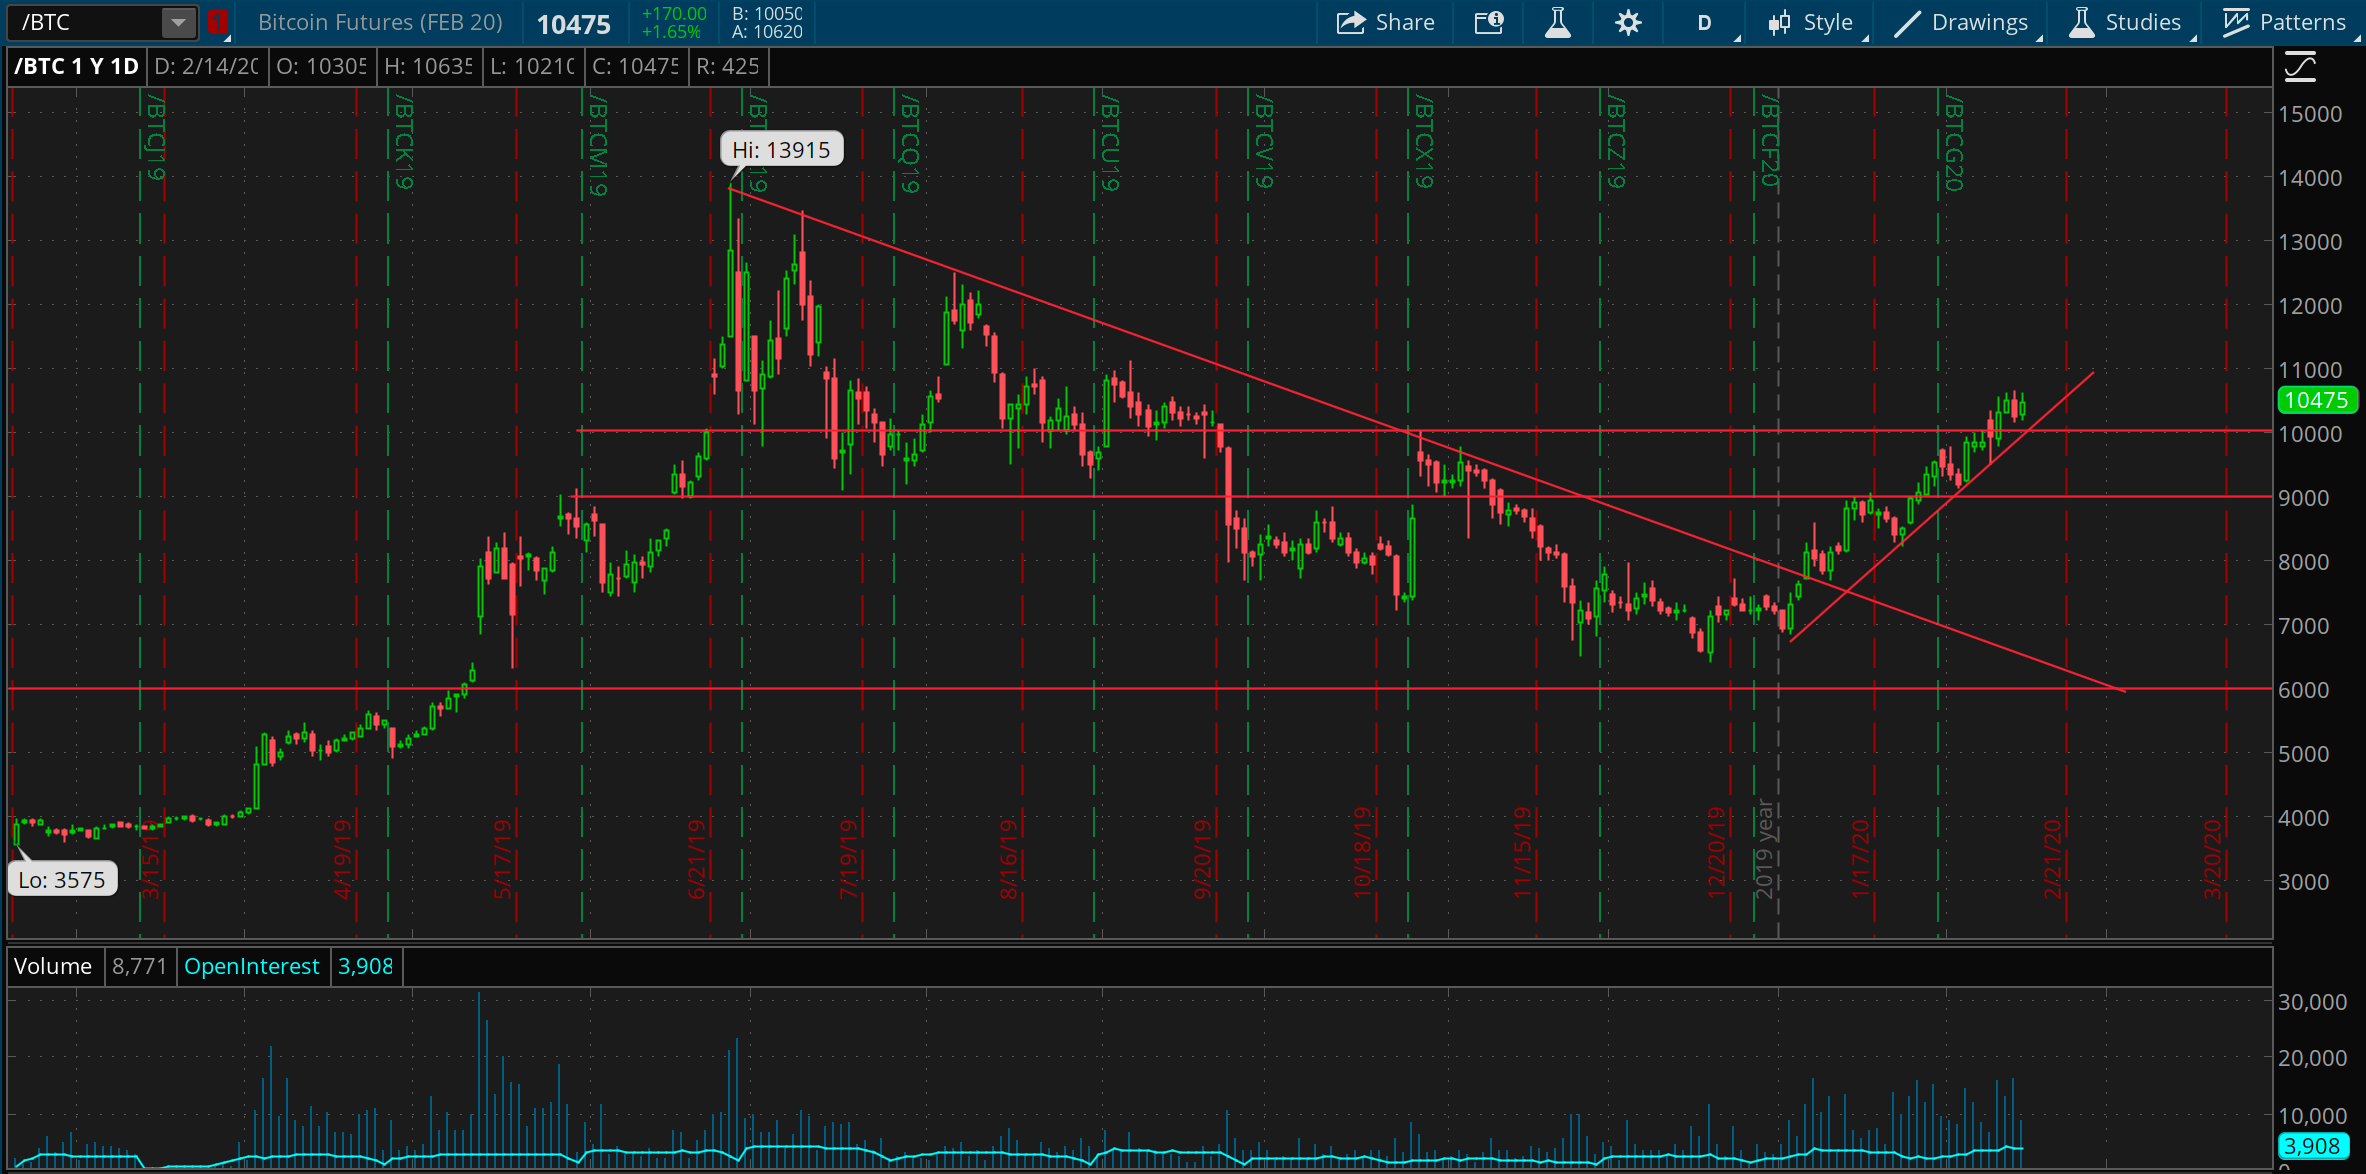
When we last checked in on Bitcoint prices two weeks ago, we finally saw a successful breakout over the crucial 9000 level, a place I felt quite strong about for a long position. Since then Bitcoin has been making a steady and relentless rise, heading above 10000 and showing no particular signs of slowing down. The fact that prices aren’t swinging around wildly or changing pace is a sign of health for Bitcoin generally, and we may be watching a process of establishing more foundational stability in Bitcoin as an asset class. It would seem 11000 and 12000 are both places of resistance for prices to stop and think, but for now the trend is clearly higher until something changes.
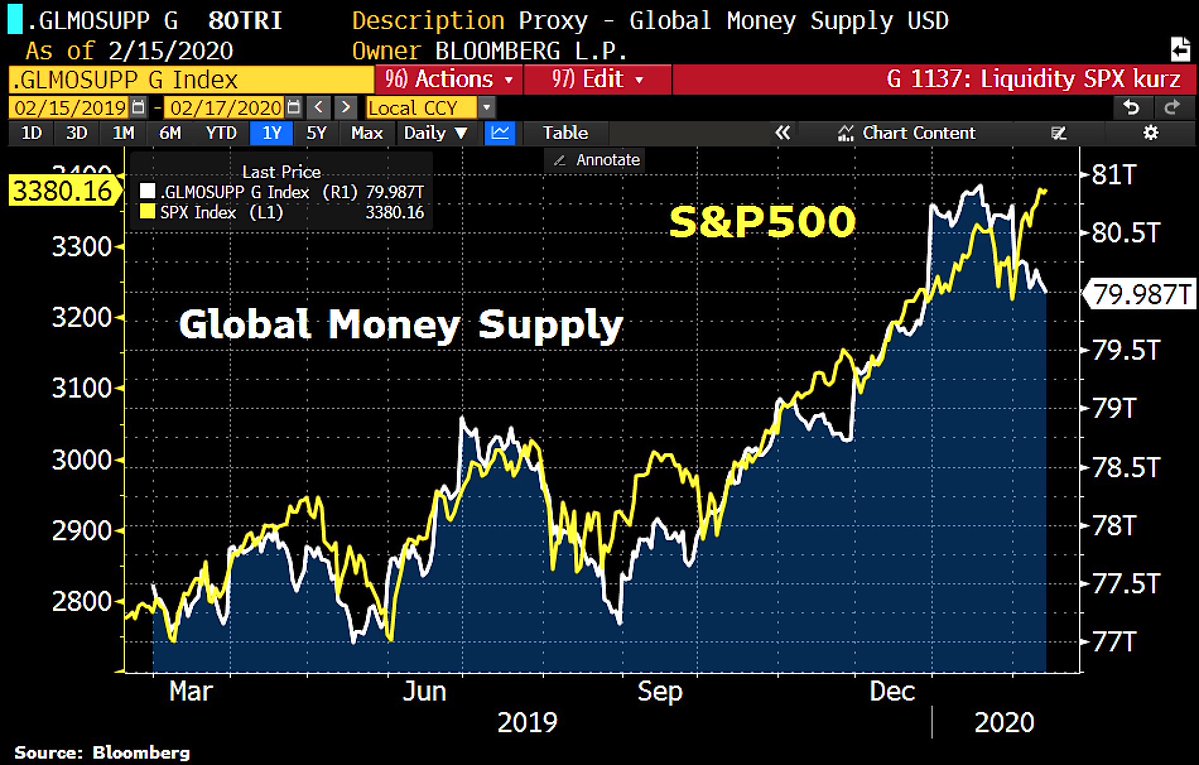
The chart of the week
A lot of folks out there are highlighting any divergence with the market they see. This has been pretty rampant since mostly stocks have been going straight up, and not everything goes straight up! Therefore there are a lot of gaps that have emerged. I’ve been pointing to some myself, such as the divergence between equity and oil prices.
If you believe that what is actually pushing the market forward is ultimately monetary policy and global liquidity, this chart from Holger Zschaepitz may be the most meaningful divergence unfolding right now, and may very well spell a short-term pause or drop in equity markets (or else a quick bounce back in liquidity measures from central banks!).