
China troubles, news vs reality, and the big earnings show
This week was one hell of a month.
For one, there was a lot of news. The most substantial story, as it was last week, is the evolving corona virus outbreak in China.
Normally, I think a lot of market observers shape the news around the price action. On bullish days, you get a bullish version of the story. When things are dropping, you get the grim version.
In fact, this week actually gave us a perfect example of that when the virus was bad on Monday, not a problem Thursday, big problem Friday.
That said though, I believe this situation is actually moving markets, due to the uncertainty around how big the economic impact will ultimately be. China is the critical part of the global economy right now, and it’s bearing the brunt of this. It doesn’t help that it’s severely propped up on debt, and could cause real damage globally if it went into economic crisis.
But that’s doom and gloom stuff.
You know what else happened? Apple, Facebook, Amazon, Microsoft, and Tesla (among others) reported earnings this week. And weren’t they an eventful bunch. Facebook’s flop, Tesla’s perma squeeze, and the trillion dollar orgy that was Amazon earnings. Oh man.
Tesla and Amazon both had fairly large earnings surprises to the upside, and investors went falling over themselves to buy into the change in expectations for them. And yet. Look, the thing is these were big earnings results achieved in Q4 of 2019. It’s seasonally a great time for companies to outperform in an outsized way. And generally the economic outlook was positive. The market has been anticipating good results and rising relentlessly since October when Q4 started.
But let’s stop and ask: what’s today’s outlook? How is that outlook being affected by the impact of the global health emergency, the increasing awareness of the Feds influence on the repo market, or equity markets that appear over concentrated and over priced. To be fair, the strong US economic environment might just chug along anyway and keep carrying us to new all time highs.
At any rate, there is cause to wonder if some of these big upside moves are getting bid up by investors projecting company futures into an endless economic expansion. Meanwhile, disruptions can in fact happen, and outlooks can change. And while some of the biggest market cap companies are popping open the champagne, the broad global economy is holding it’s breath and hoping the virus doesn’t cause prolonged damage. Investors are arguably rushing into the few stocks that are carrying this bull market on their shoulders, and dropping everything else, effectively placing their heads squarely in the sand.
Did I mention that the yield curve inverted again this week?
I’m not saying this is clearly the end of the bull run or that we’ve put in the highs, but between the general outlook and reality, along with a first touch of volatility in months, it’s possible that things could continue to thrash in both directions over the next few weeks at least.
Now, much like last week, the weekend could build some pressure for Sunday night’s open in the futures market, given that this virus has no concept of Saturdays or Sundays.
But we do! So enjoy them if you can. It is Super Bowl Sunday after all.
The Four Horsemen
SPY
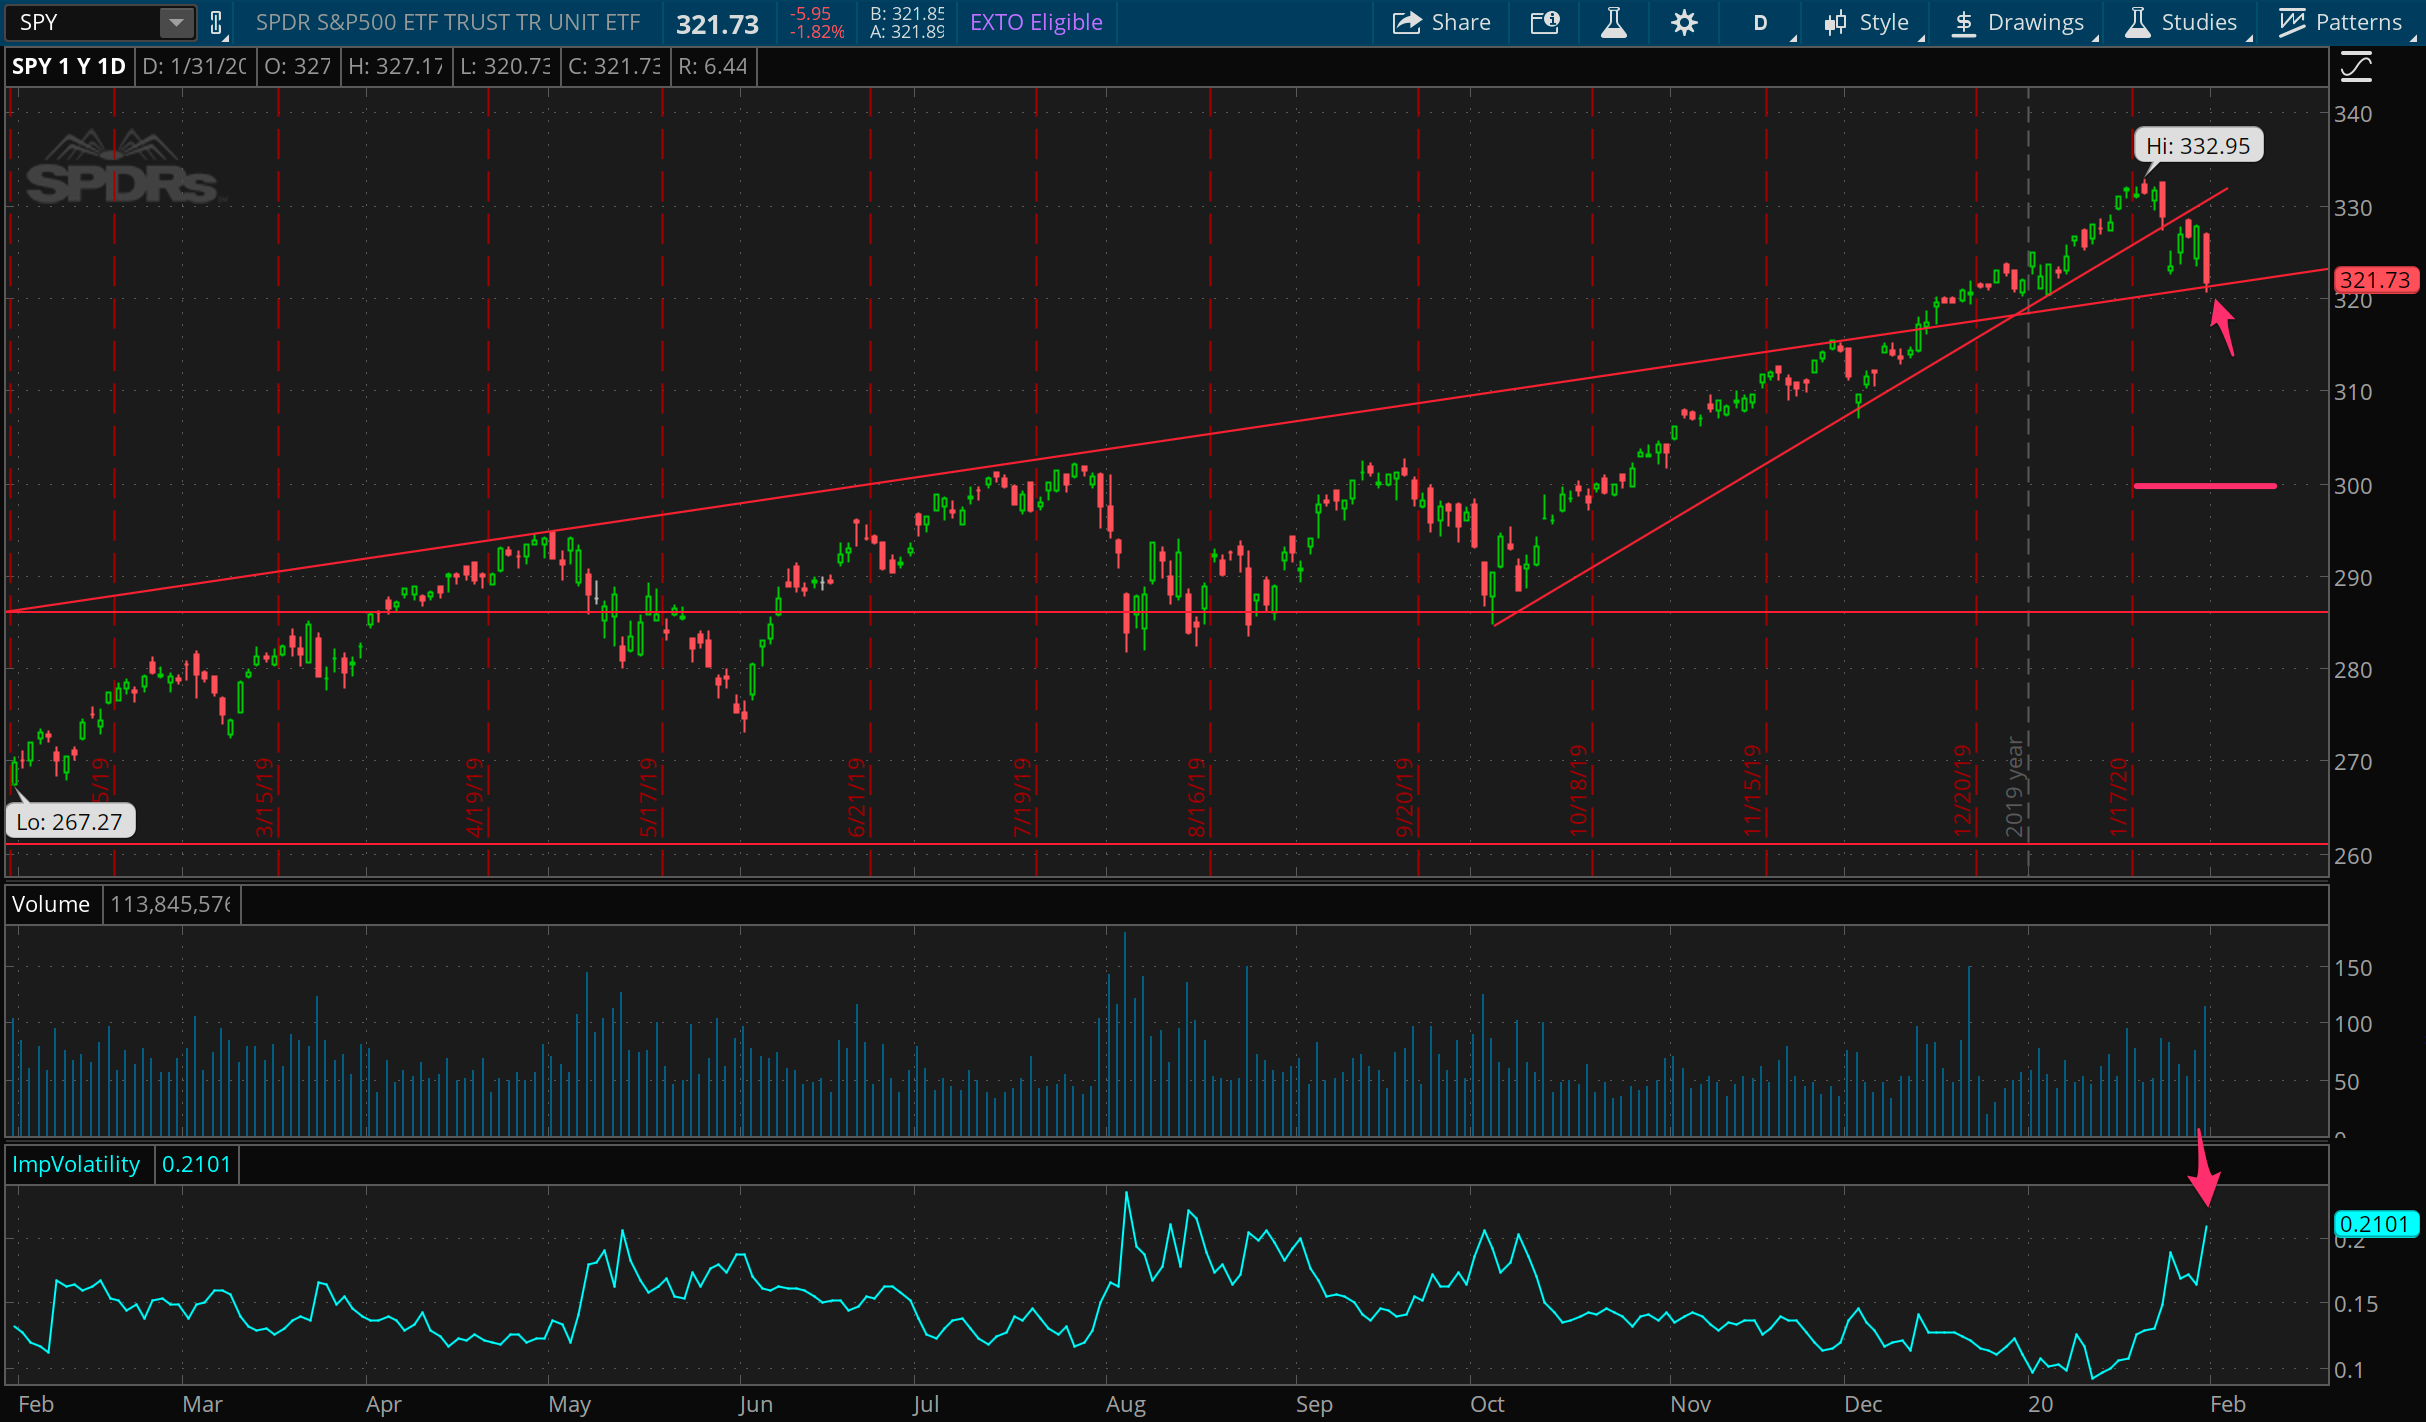
We stayed below the closing price from last Friday’s “dramatic” fall, firmly breaking a very consistent up trend that’s been in place since last October. As noted last week, the 320 area became a place for this market to stop and think, though Friday’s return right to this area brings some uncertainty about how things will resolve Sunday. I think we’re at least in for some two sided price action between 320 and 335. If instead the market goes into free fall, 310 seems a very likely place for another bounce or pause. Finally, 300 still stands as the major line in the sand.
TLT

The bonds had serious follow through to the upside breakout we saw last week. I expected to see them take off if we saw more selling in equities, and that’s just what we saw this week. I’d picked up some upside calls at 145 at the end of last week and was able to sell them out at a 150% return on capital. However, we’ve quickly reached an area of prior resistance, and I could imagine sideways or slowly falling prices for TLT in the coming week or two. My sense is that this is signaling the potential for a lot of sideways chop in the overall market as investors sort out how much to anticipate changes in economic outlook from the virus and continued earnings results.
GLD
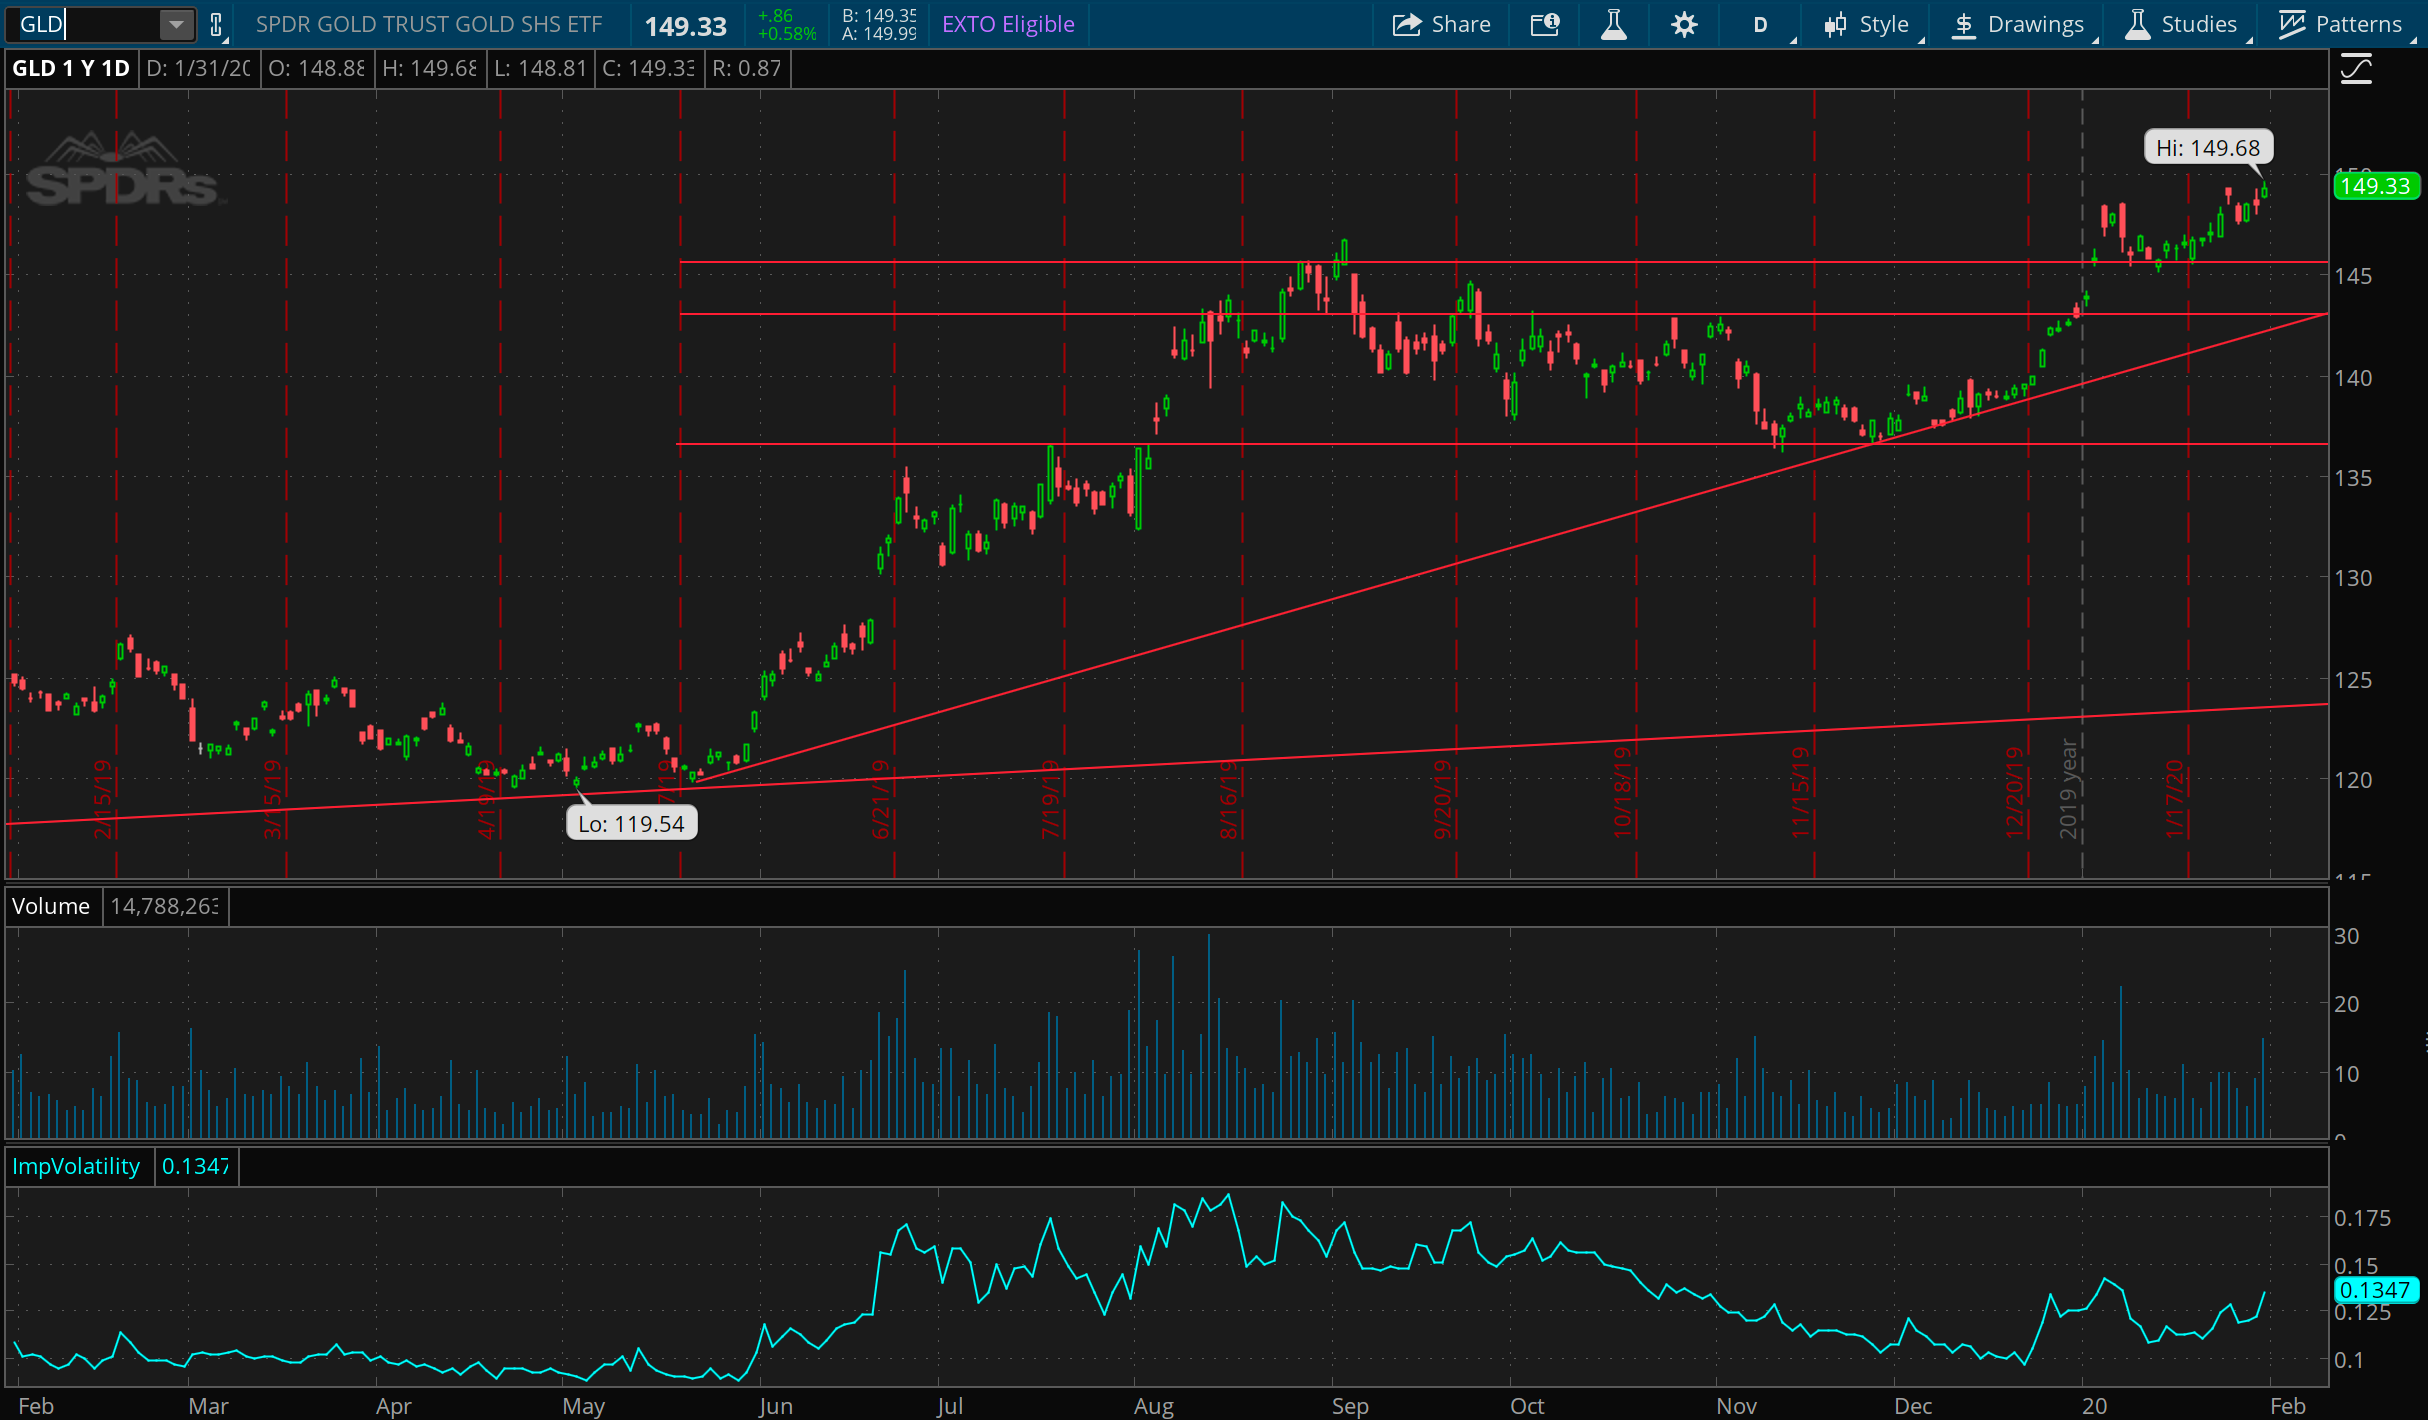
Gold is still looking well supported at 145, which we’ve seen it hold for weeks now. Last week, I mentioned that GLD is sitting at 7 year highs currently. While we haven’t seen anything suggesting inflation is rearing it’s head, this may still be a signal that investors think the amount of liquidity being supplied by the Federal reserve could stand to ultimately weaken the dollar, or help fuel a debt crisis. This thought would be well inline with the fact that gold and stocks have risen together over the past year, both being fueled by the overabundance of economic stimulus from the Fed.
USO
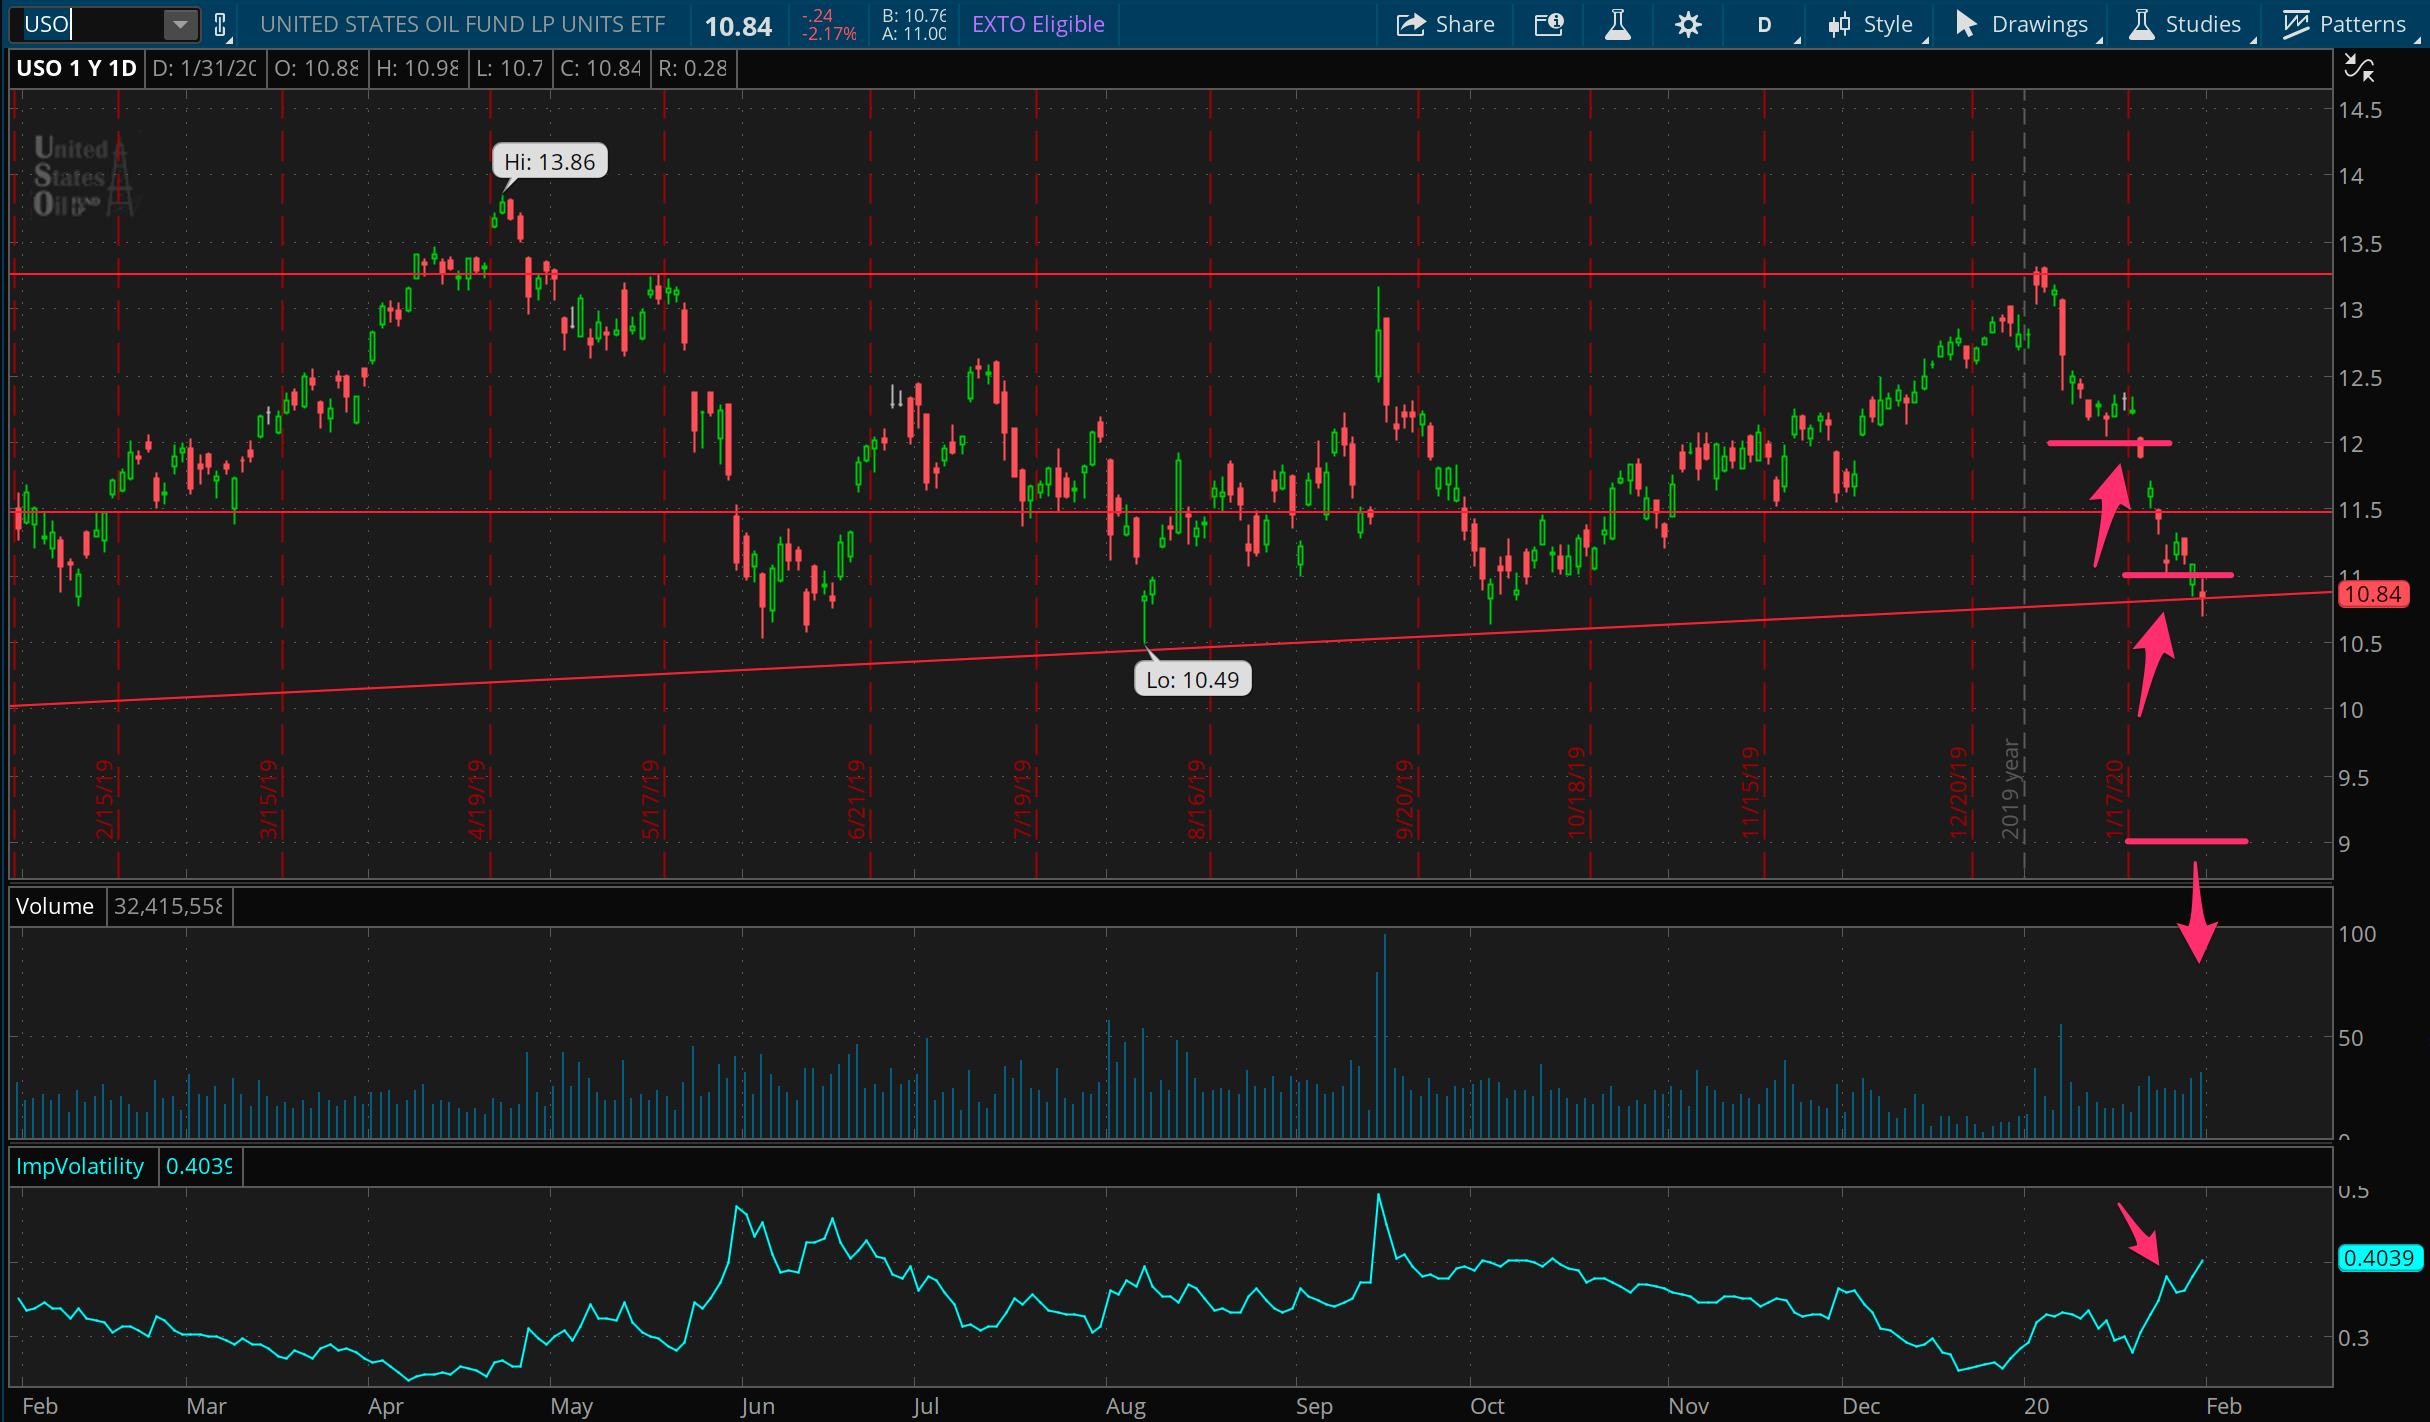
I’m convinced that oil is the canary in the coal mine for the global economic outlook, and a rough proxy for China, as stated last week. It’s fallen aggressively down to a multi-year support level, and what happens next with oil may tell us a lot about what to expect in the other asset classes. I’ve added further to a long position here to see if we get a bounce from this level, but I’ve also hedged the position with a lot of puts down at the 9 level. If we break down through this support and things get ugly, this long position will automatically turn into a short as the delta in those puts increases.
Lightning round…
AAPL
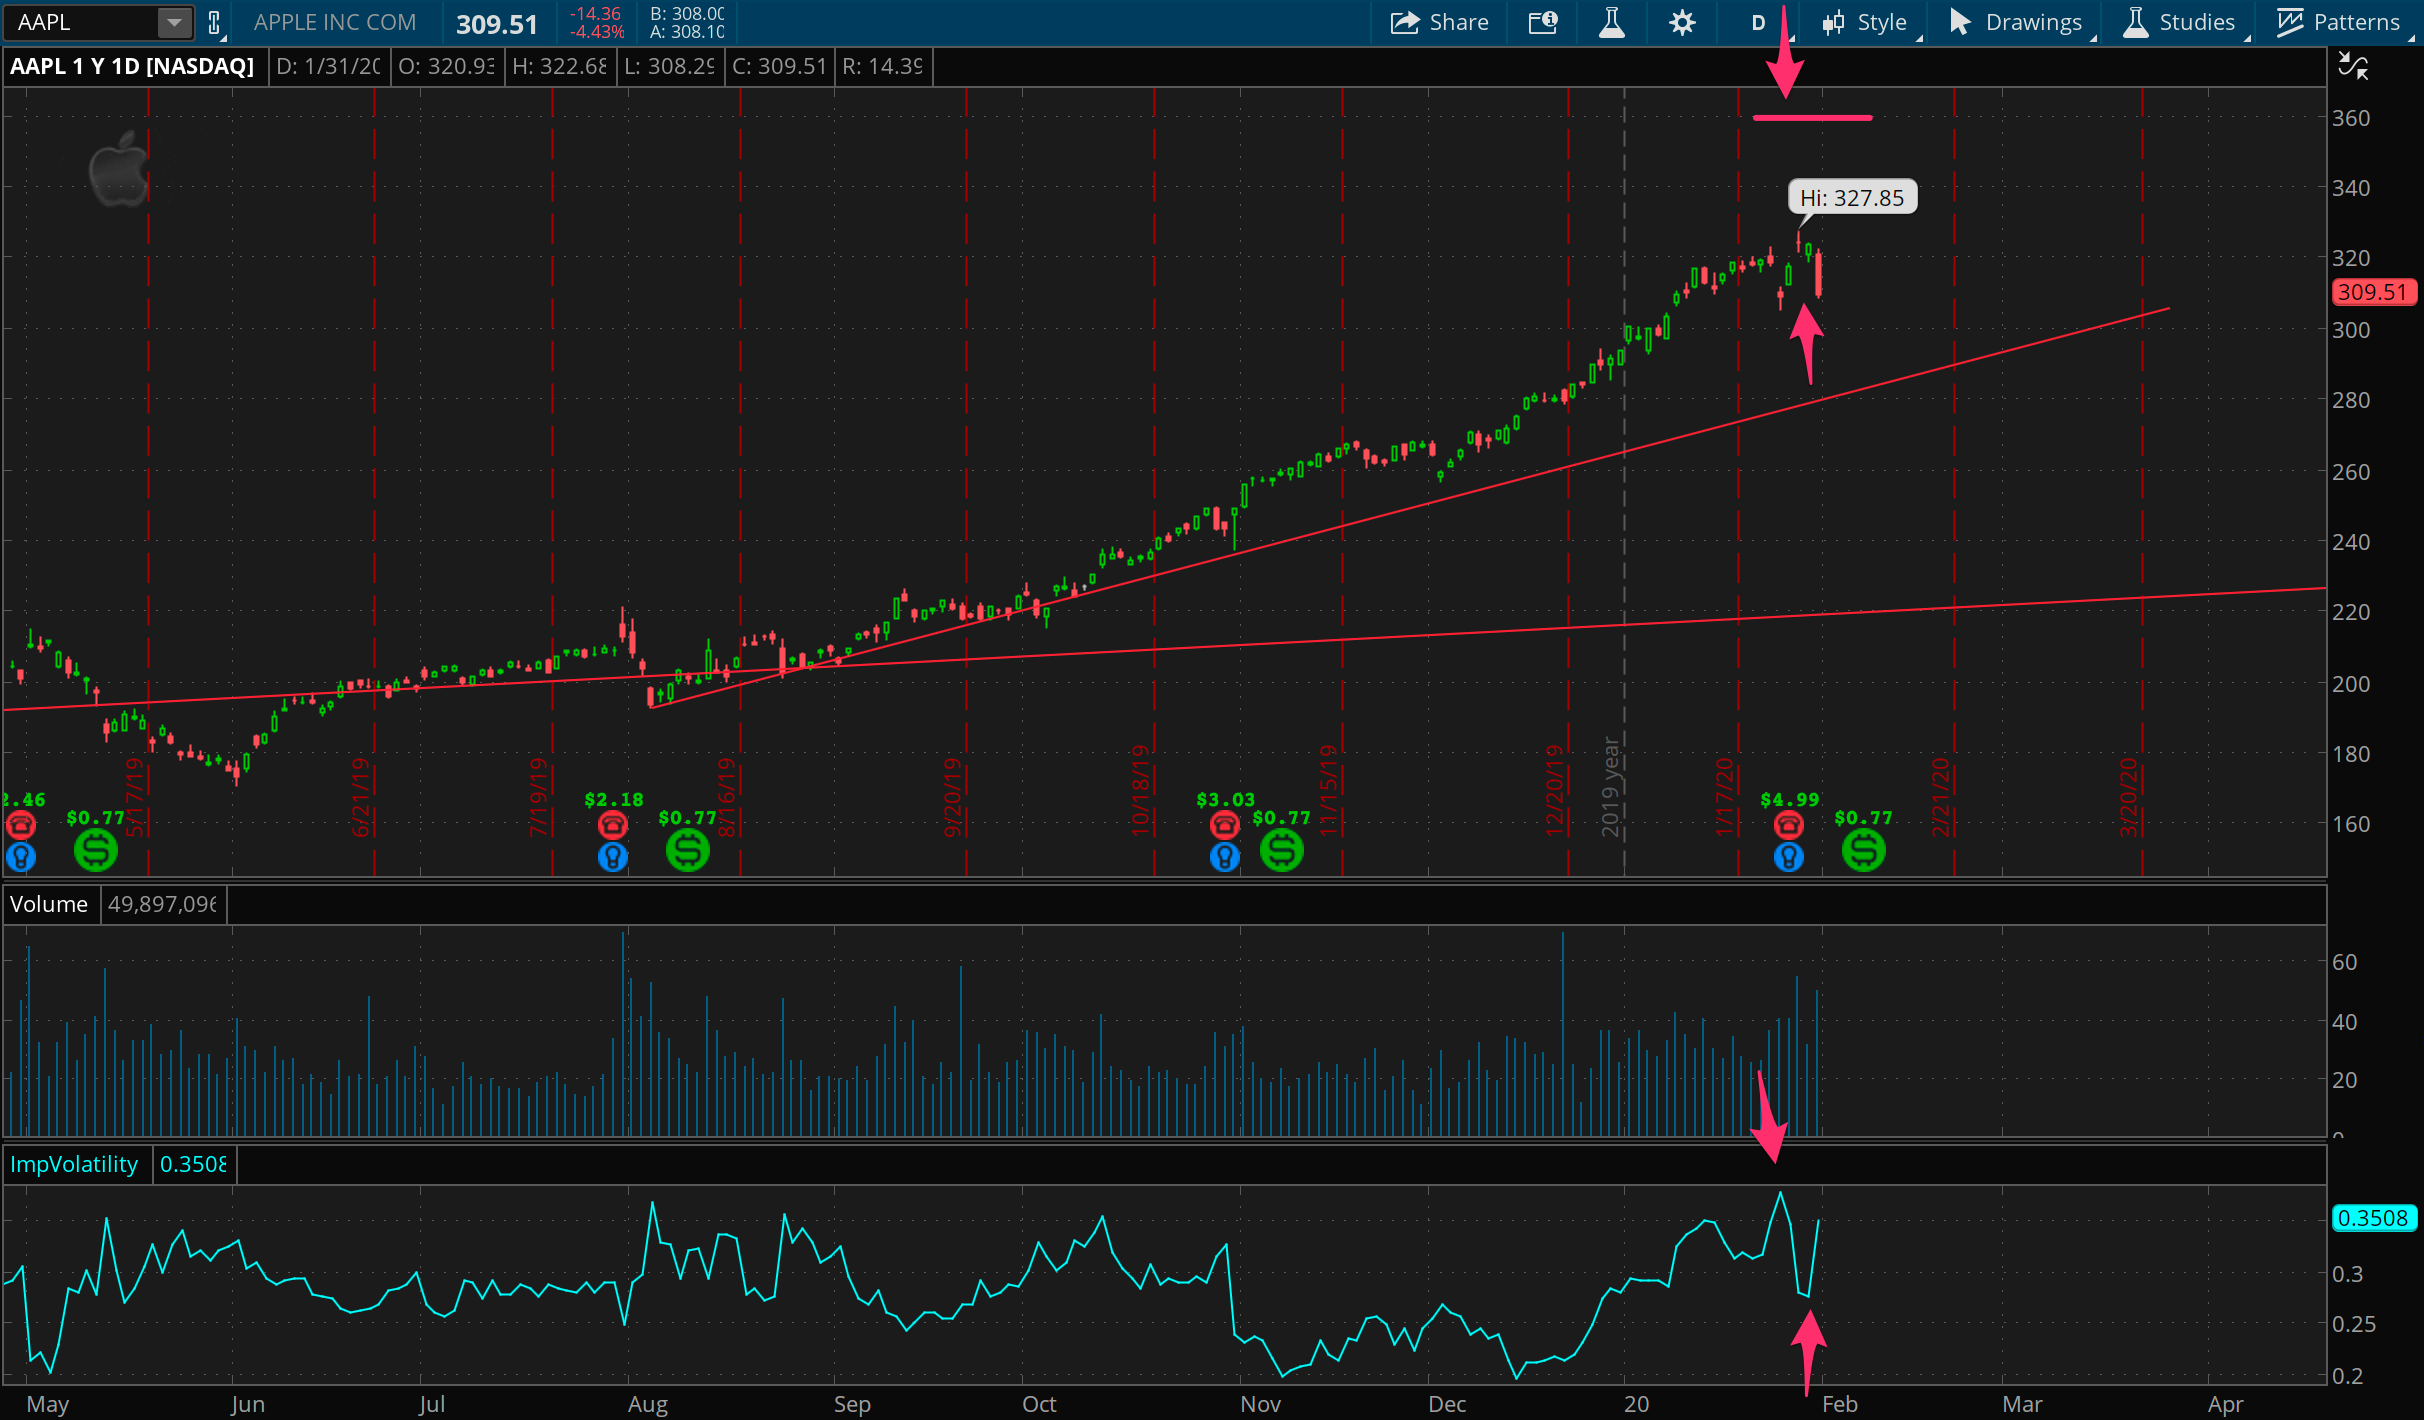
I was itchy last week to reload on some far out of the money calls in AAPL, and I did just that leading into earnings this week. Even though they had an earnings beat, so much IV came out of the options, they were still a quick win for around 50% return on capital. I may go looking into put spreads here if AAPL tanks under 300 quickly.
SQ
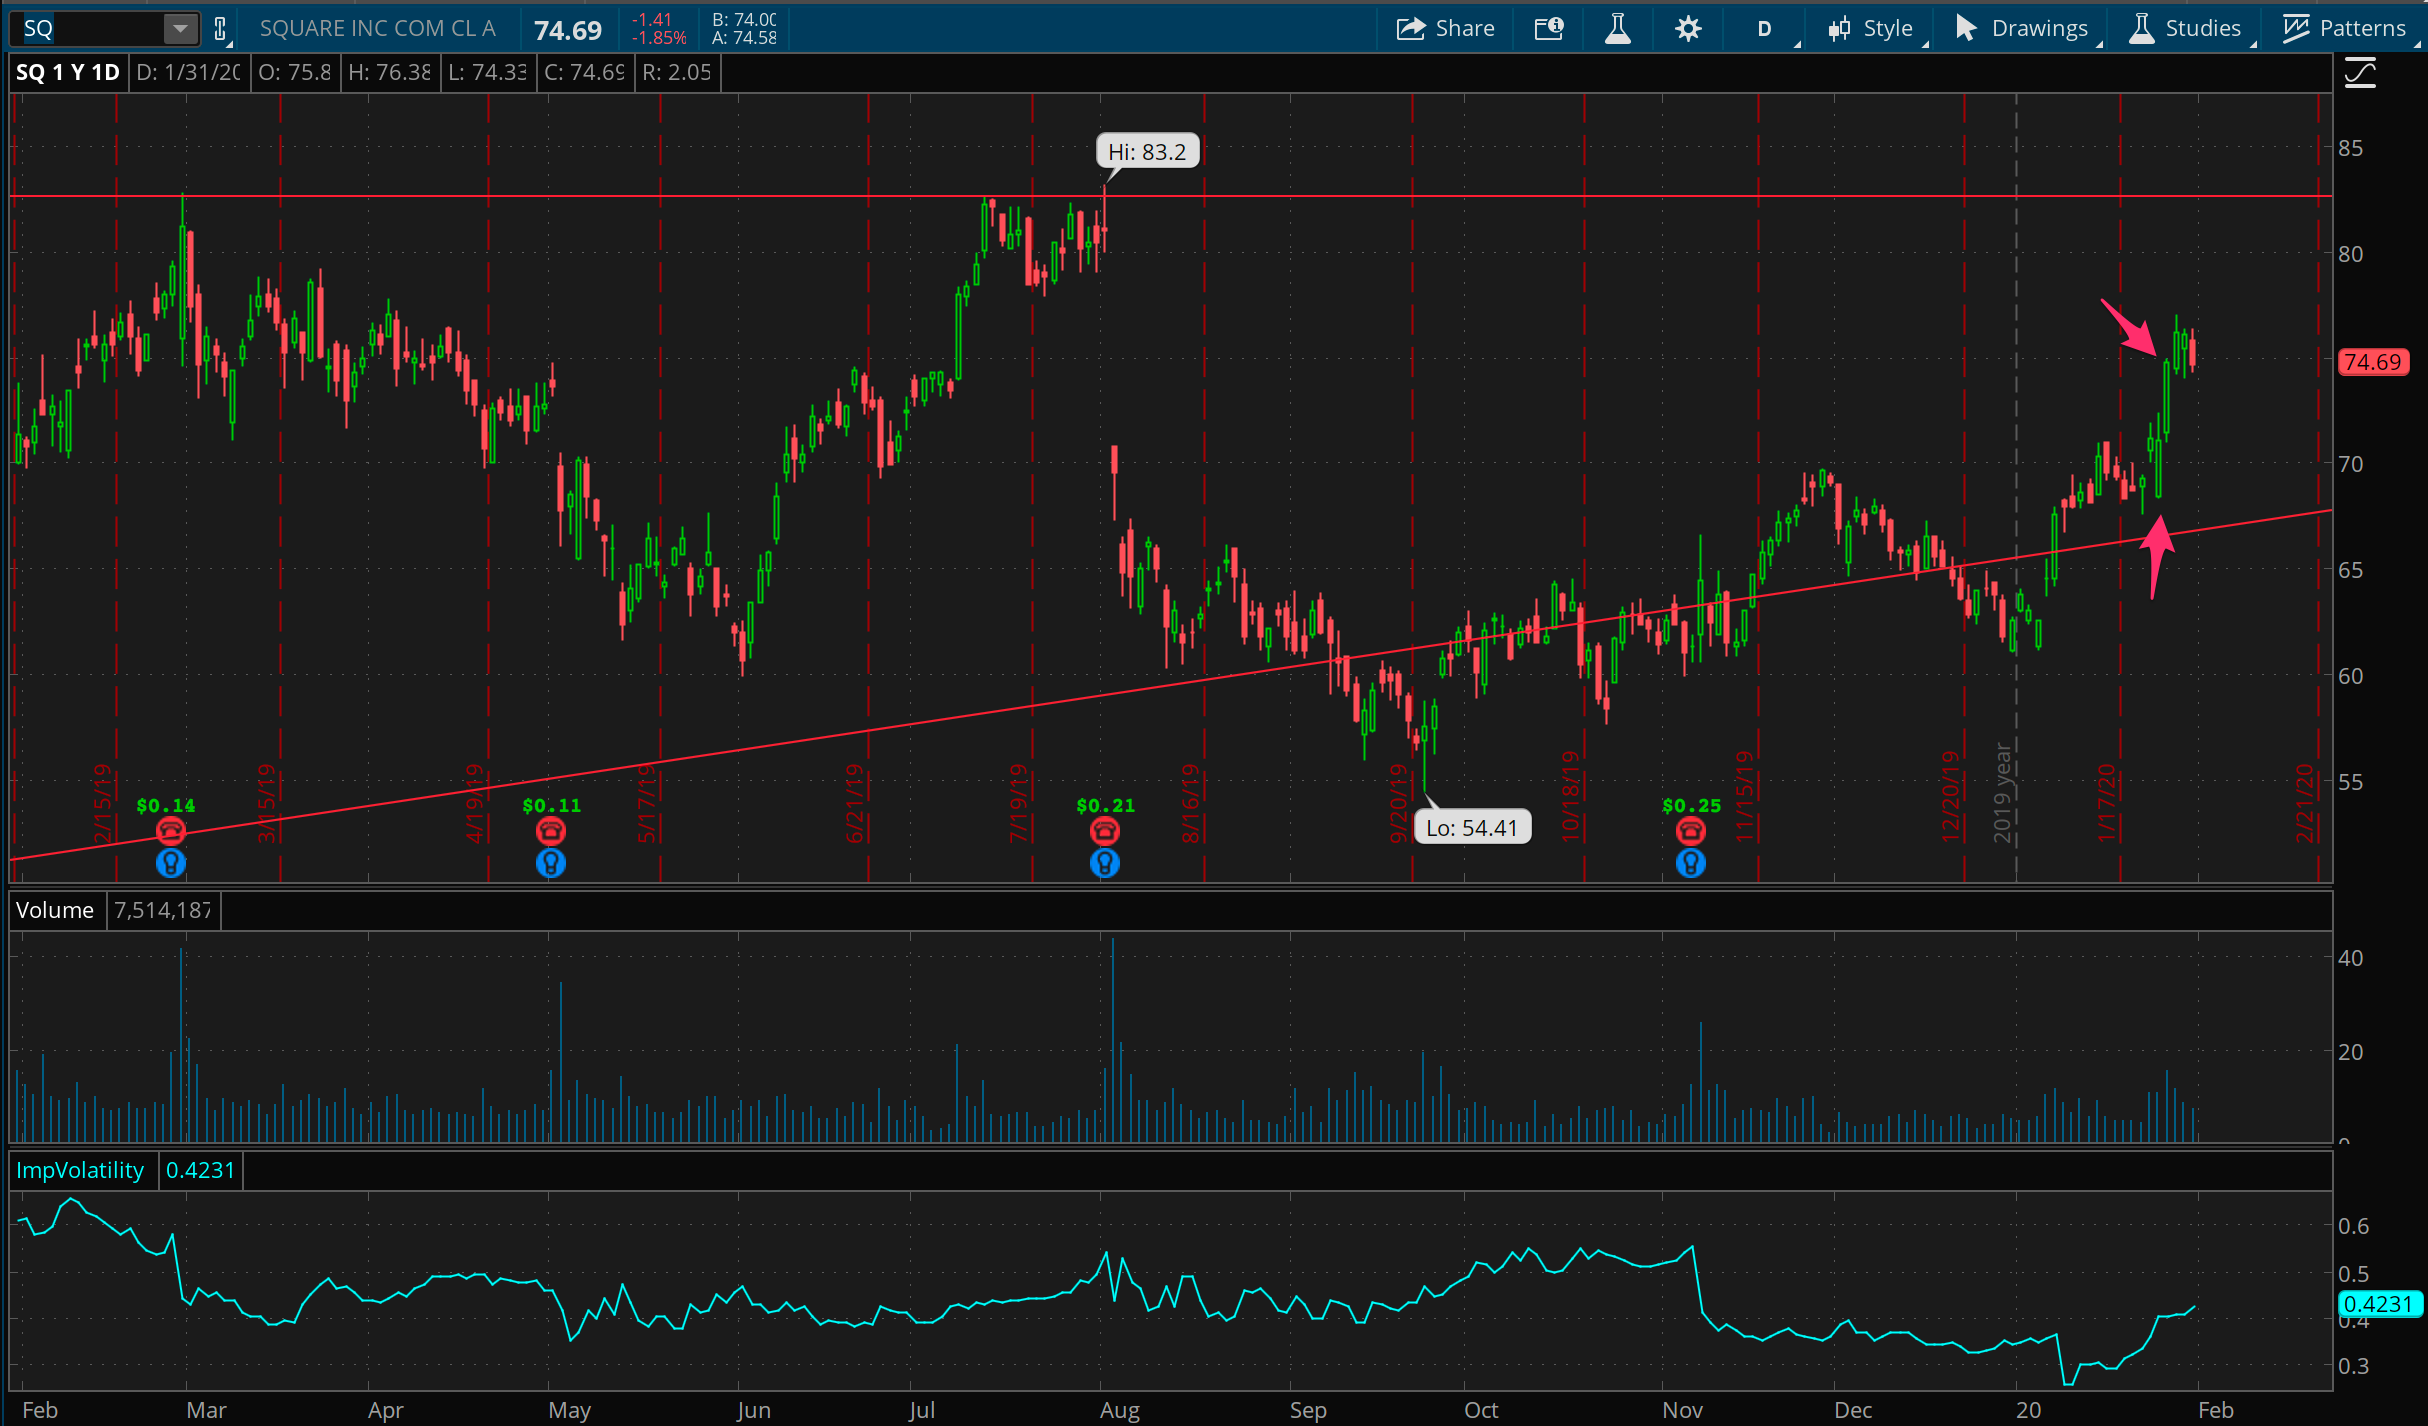
Square has been bouncing around an upper trend for months, and seemed eager to bounce higher from it after lurching above during mid January. This felt like a relatively low risk play to buy some upside calls and see if it would make a run for 75. That happened sooner than expected and got out of this at a quick win of 50% ROC.
PYPL
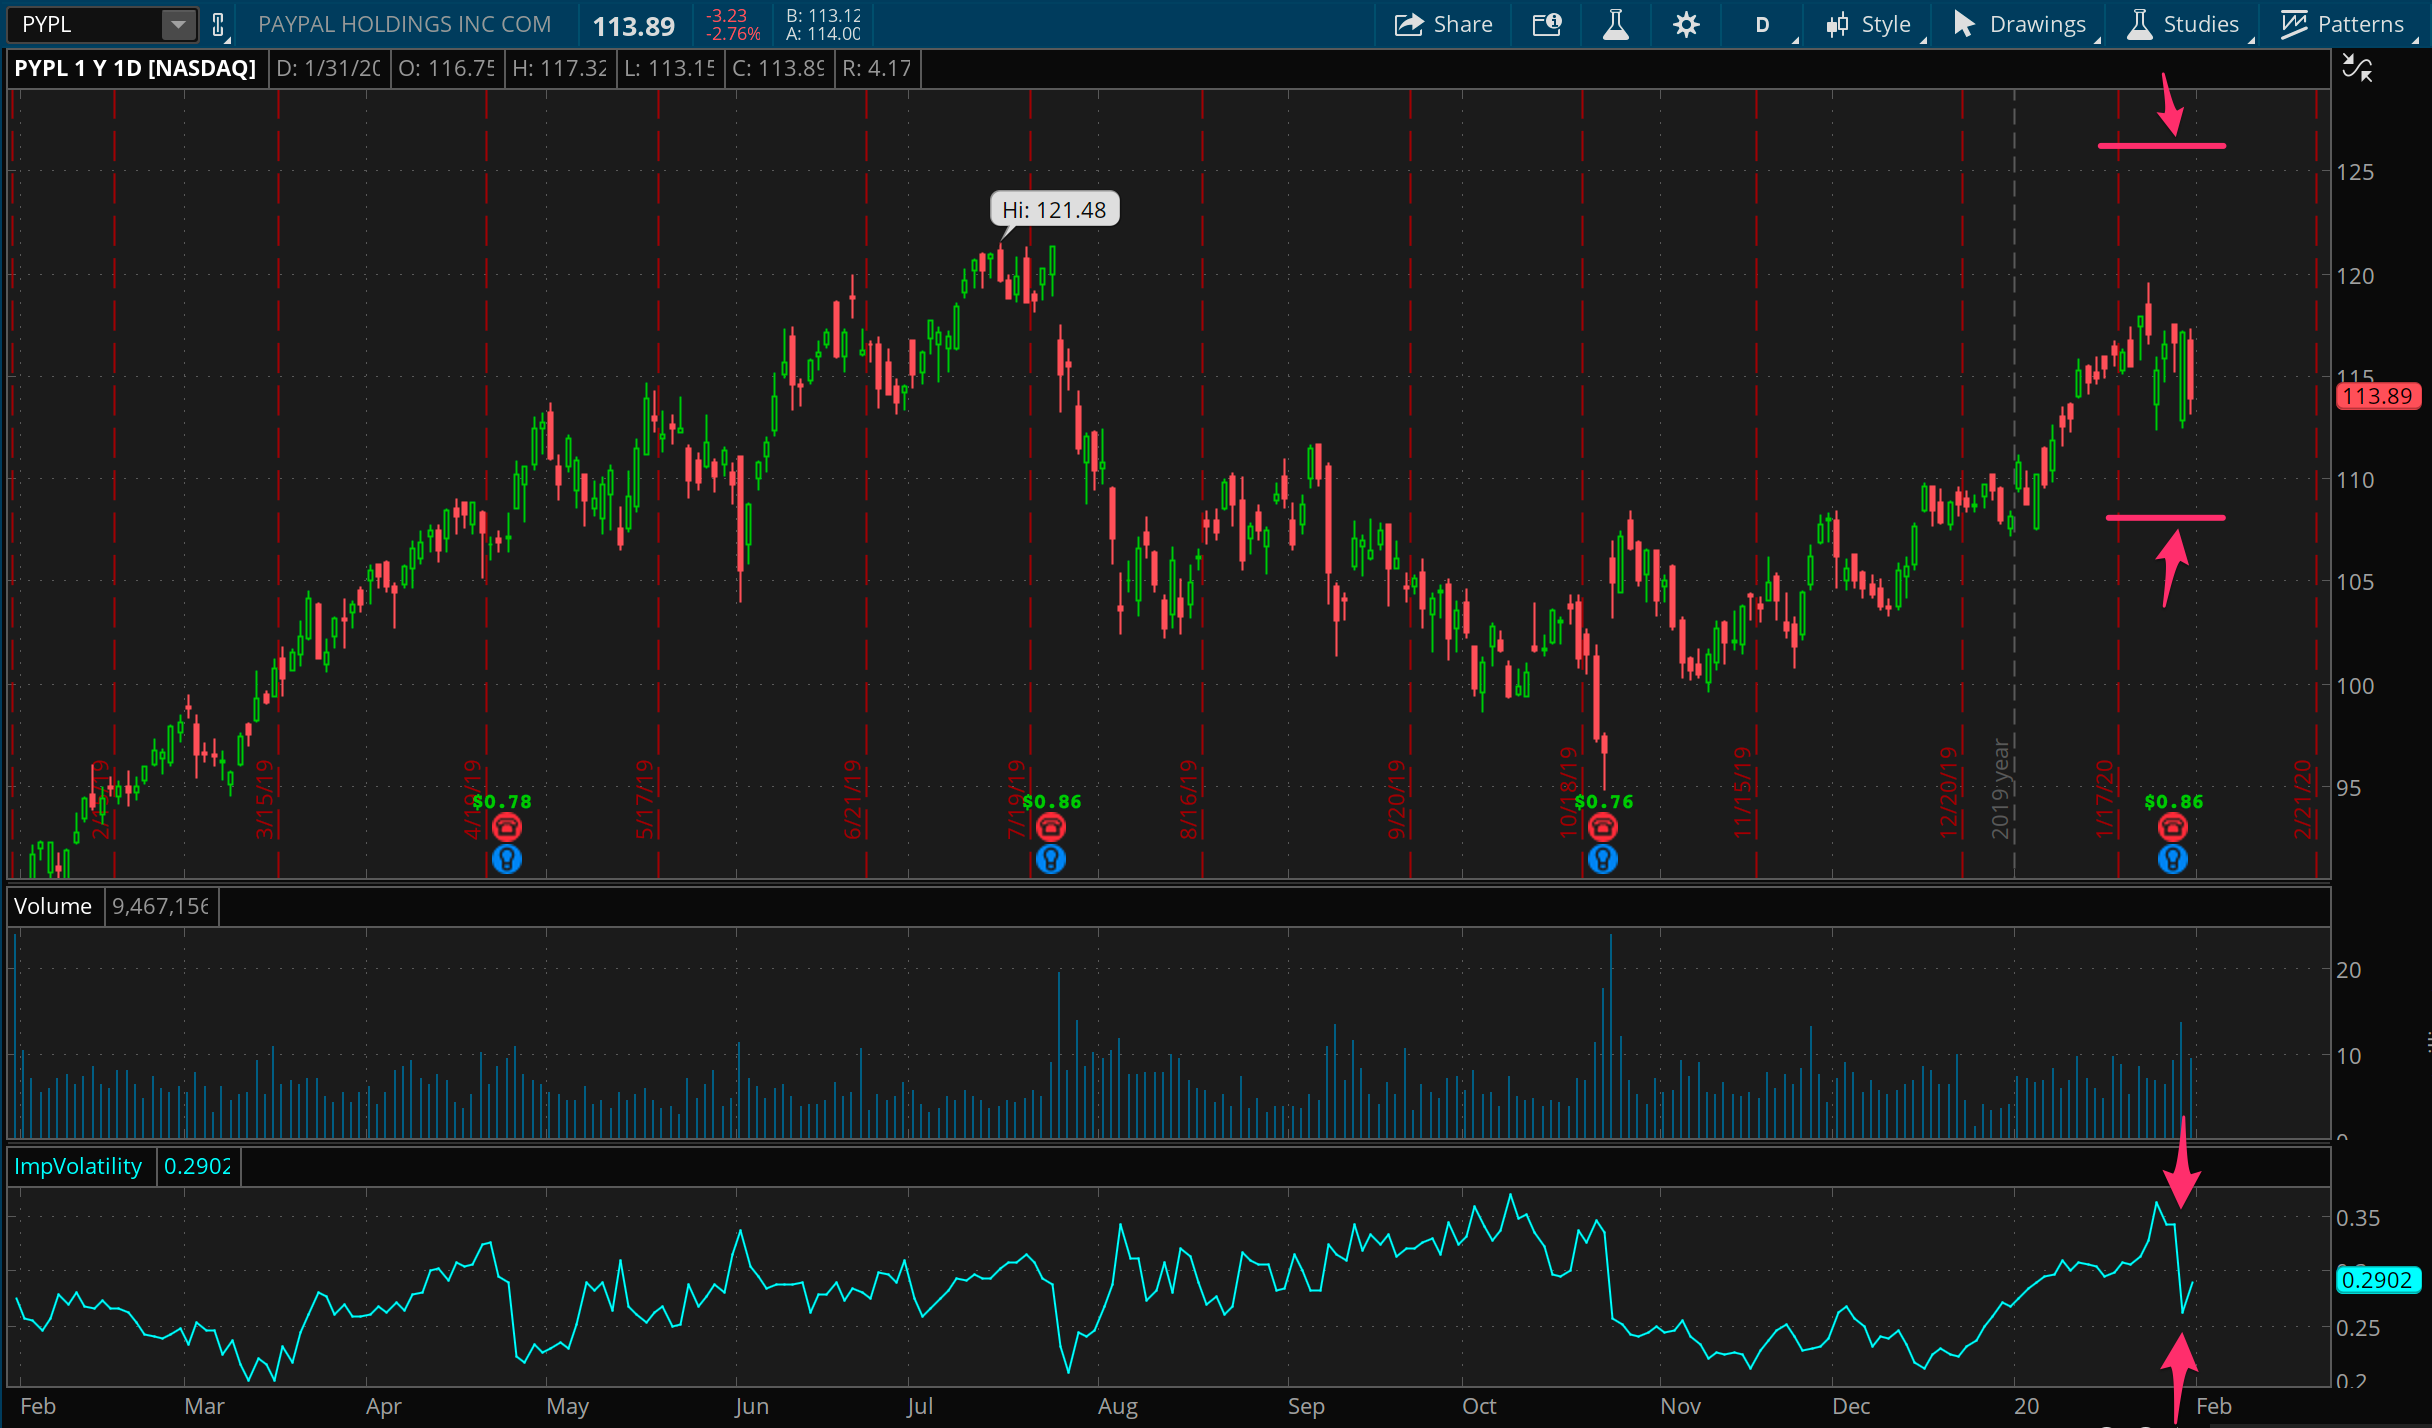
Just a quick example of a handful of earnings plays from this week. Implied volatility is almost always overstated going into earnings, and selling some out of the money spreads can be a fairly consistent way to realize profits from the drop in IV. Try to define risk though, as these moves can and will go outside of the expected range every so often. (See also: AMZN)
TSLA
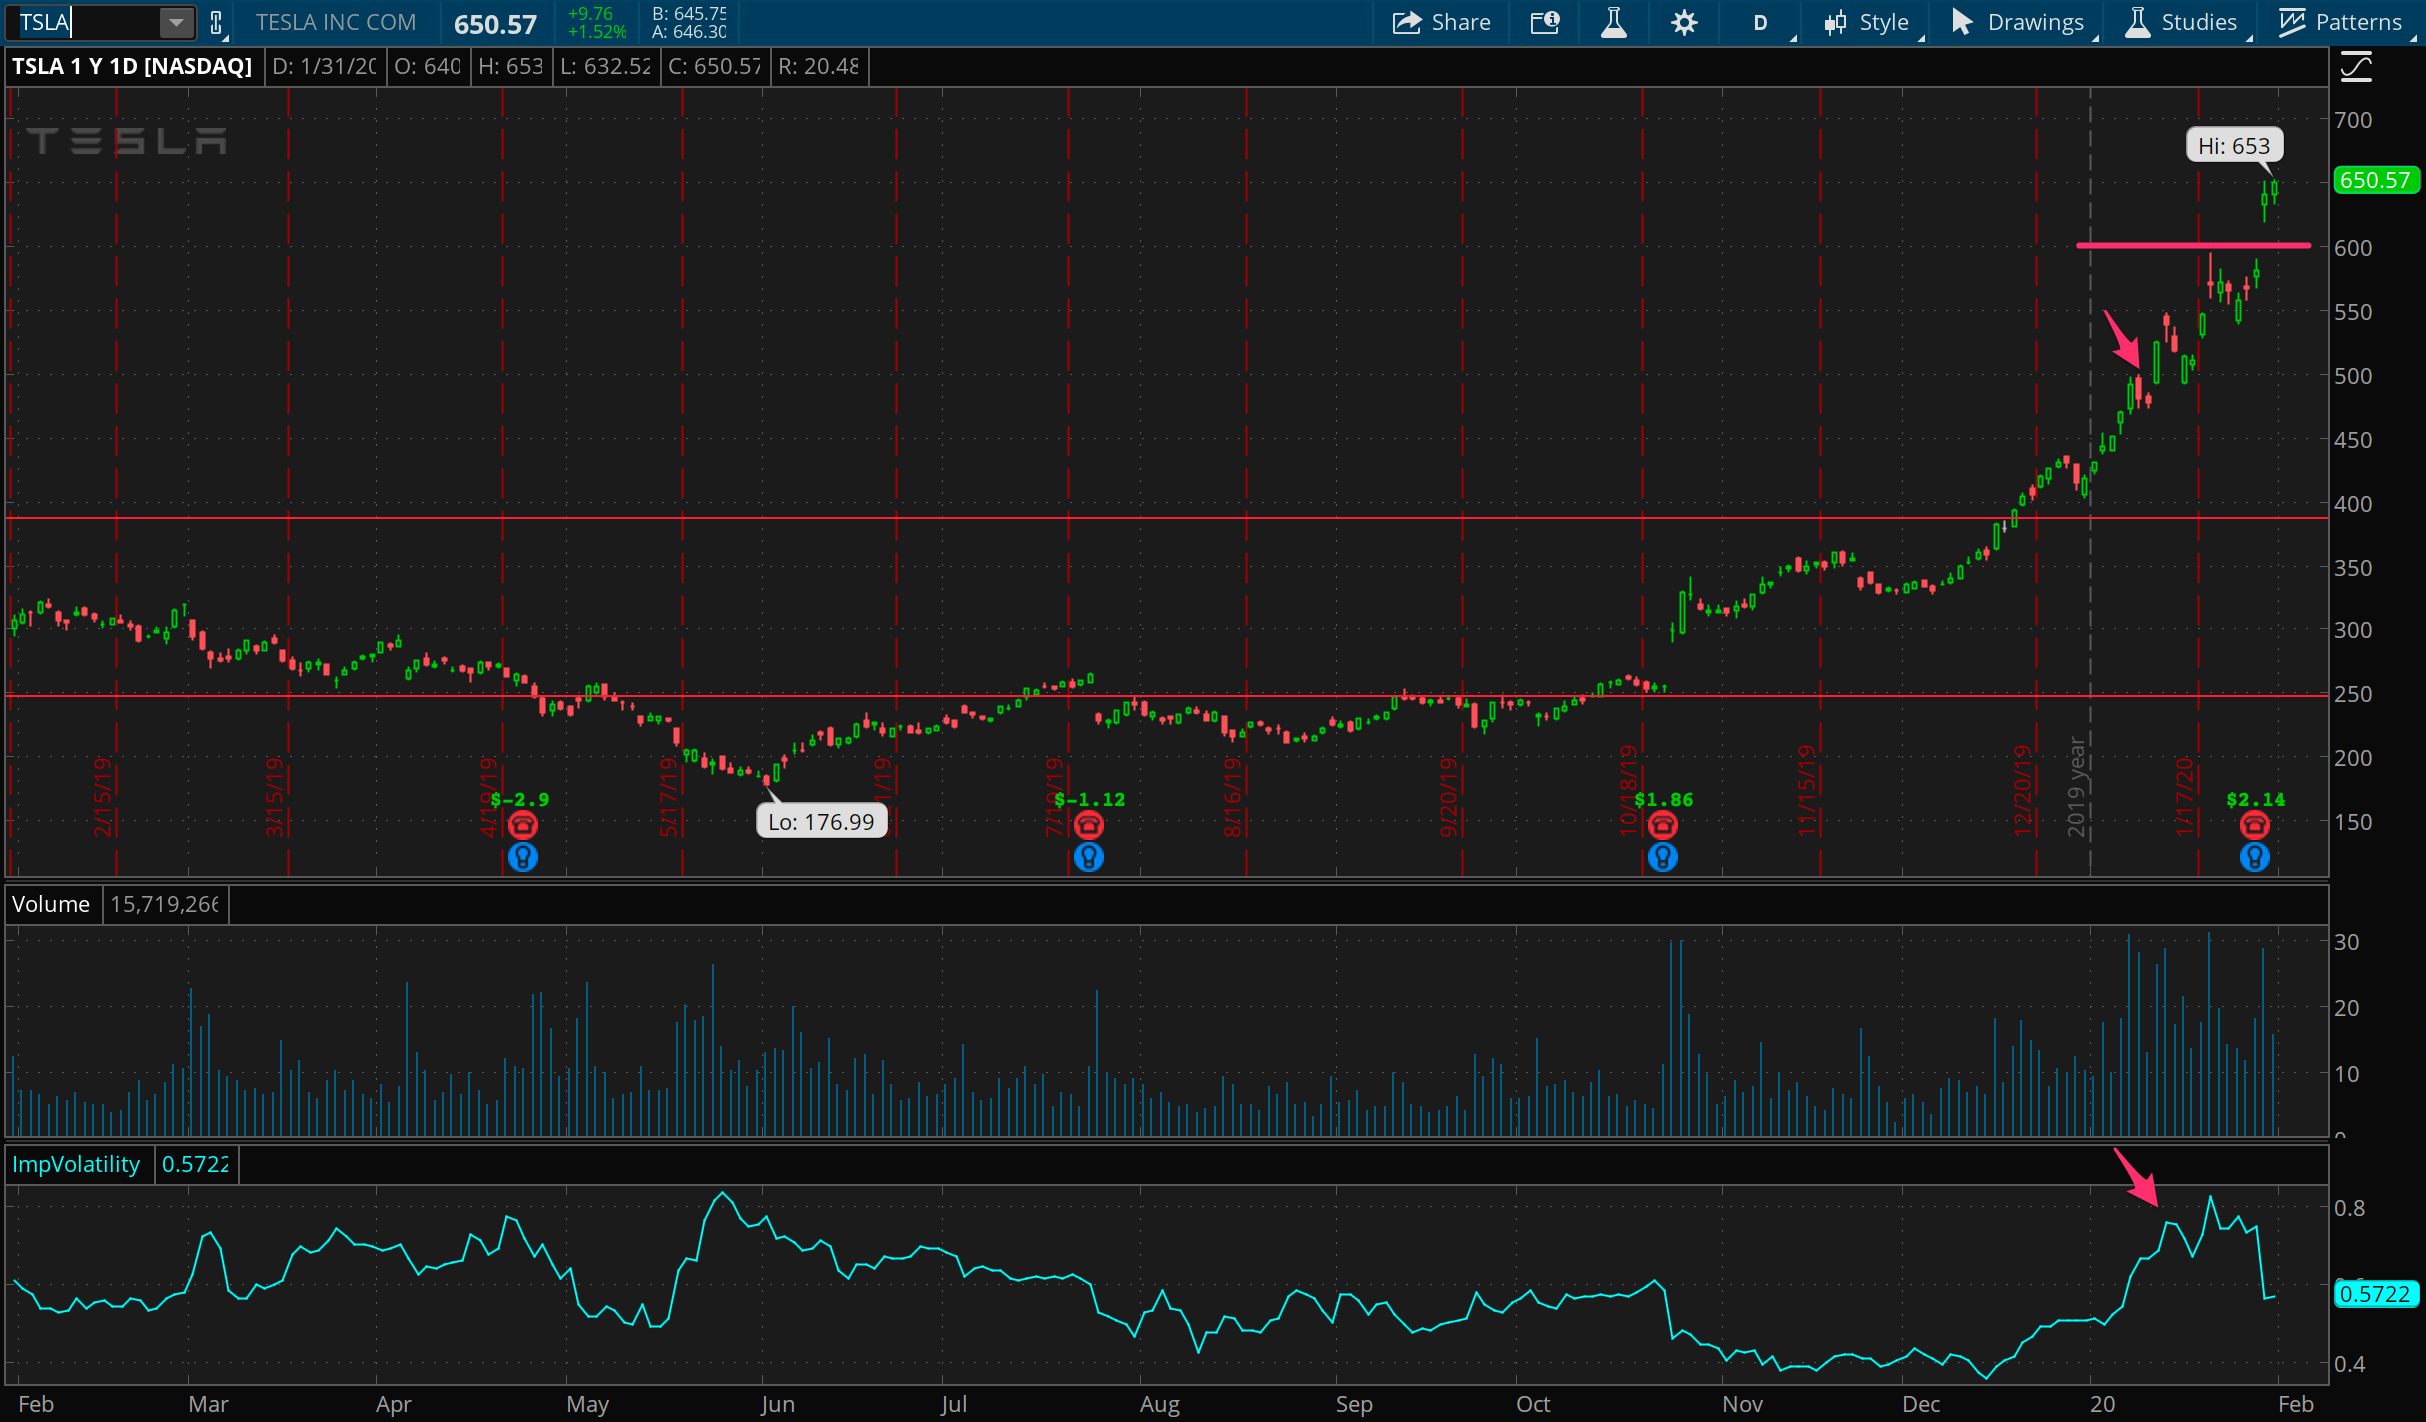
Tesla is a beast. I’m sitting tight in some call spreads that I thought were easy money back when the stock was still under 500. This could be a max loss trade, with my only hope that the optimism is reigned in slightly in Tesla given the China pause.
AMZN
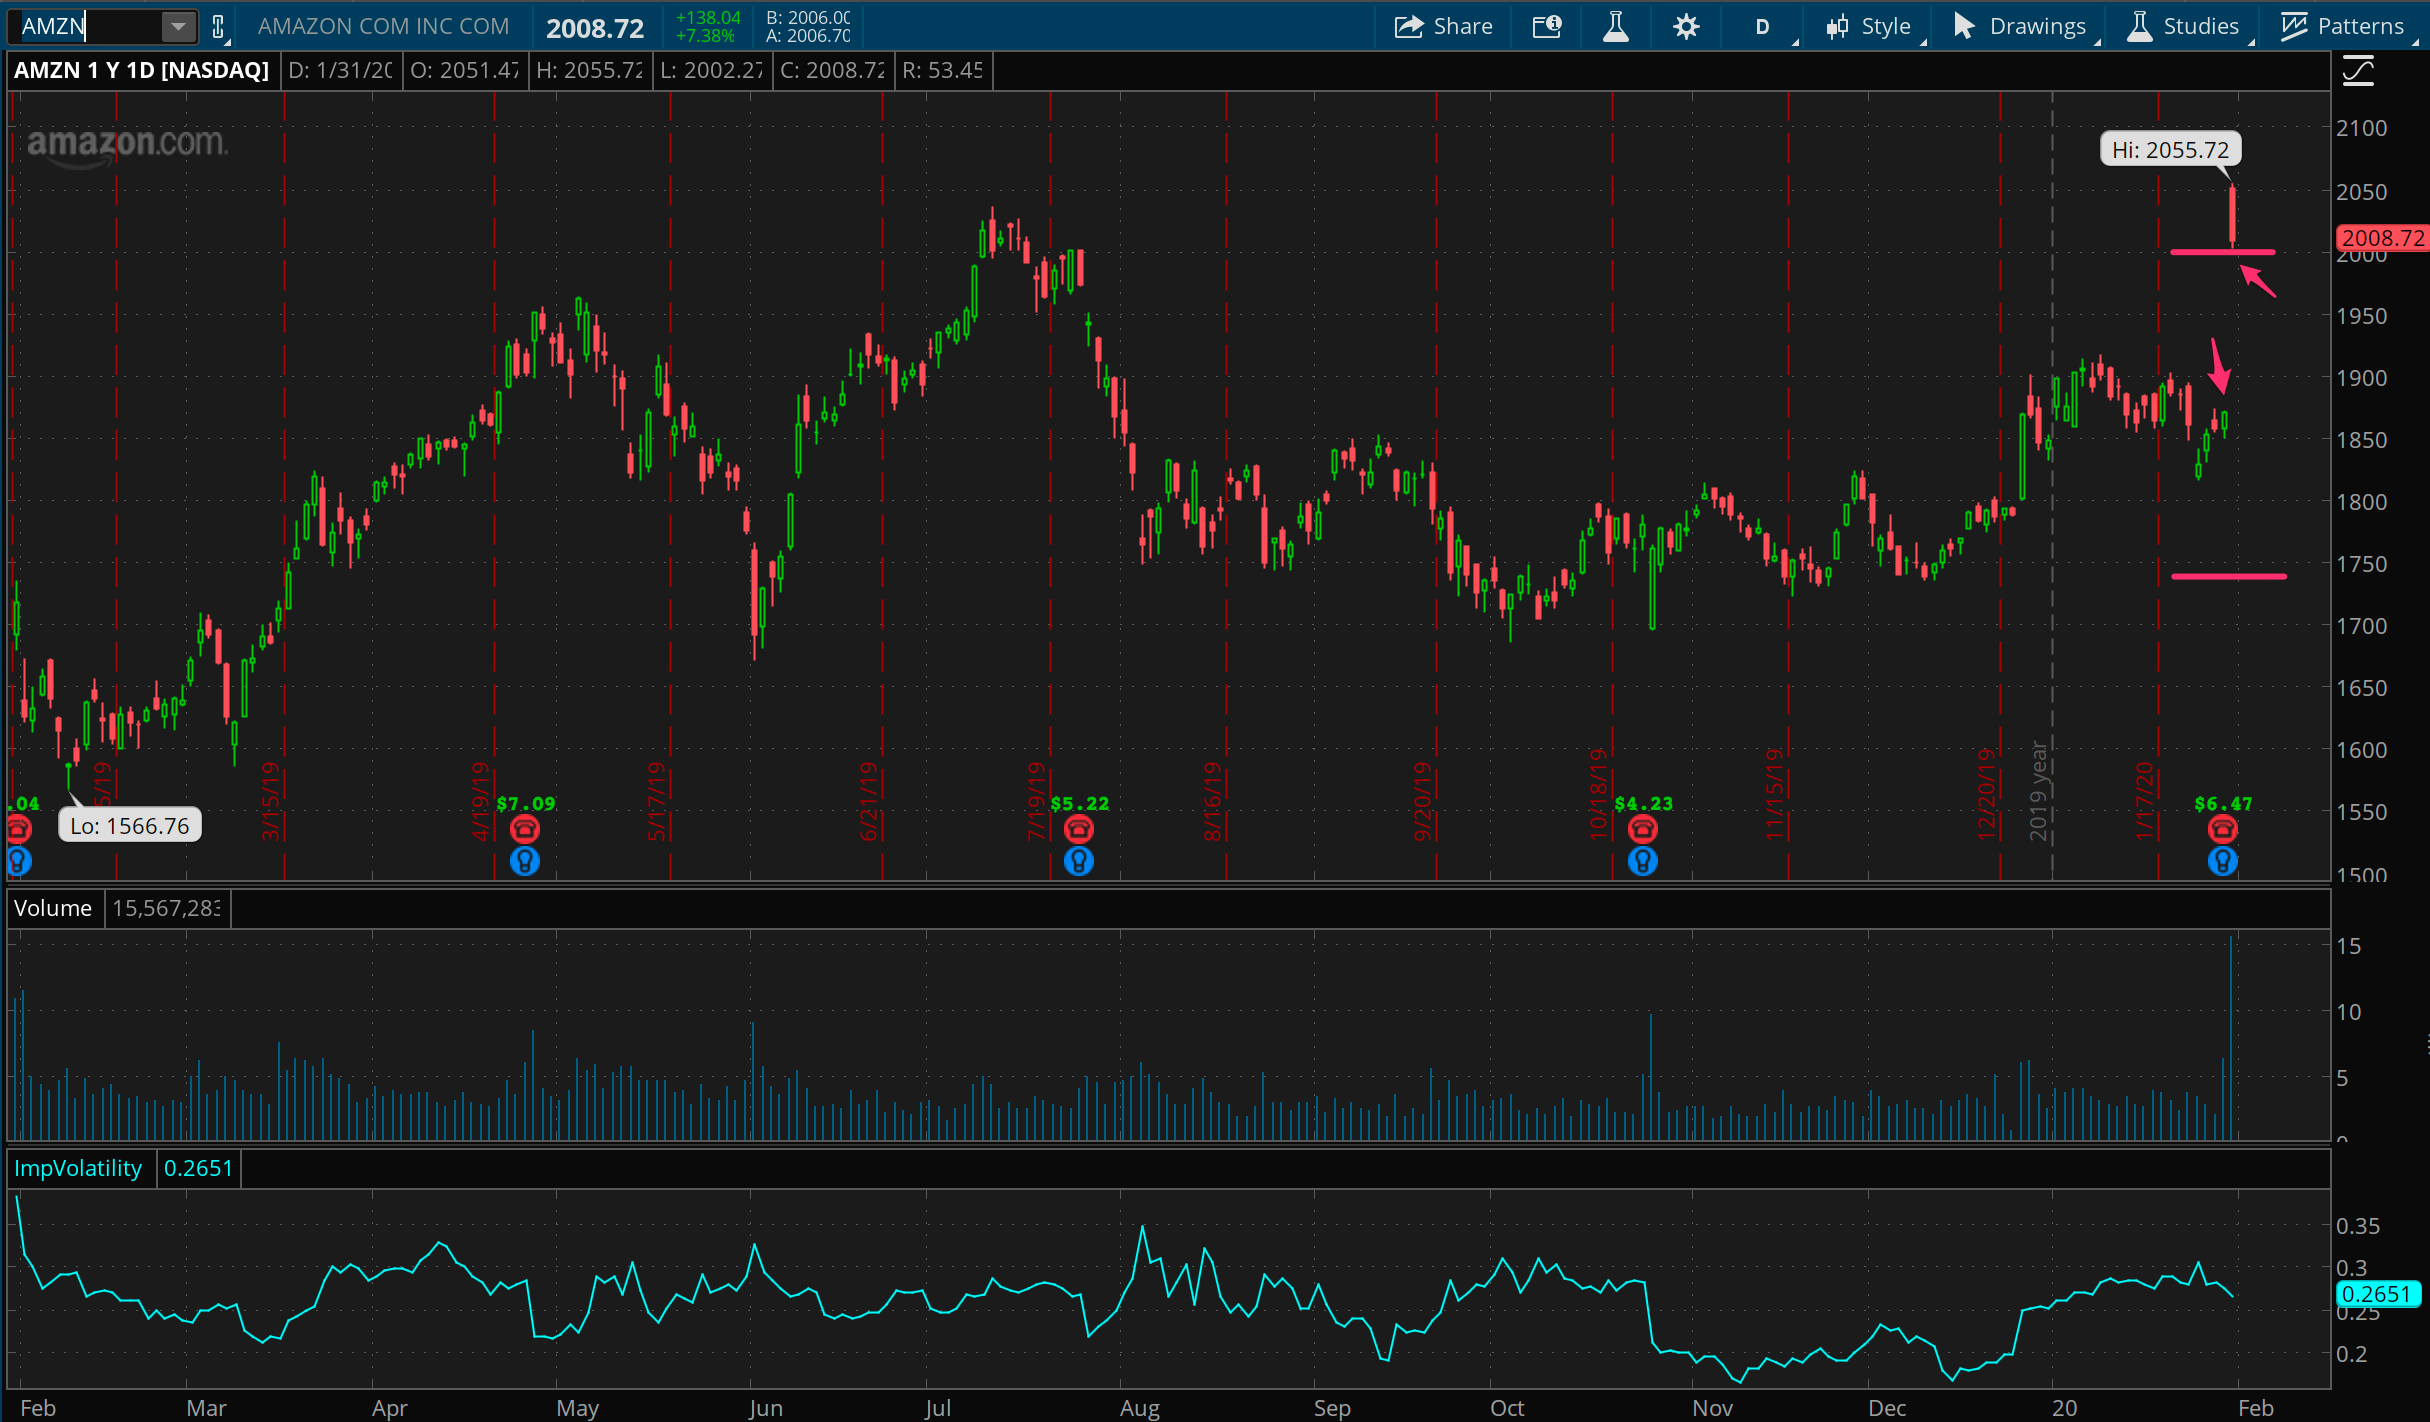
And now a cautionary tale about selling options into earnings. While a big majority of earnings price moves stay in the expected range, you will definitely see these outsized moves from time to time. That’s why you should always define your risk, especially with large stocks like AMZN.
ROKU
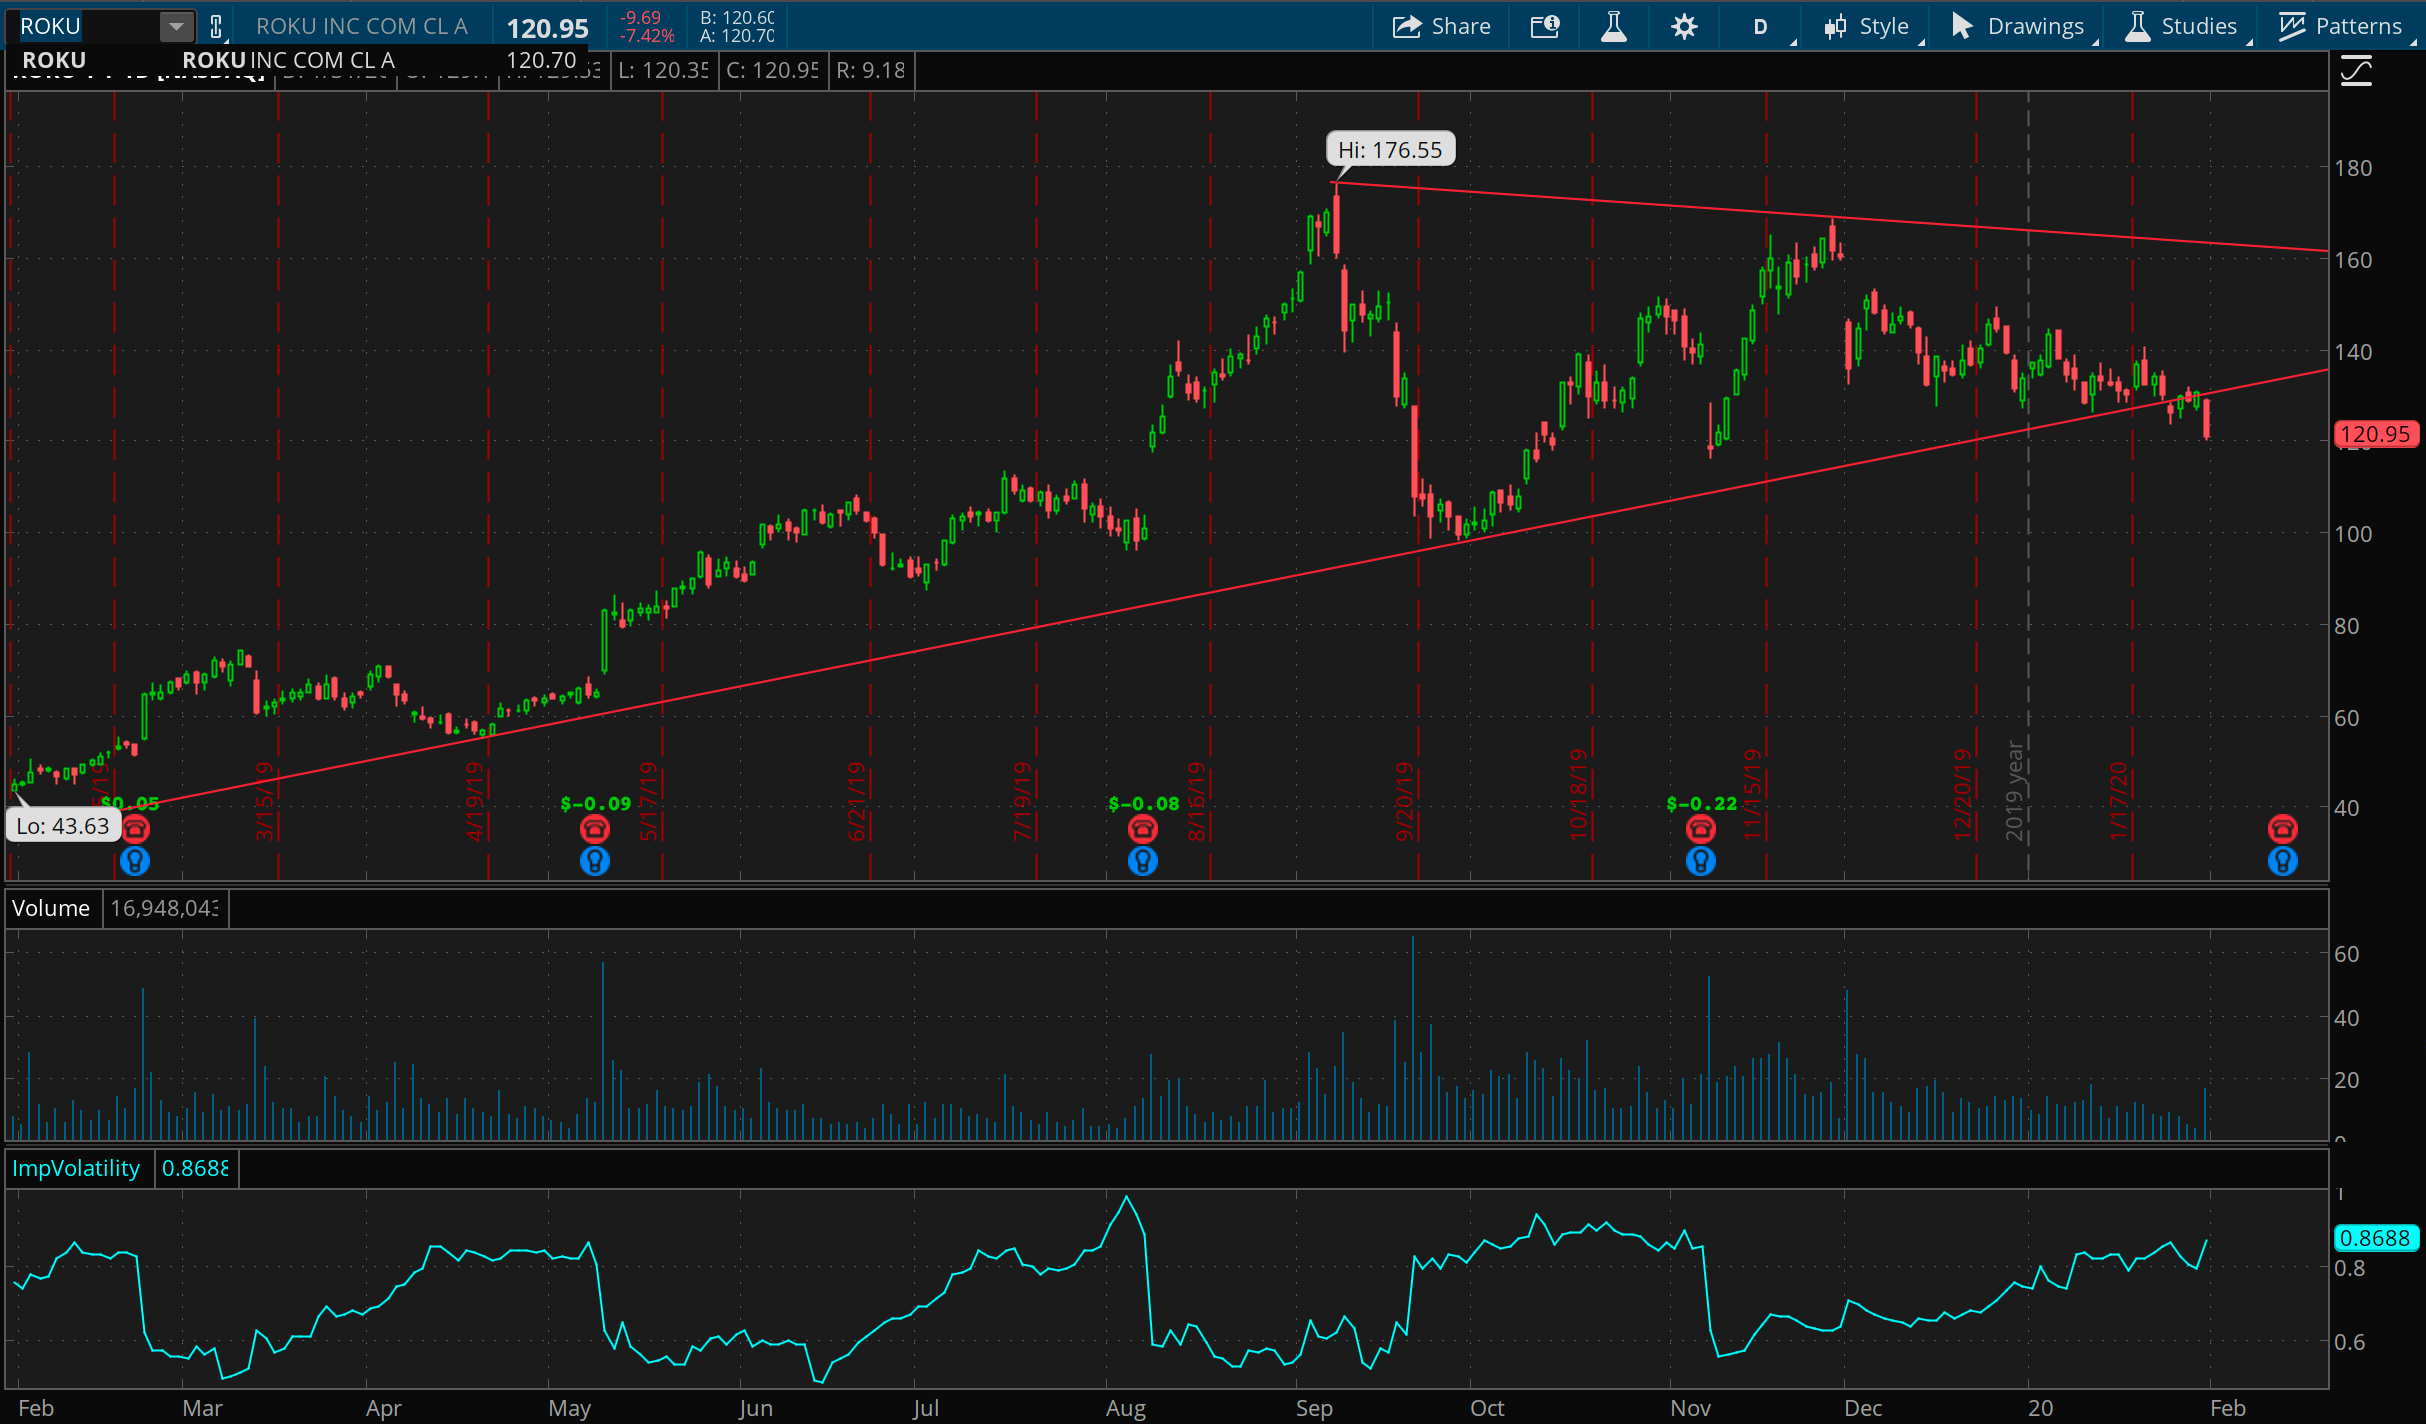
We’ve been looking at ROKU for a few weeks now, and last week it seemed well suited for a bounce off of support. Instead it appears to have fallen through that uptrend and this is likely signaling some higher volatility in ROKU in the near future.
BTC
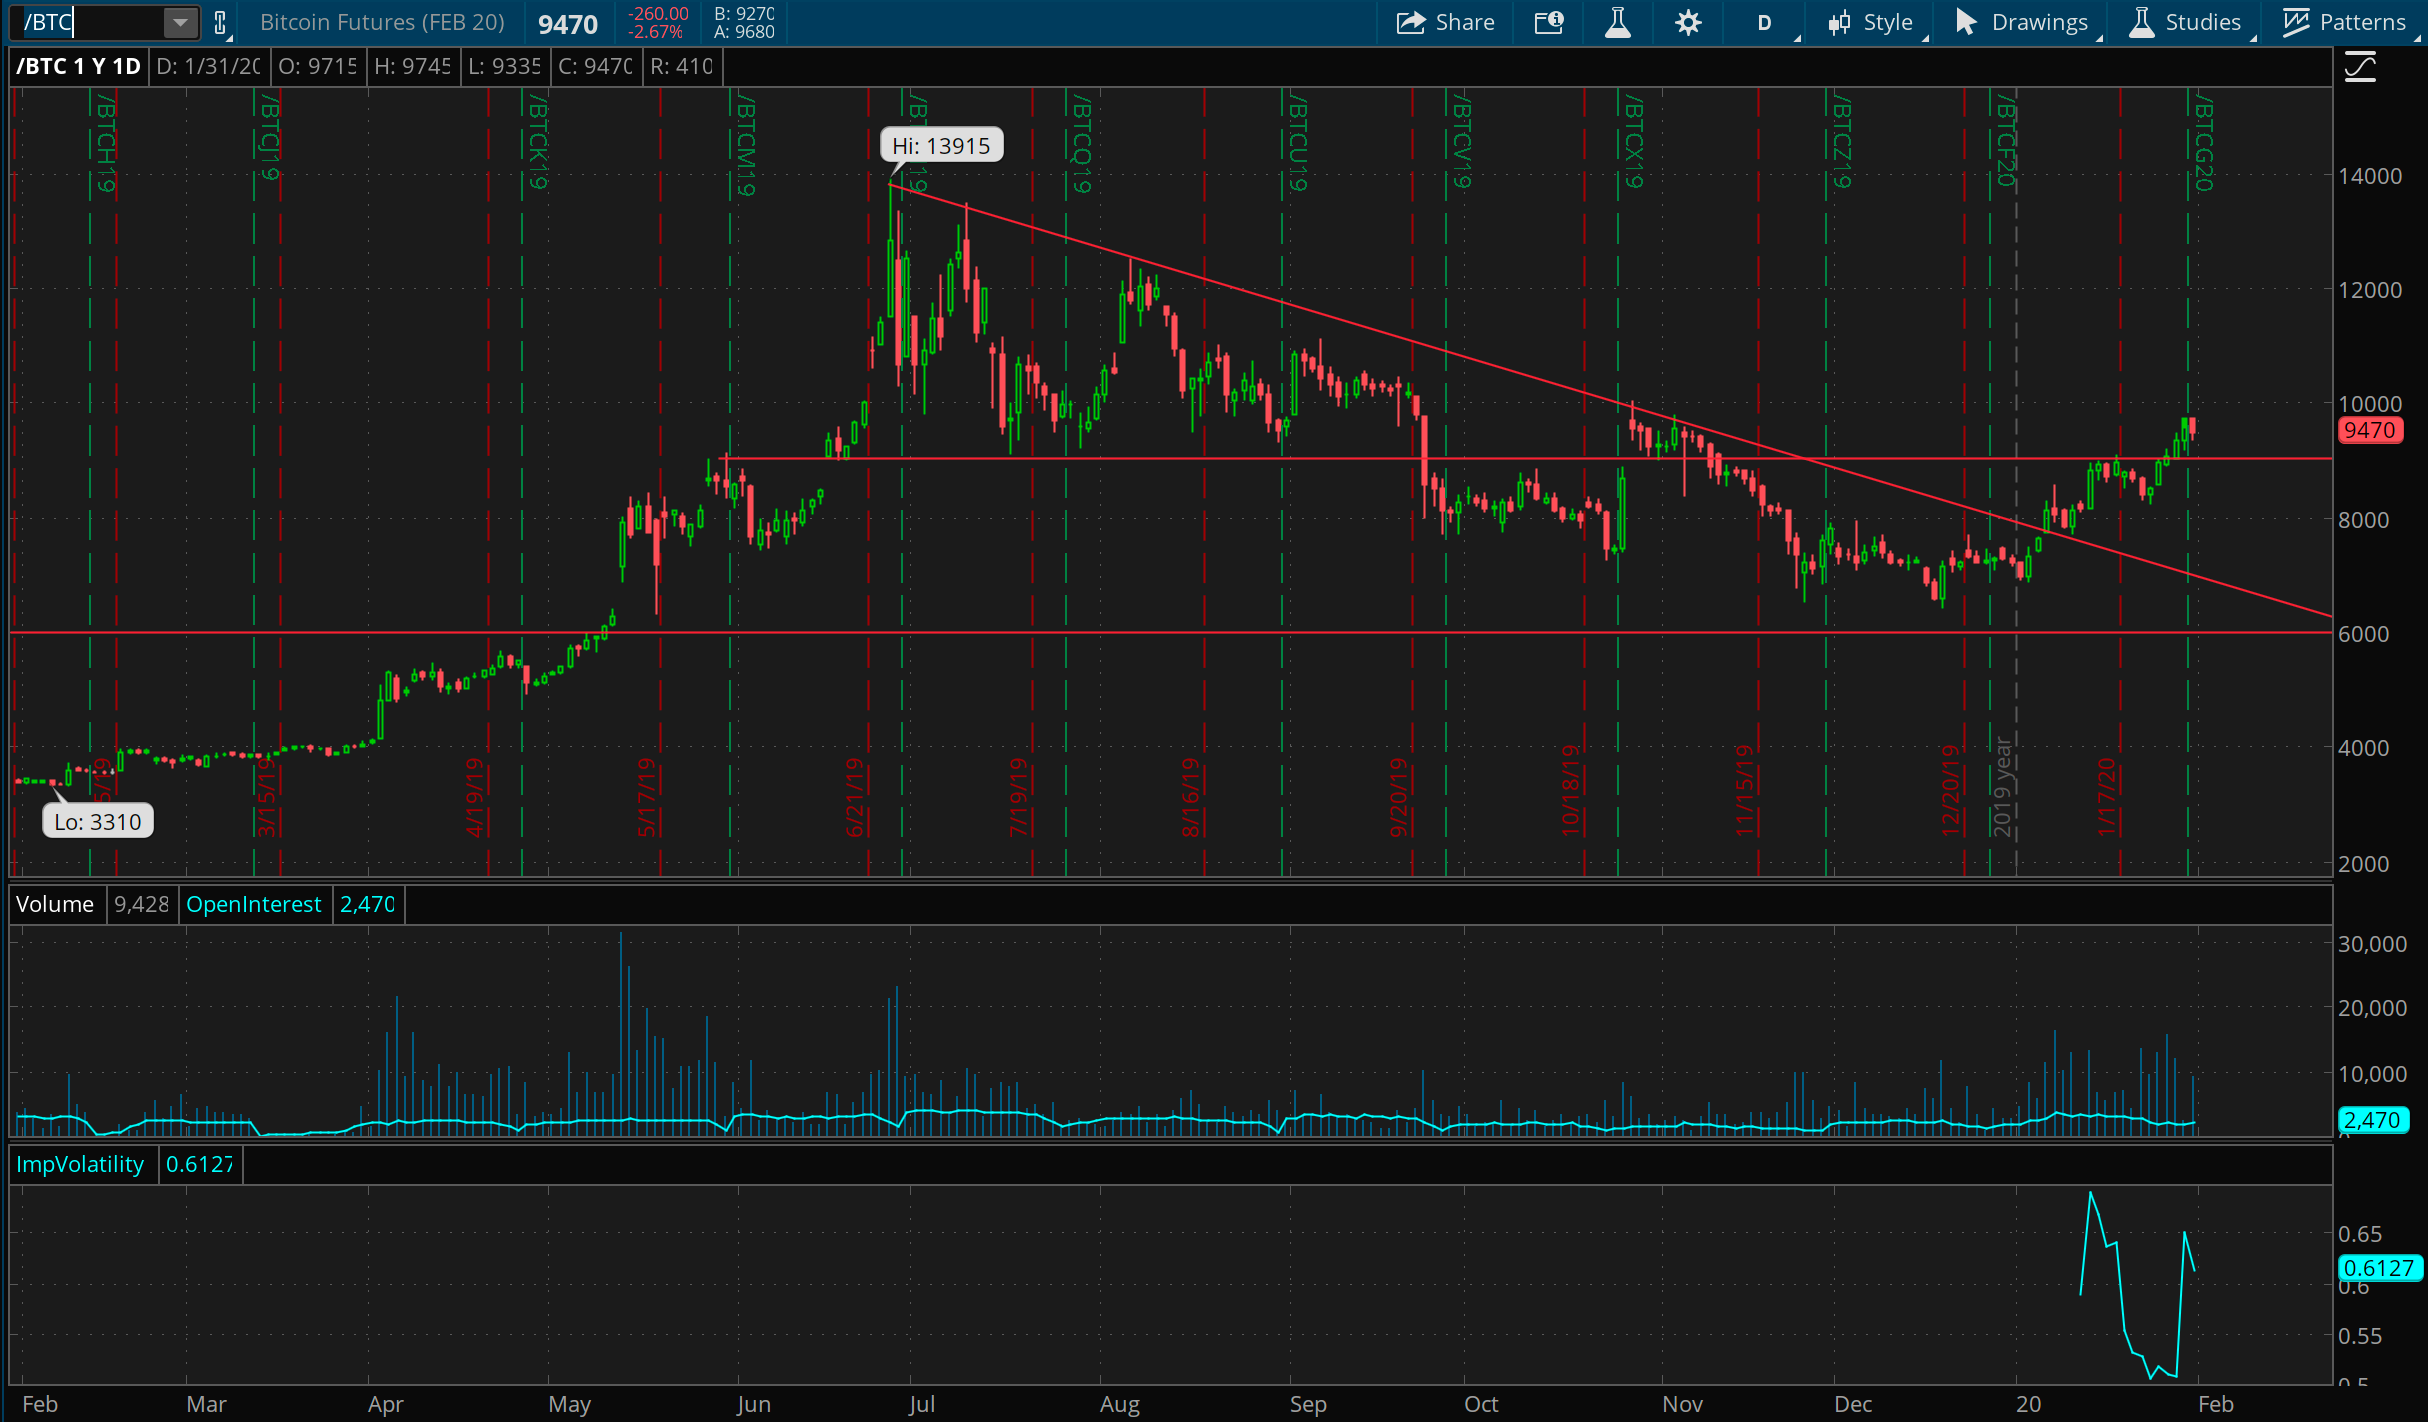
Last week, we looked at Bitcoin’s failure to rise over the key 9000 level. That level has served as both support and resistance for prices for nearly a year now, and it likely will continue that roll going forward. This feels like a more methodical and stable rise over 9000 than the jump we saw in October. As such, I think Bitcoin futures are likely to start playing in the 9000 - 12000 range in the coming months. Looking to get long around these levels.
The chart of the week
This week, Federal Reserve chair Jerome Powell said that asset valuations did appear “somewhat elevated”. This week’s chart of the week comes from this @NorthmanTrader tweet that beautifully exposes how underplayed that statement was. It’s hard to argue with the following chart, which shows total market captilization vs US GDP, and seems to show that indeed, we are clearly at all time extremes in valuation.
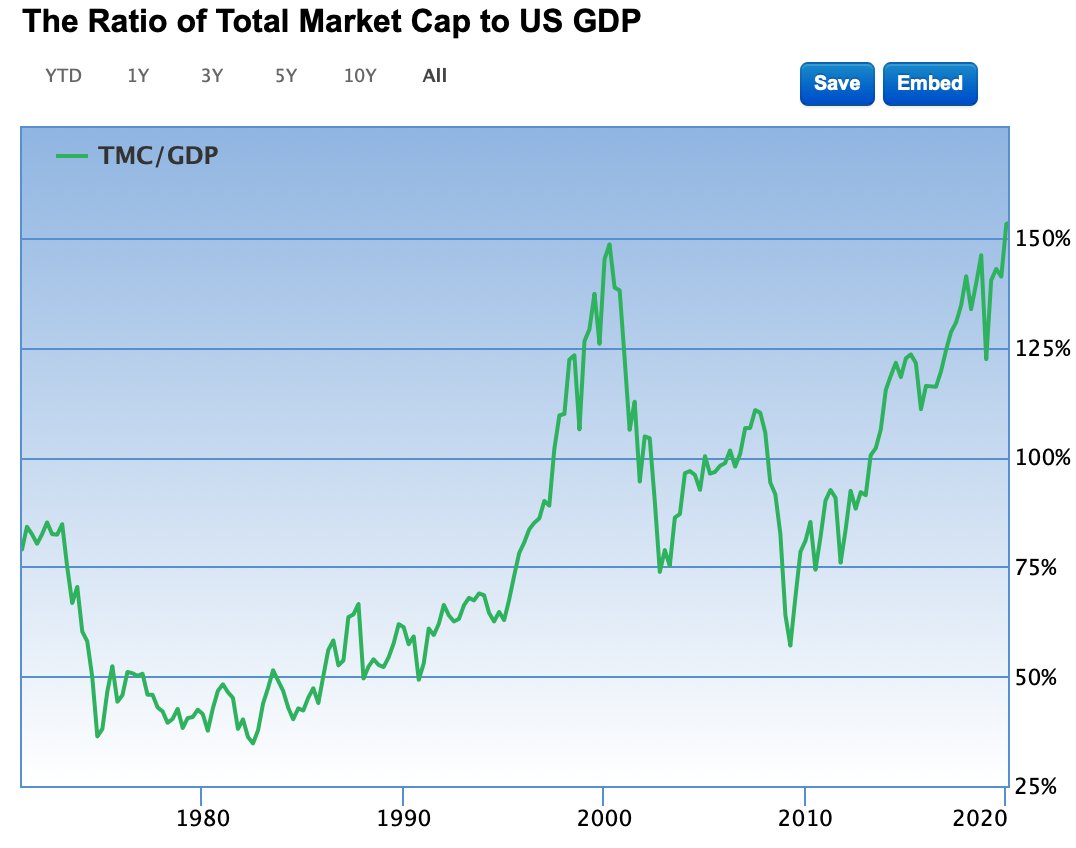
Feeling like a broken record, I’ll say it again. Not since 2000 folks. Here we go!