
No contagion, not QE, everything is fine
It was a short week this week for U.S. markets, but it didn’t slow down the rest of the week. Without a doubt, the story this week has been the evolving coronavirus outbreak. Countless articles and fintwit posts have been tracking the spread of the disease.
It’s been an effective distraction from last week’s big story on the Fed’s involvement in the repo market, though there has been some continued attention on it from news sites and the twitter-sphere alike.
Meanwhile, plenty out there continue to marvel at the market’s rise, and have been wondering who’s actually doing the buying?
Whoever they are, Friday was selling. The fact that the S&P 500 was only down 0.9% on the day and it was the “worst decline since early October” should tell you something. This market has been on a clean and steady rise since October. It’s been 71 days and counting since our last 1% move in either direction.
While a 0.9% down day doesn’t really mean anything yet, it is unusual. At least unusual like “the last time this happened was in October”.
Now we await Sunday night…
Oh, one other really interesting thing is this proposal that China’s debt will be responsible for the next global economic collapse. You know, stuff to read before you go to bed. Reassuring, etc.
The Four Horsemen
SPY

Yep, that tiny red bar at the end there. That was Friday’s big move. Anyway, last week’s thoughts stand. Our brains really want to connect the market with the news, so much that we shape the news around what the market does, focusing on good stories for good days and bad stories for bad ones. Deadly virus or no, we haven’t broken the trend, and the Fed is still doing its thing. If we do go into fast and furious crash mode though, then I think 320 and 310 will be places for the market to stop and think, while 300 is the most meaningful support level and line in the sand.
TLT

Last week I called bonds “poised” and signaling nervousness in the market, and this week it finally broke to the upside out of the hedge that’s been in place for months. TLT rose all week, most of it with the market, but it certainly acted “normal” in it’s rise on Friday against the market’s fall. I’d expect that to continue if we happen to see more selling in equities. Around 145 feels like the next meaningful resistance.
GLD
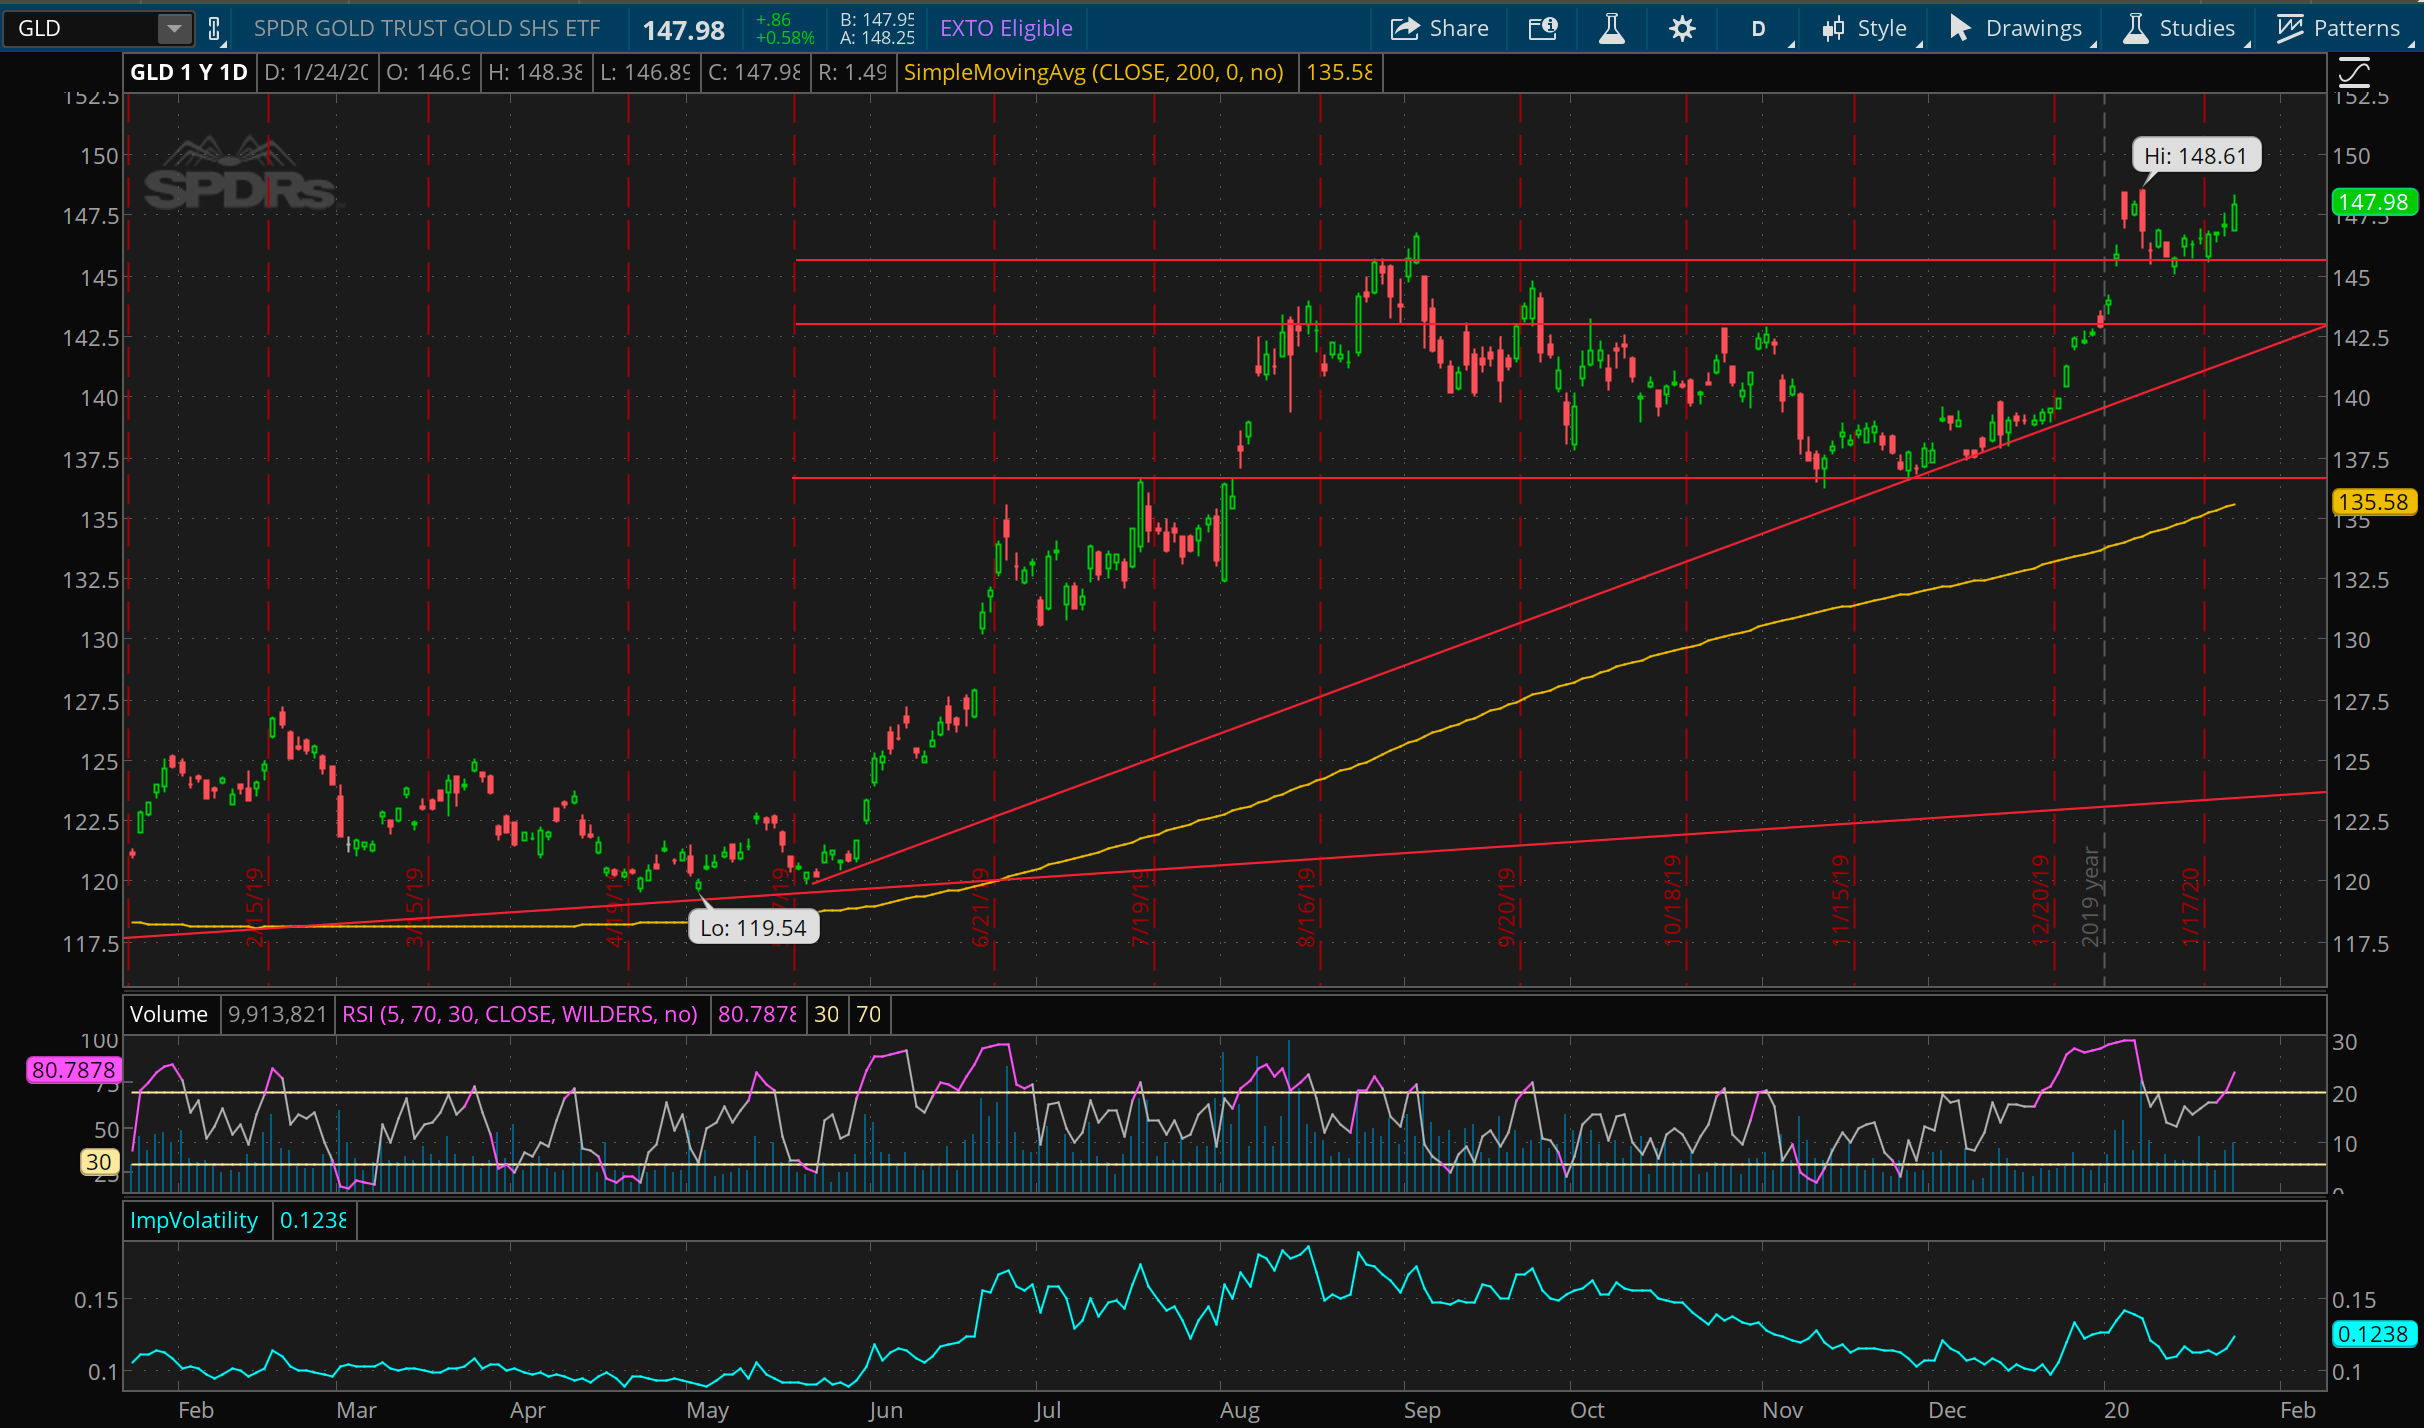
After a relatively flat week for gold last week, we saw GLD bounce off what looks like a valid support level around 145. It’s biggest rise was also on Friday against the sell off, which might confirm this nervousness in the market. Still hanging around at 7 year highs. Interesting to step back and consider why gold has made such a come back in the past 12 months.
USO
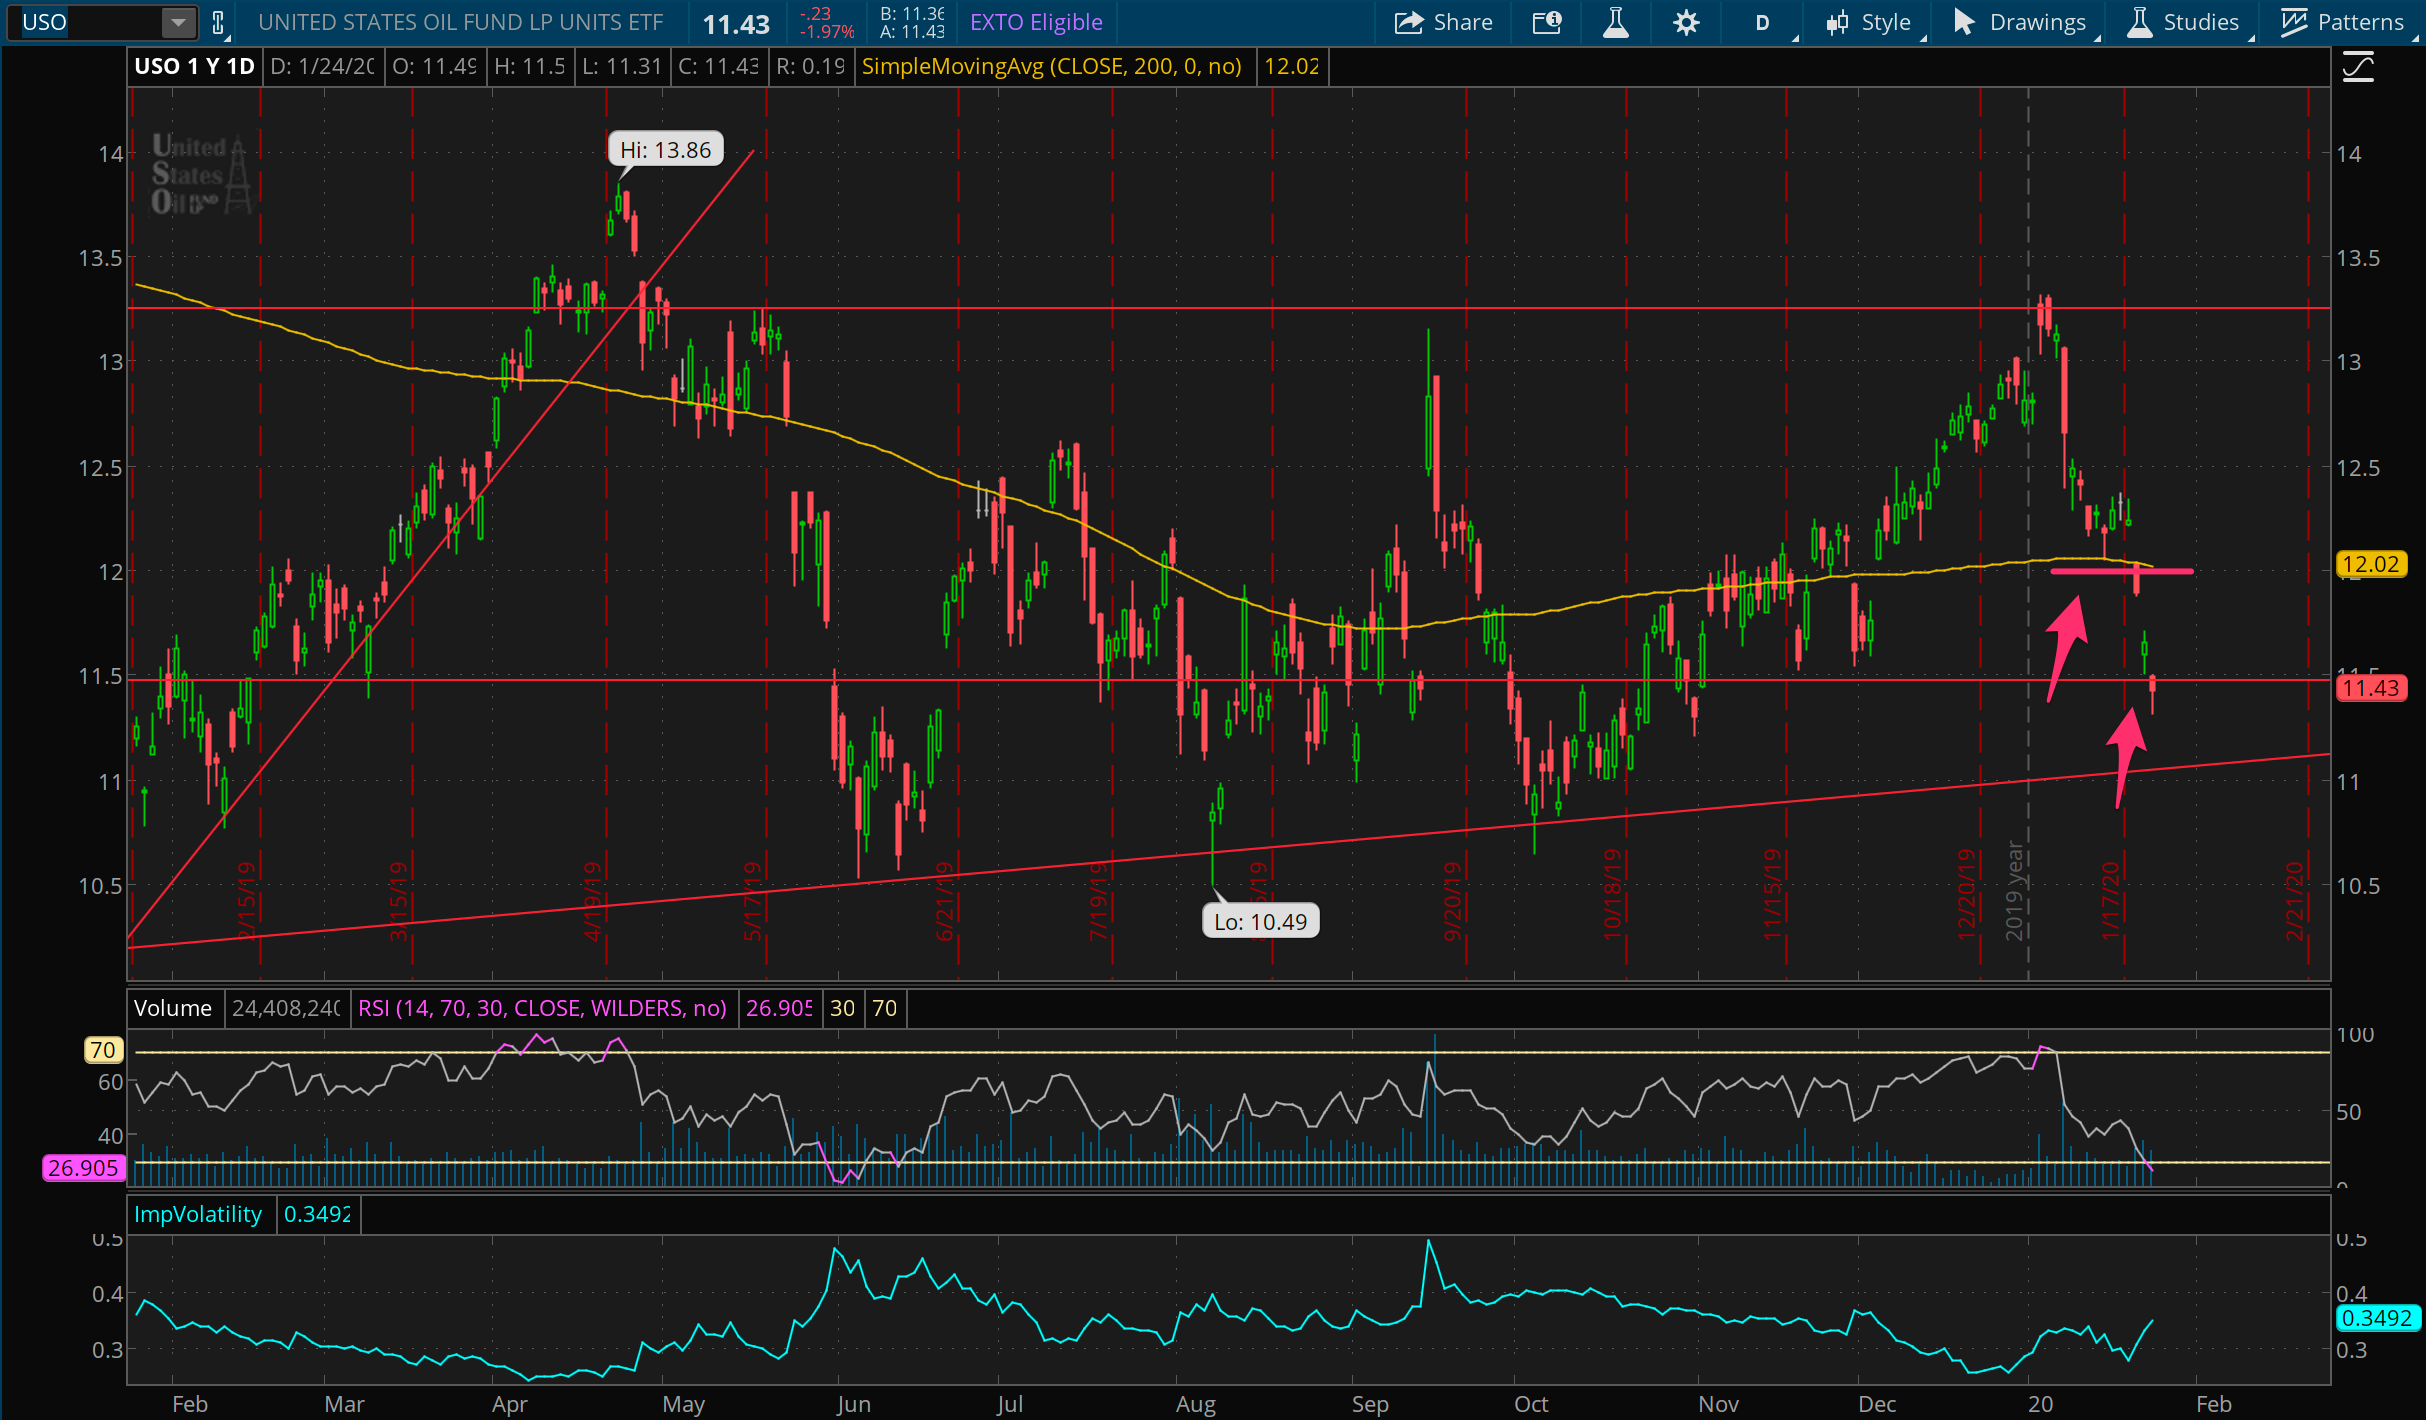
Oil still feels like the most honest one when it comes to economic outlook, and may very well relate most with China’s outlook right now. I’m long USO here via picking up some delta with in-the-money puts while adding some time decay to work in my favor. Likely to scale in further especially if it works down to the 11 level.
Lightning round…
AAPL
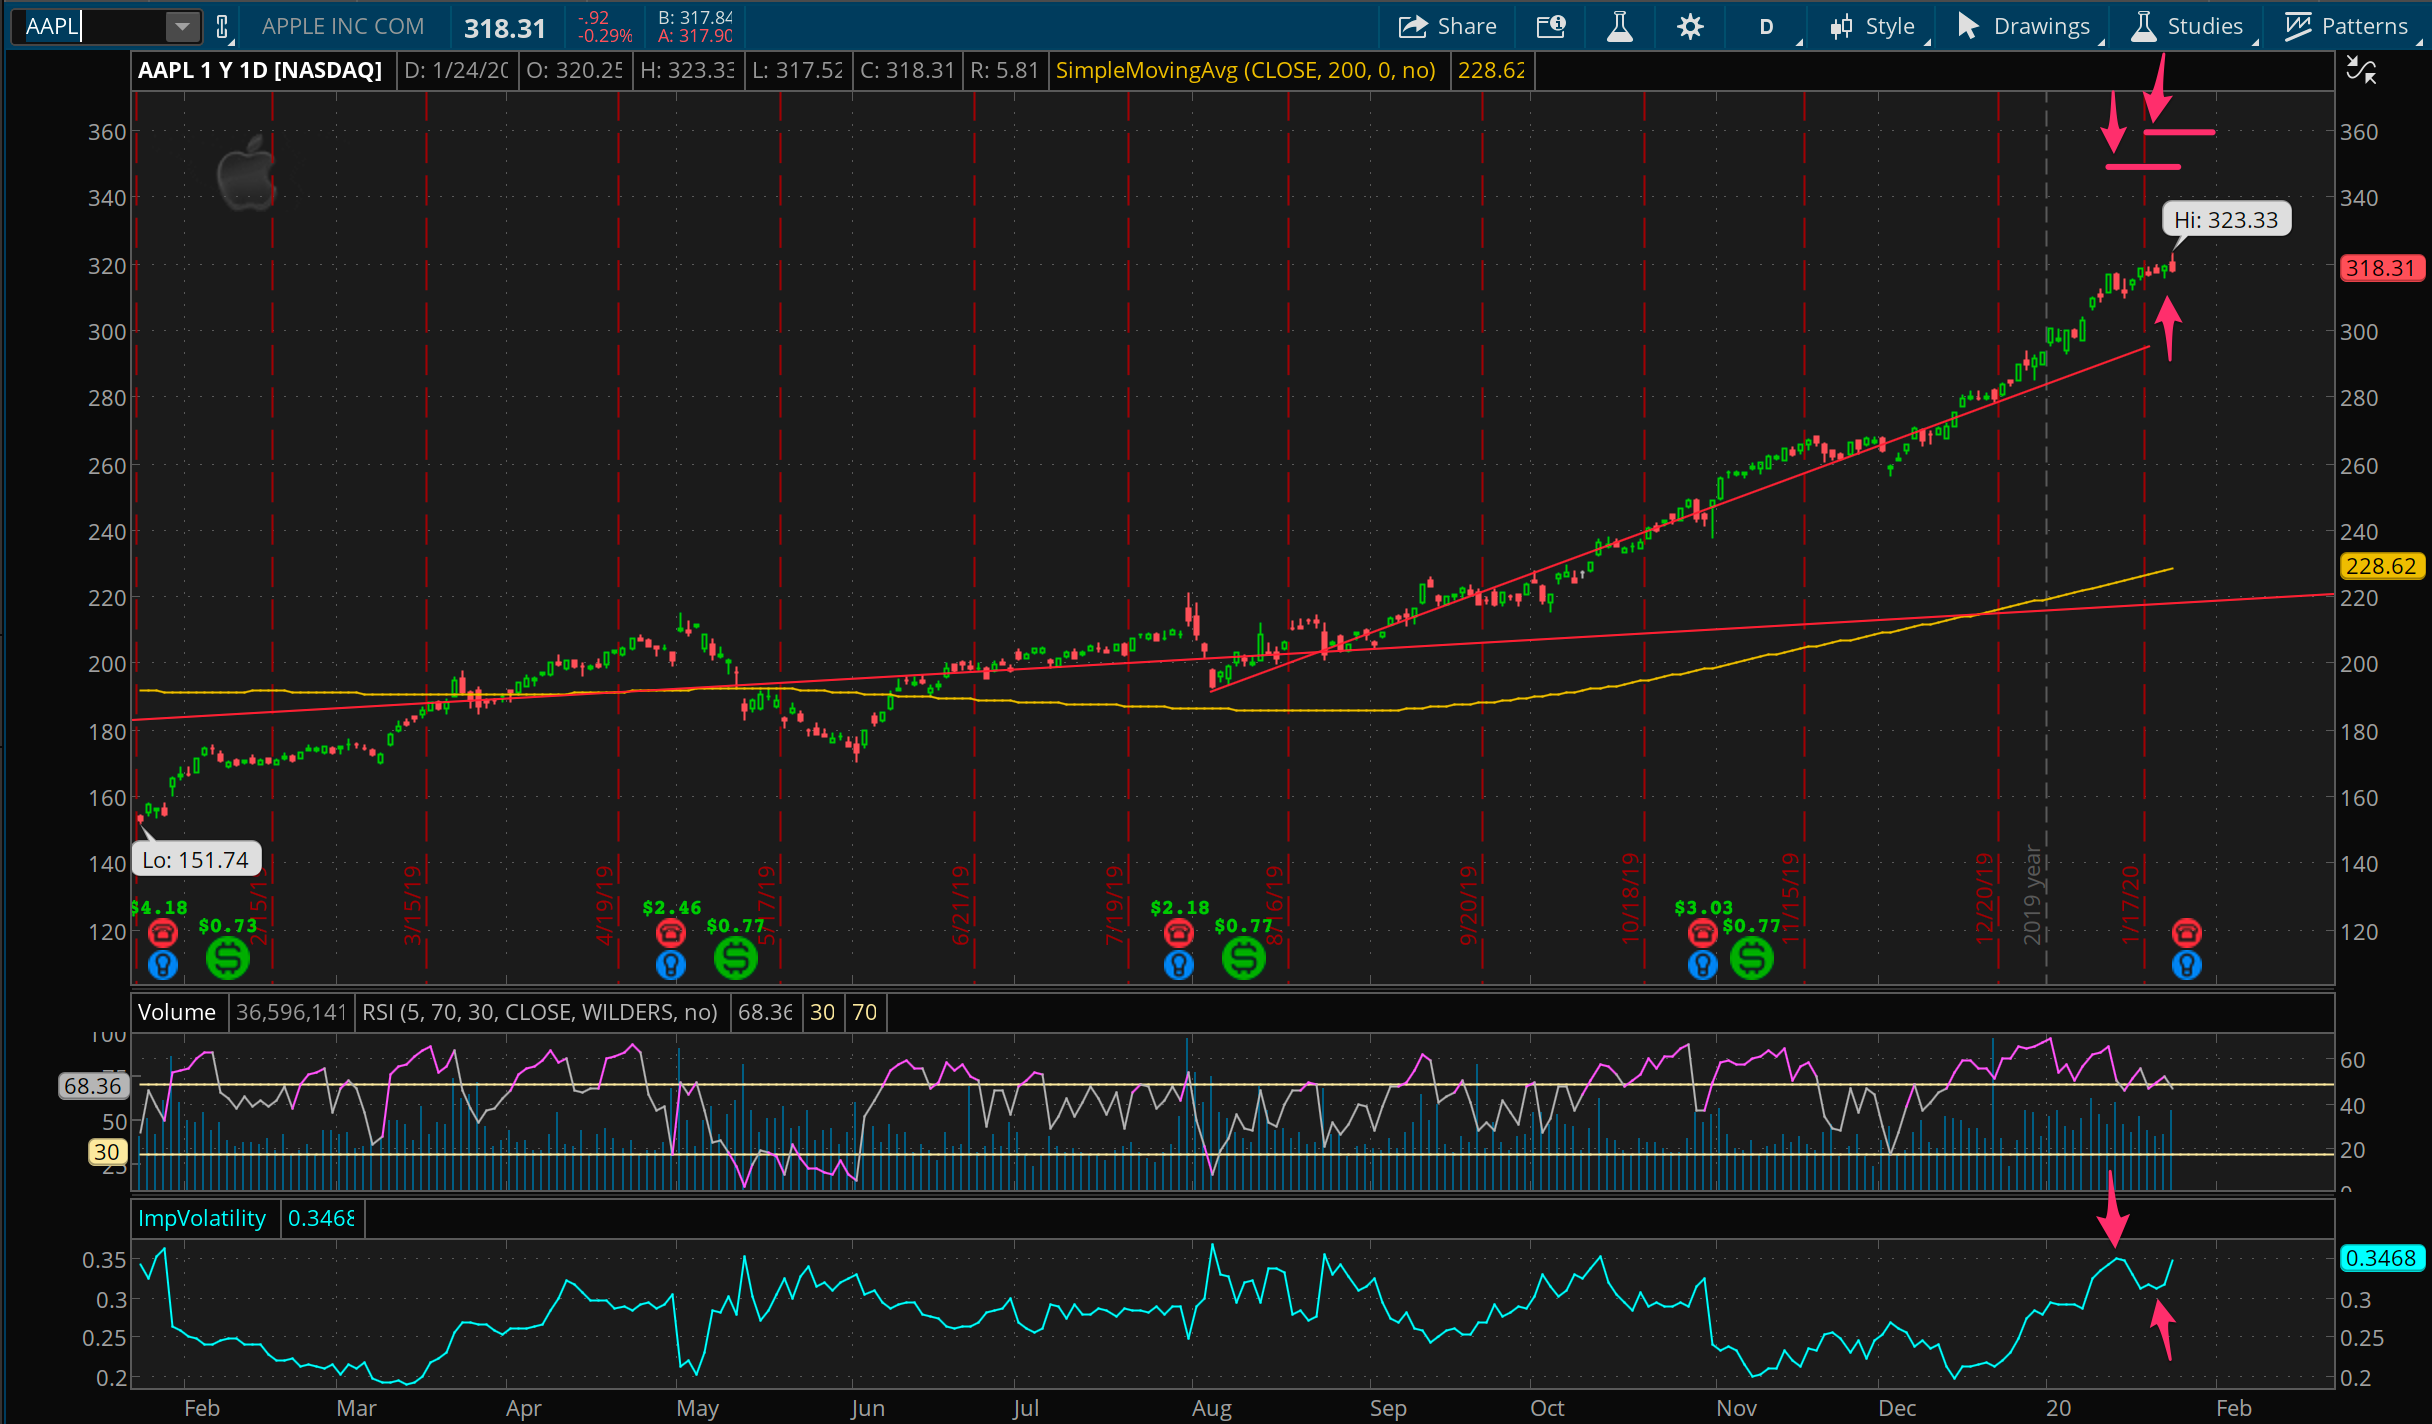
Closed out the short calls at 350 and 360 for an average of 3.5% return on capital. IV is high due to upcoming earnings and it’s making me itchy to reload this same way-out-of-the-money-calls play.
BA

I got spooked out of the put spread I put on last week testing the 320 multi year support. That level broke and I sold on the bounce for a small loser. Boeing was definitely a stock in play last week, and is likely to continue to be this week.
TSLA

Tesla is mad. It’s super volatile and people are making money in it in both directions. I’m short call spreads at 600 because it looked conservative. Thank god for defined risk and duration, I can sit tight and just watch the show for a while.
ROKU
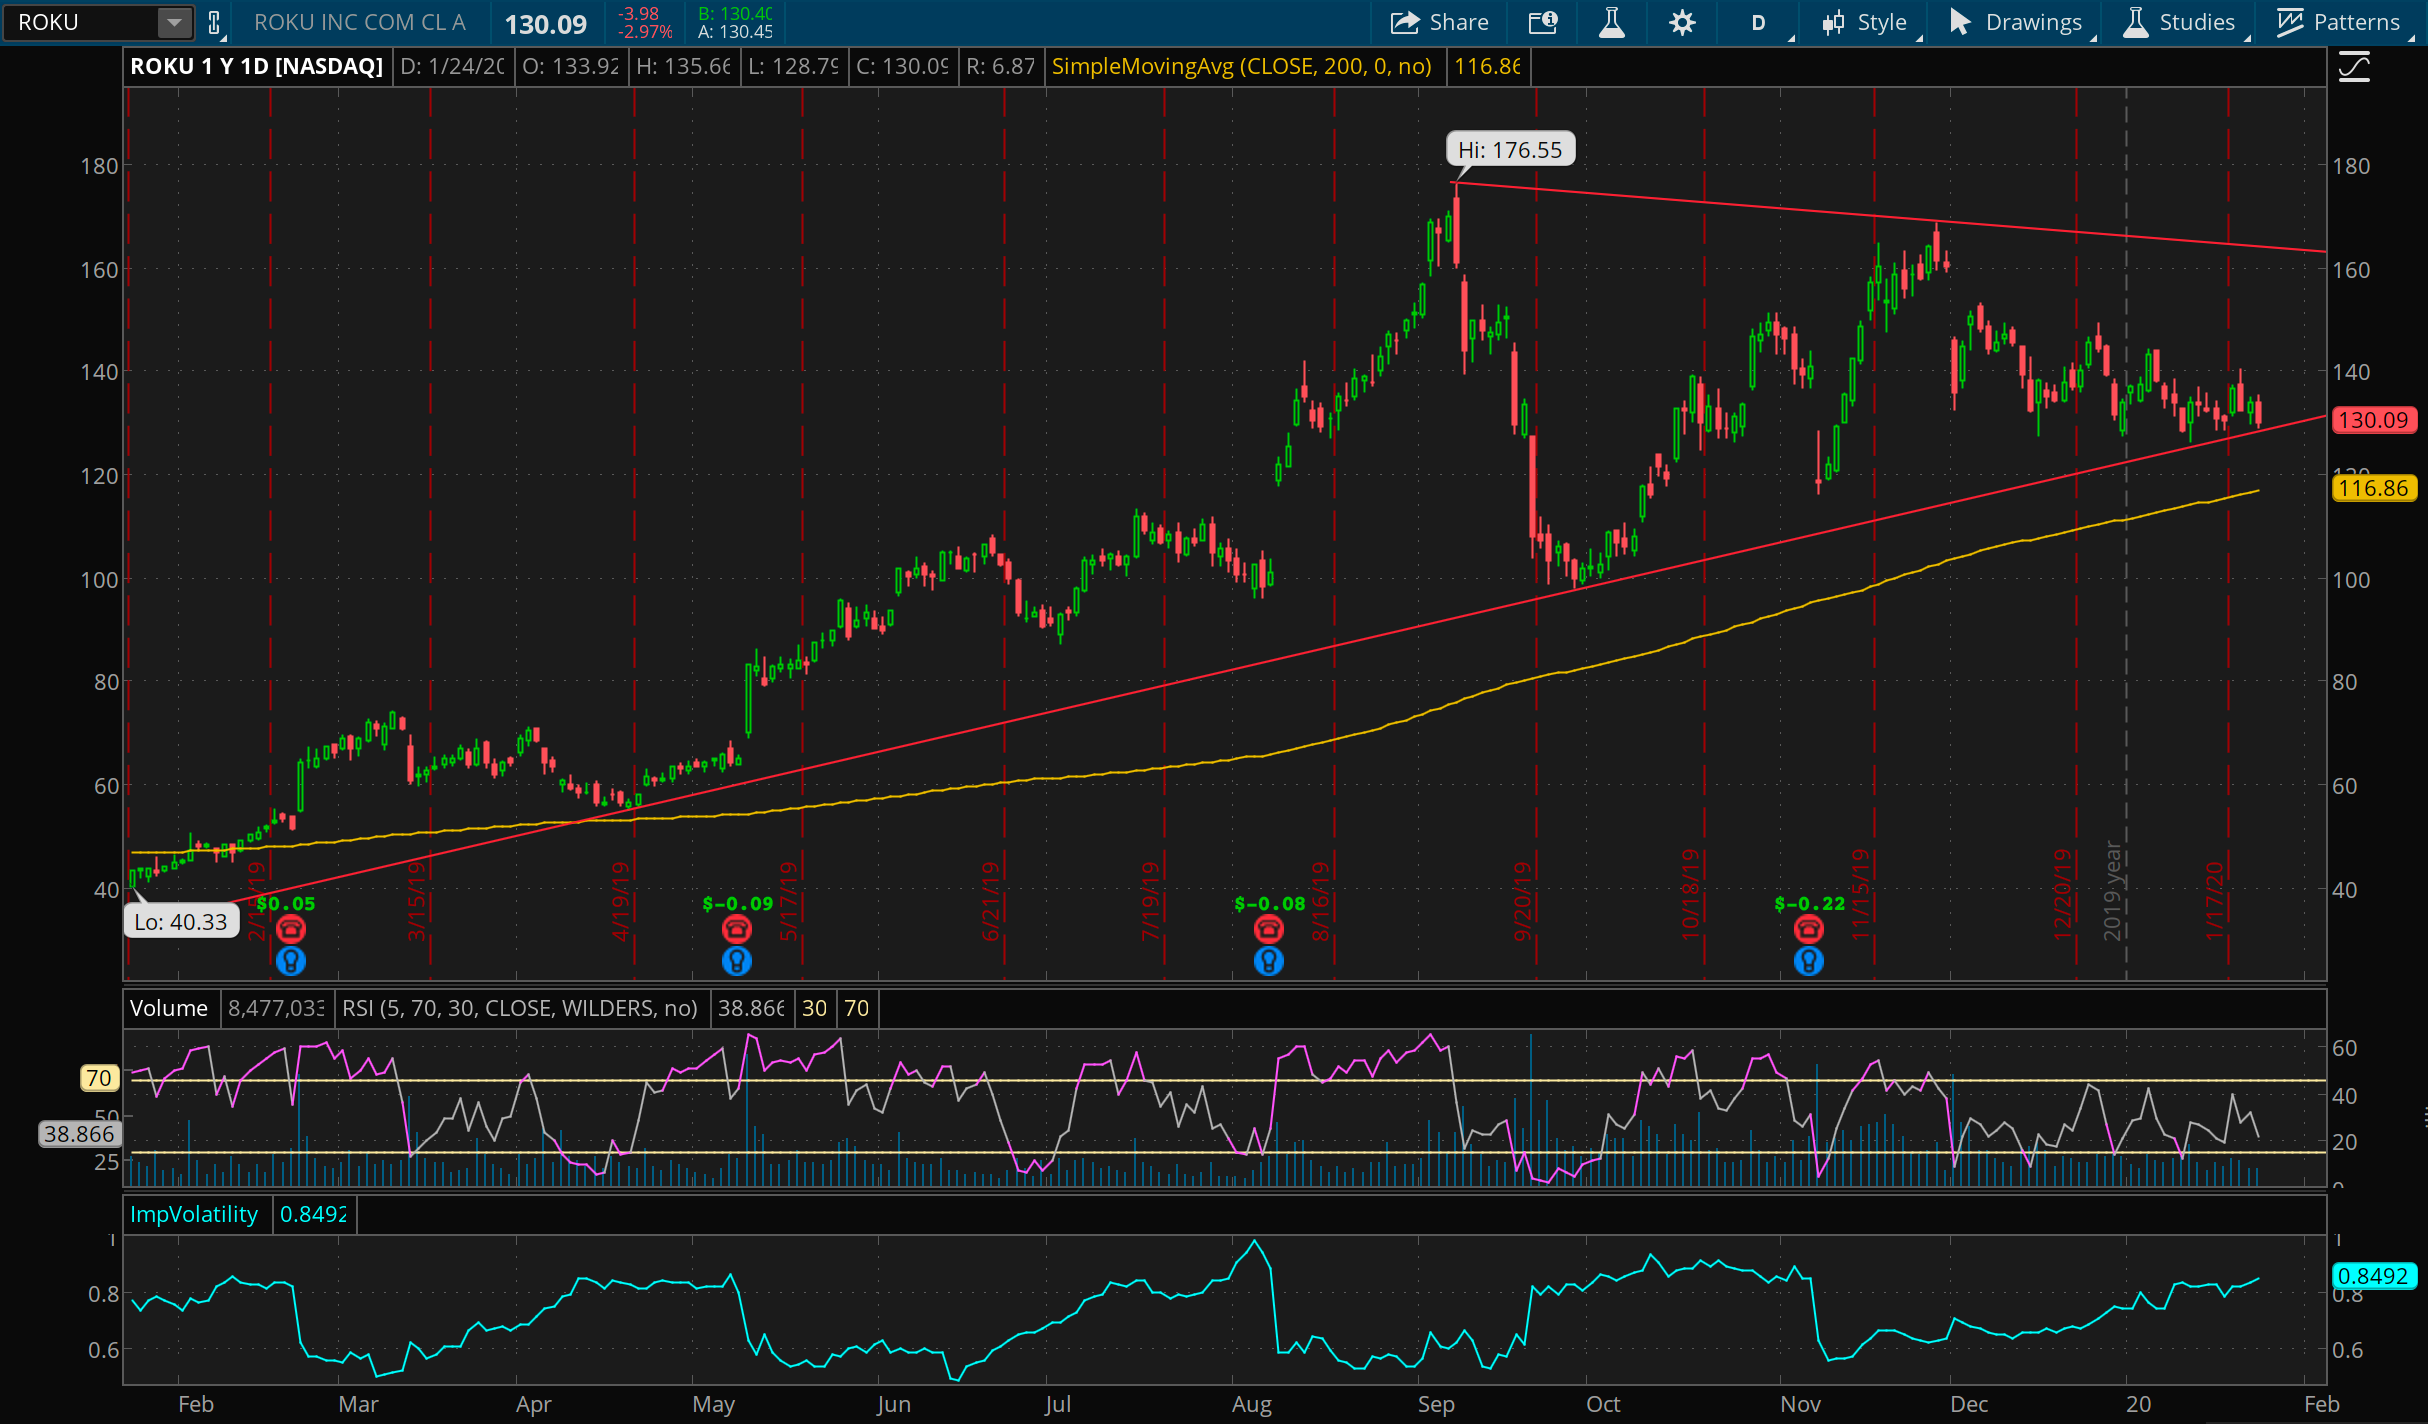
ROKU still looking settled in for a bounce of support. Just like last week. If the market bounces this week, it feels like this has to with it.
BTC
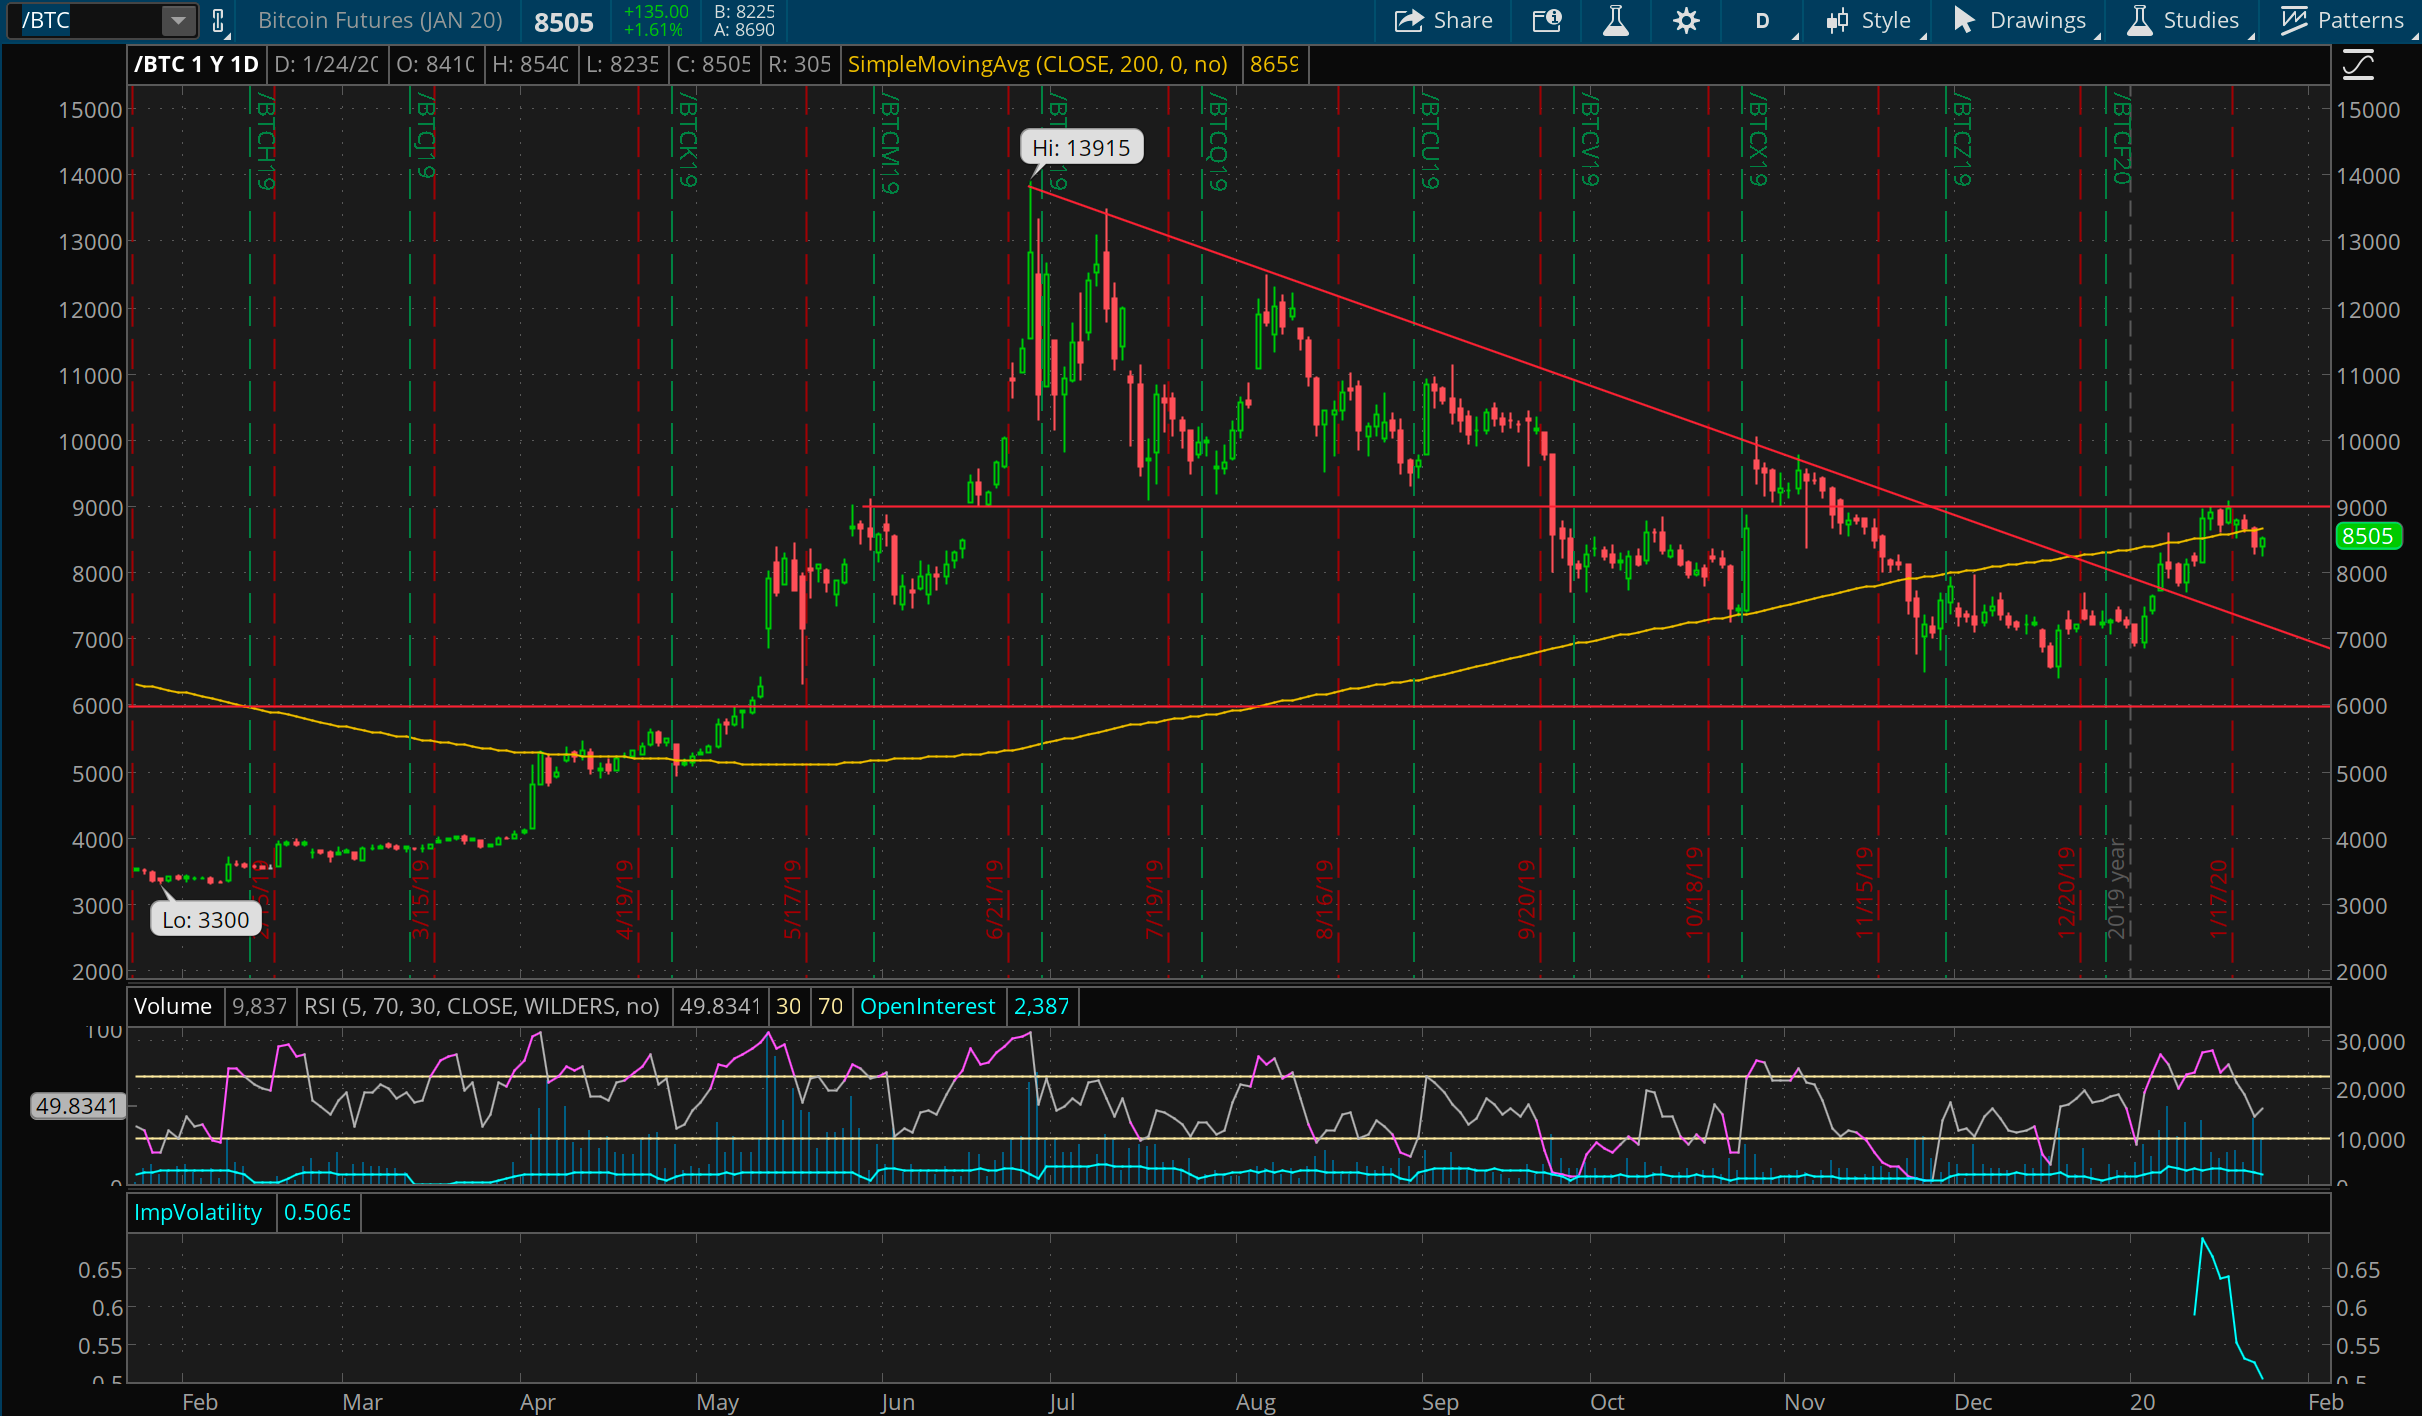
Poor bitcoin. It looked so very ready to jump over 9000 and take off last week. Alas, it’s drifting off that key resistance point. Some people might call this a cup and handle. At any rate, a sharp rise well over 9000 would be very bullish for BTC in my mind.
SLV
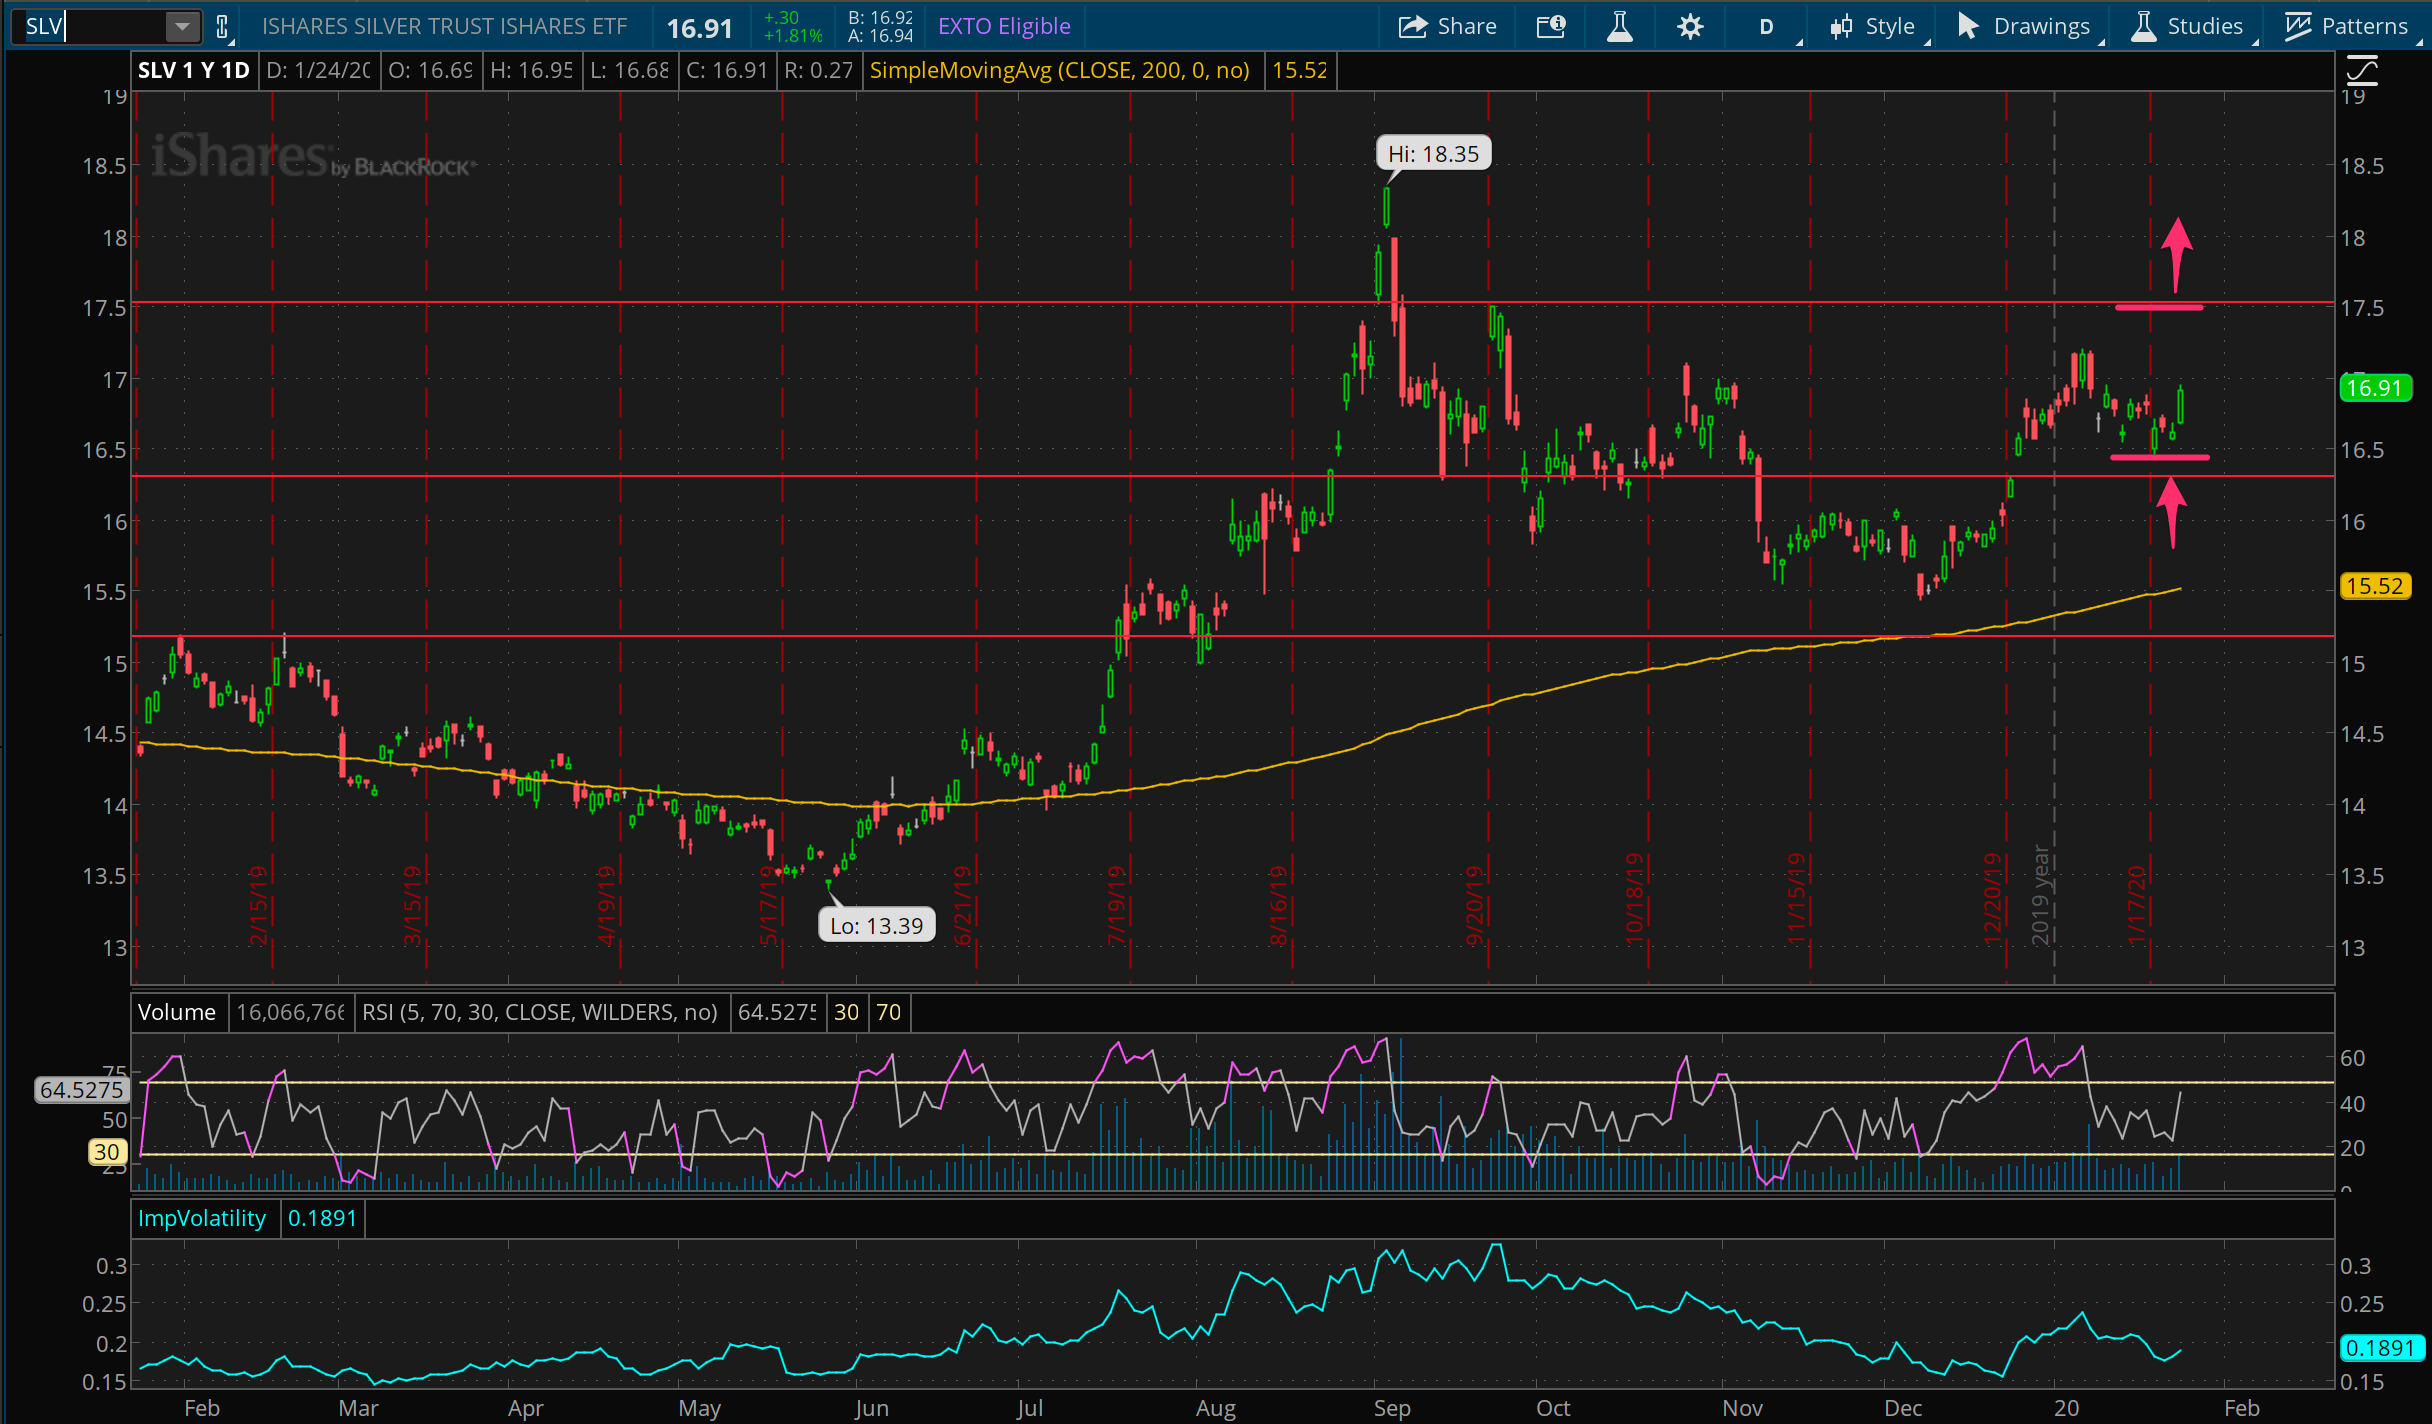
I put on an upside SLV play early this week that’s working out so far. Trying a different kind of technique as an experiment, and selling a 16.5 / 16 put spread to fund the purchase of a 17.5 call. The trade has $50 defined risk per contract, and I put it on for a credit. I like having some time on my side for the upside call to work out. We’ll see how it goes.
The chart of the week
Bonds are the “safe haven” asset, so they tend to mark investor fear well. This week’s chart of the week, found here, studies that effect in the context of large-scale viral outbreaks, by looking at bond yields during prior outbreaks. (Remember, bond prices rise when yields fall.)
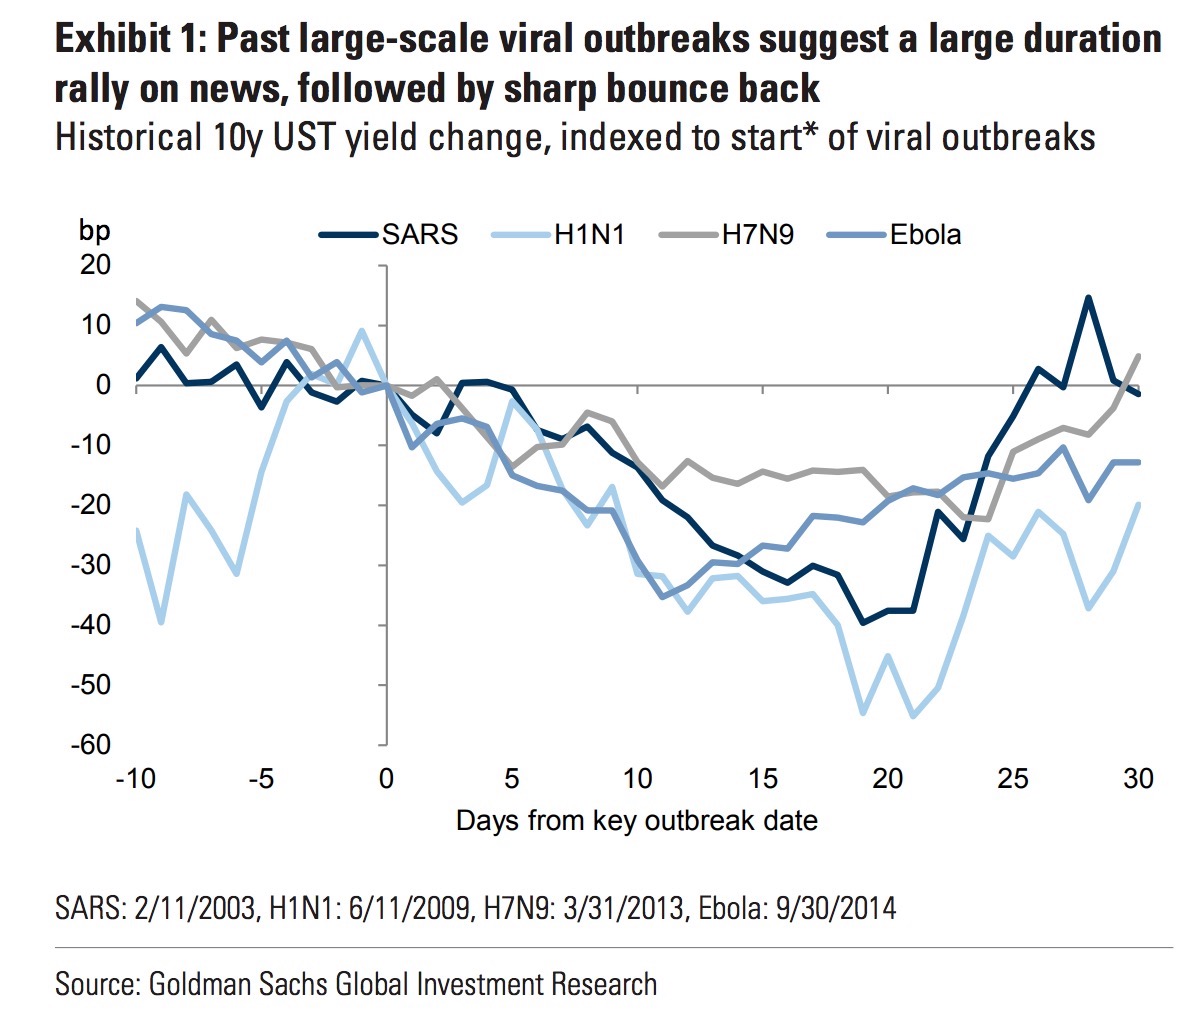
This suggests we’ve got a while to go for this situation to unfold. Let’s see what happens next.