
Legendary moves, China’s hard landing, and political shenanigans
First, let’s just press pause on the whole virus-about-to-destroy-humanity thing. We’ll get back to that.
The big story for market observers this week was undoubtedly Tesla. I mean, it gained 15% this week!
Hahaha just kidding. Not about the gain, but about that being the story. No no, as marvelous as it is to put another 15% on a stock that had already tripled since October lows, what captured the attention of all was an incredible parabolic move of nearly 50% in the first two days of this week. Tesla registered an intraday high of 968.99 this week, a full 318 points from it’s close of around 650 last week.
It seems fintwit could speak of nothing else on Monday and Tuesday. Even legends had to comment on it. As long as you didn’t lose your shirt trying to short it, you have to agree it was beautiful to behold.
Ok, as promised, on to the end-of-the-world stuff. Coronavirus status: not cured. Also, it’s definitely impacting global trade.
China tried, oh did it try, to just sort of stay silent until everyone in the room was looking at it, all with obvious looks on their faces of “so… right… about those markets you won’t open…”. And so, after an unusual extended close of the Chinese markets, they finally opened up around 9% down on Sunday night (here in the states). Many commodities including copper, iron ore, crude oil, and even eggs (not the eggs!) all opened up and immediately hit limit down and closed.
Obviously, in this highly connected global economy, this had a huge impact on U.S. markets which promptly crashed when the futures market opened on Sunday night.
Hahahaha, got you again! Nope, futures were actually up soon after they opened. And the session after that, and after that… you get the idea. The S&P 500 ended over 3% higher this week from last Friday’s close.
What you need to understand though is that capital markets are very nuanced and complex, with interactions and influences that can be hard to comprehend. That said, I think the conclusion in this case is obvious: Super Bowl every week.
By the way, to the astute who might be wondering if China’s slowdown might affect Tesla’s production, you have clearly proven yourself an unbeliever and should go buy Tesla stock. For Tesla has transcended “parts”.
And well, finally, I suppose I should mention that there was some political news this week. To me it fits pretty squarely into the category of “news we can pretend is moving a market but doesn’t really”. Though I guess if Trump actually got impeached, that would have moved the markets on surprise alone. But he definitely didn’t.
In the meantime, democrats showed us how awesome they were at doing something as novel and innovative as counting the votes in the Iowa caucus. I guess eventually they got it done? Thank goodness they were able to finally declare a winner. Wait what, there’s no winner? Ohh… This is fine.
The Four Horsemen
SPY
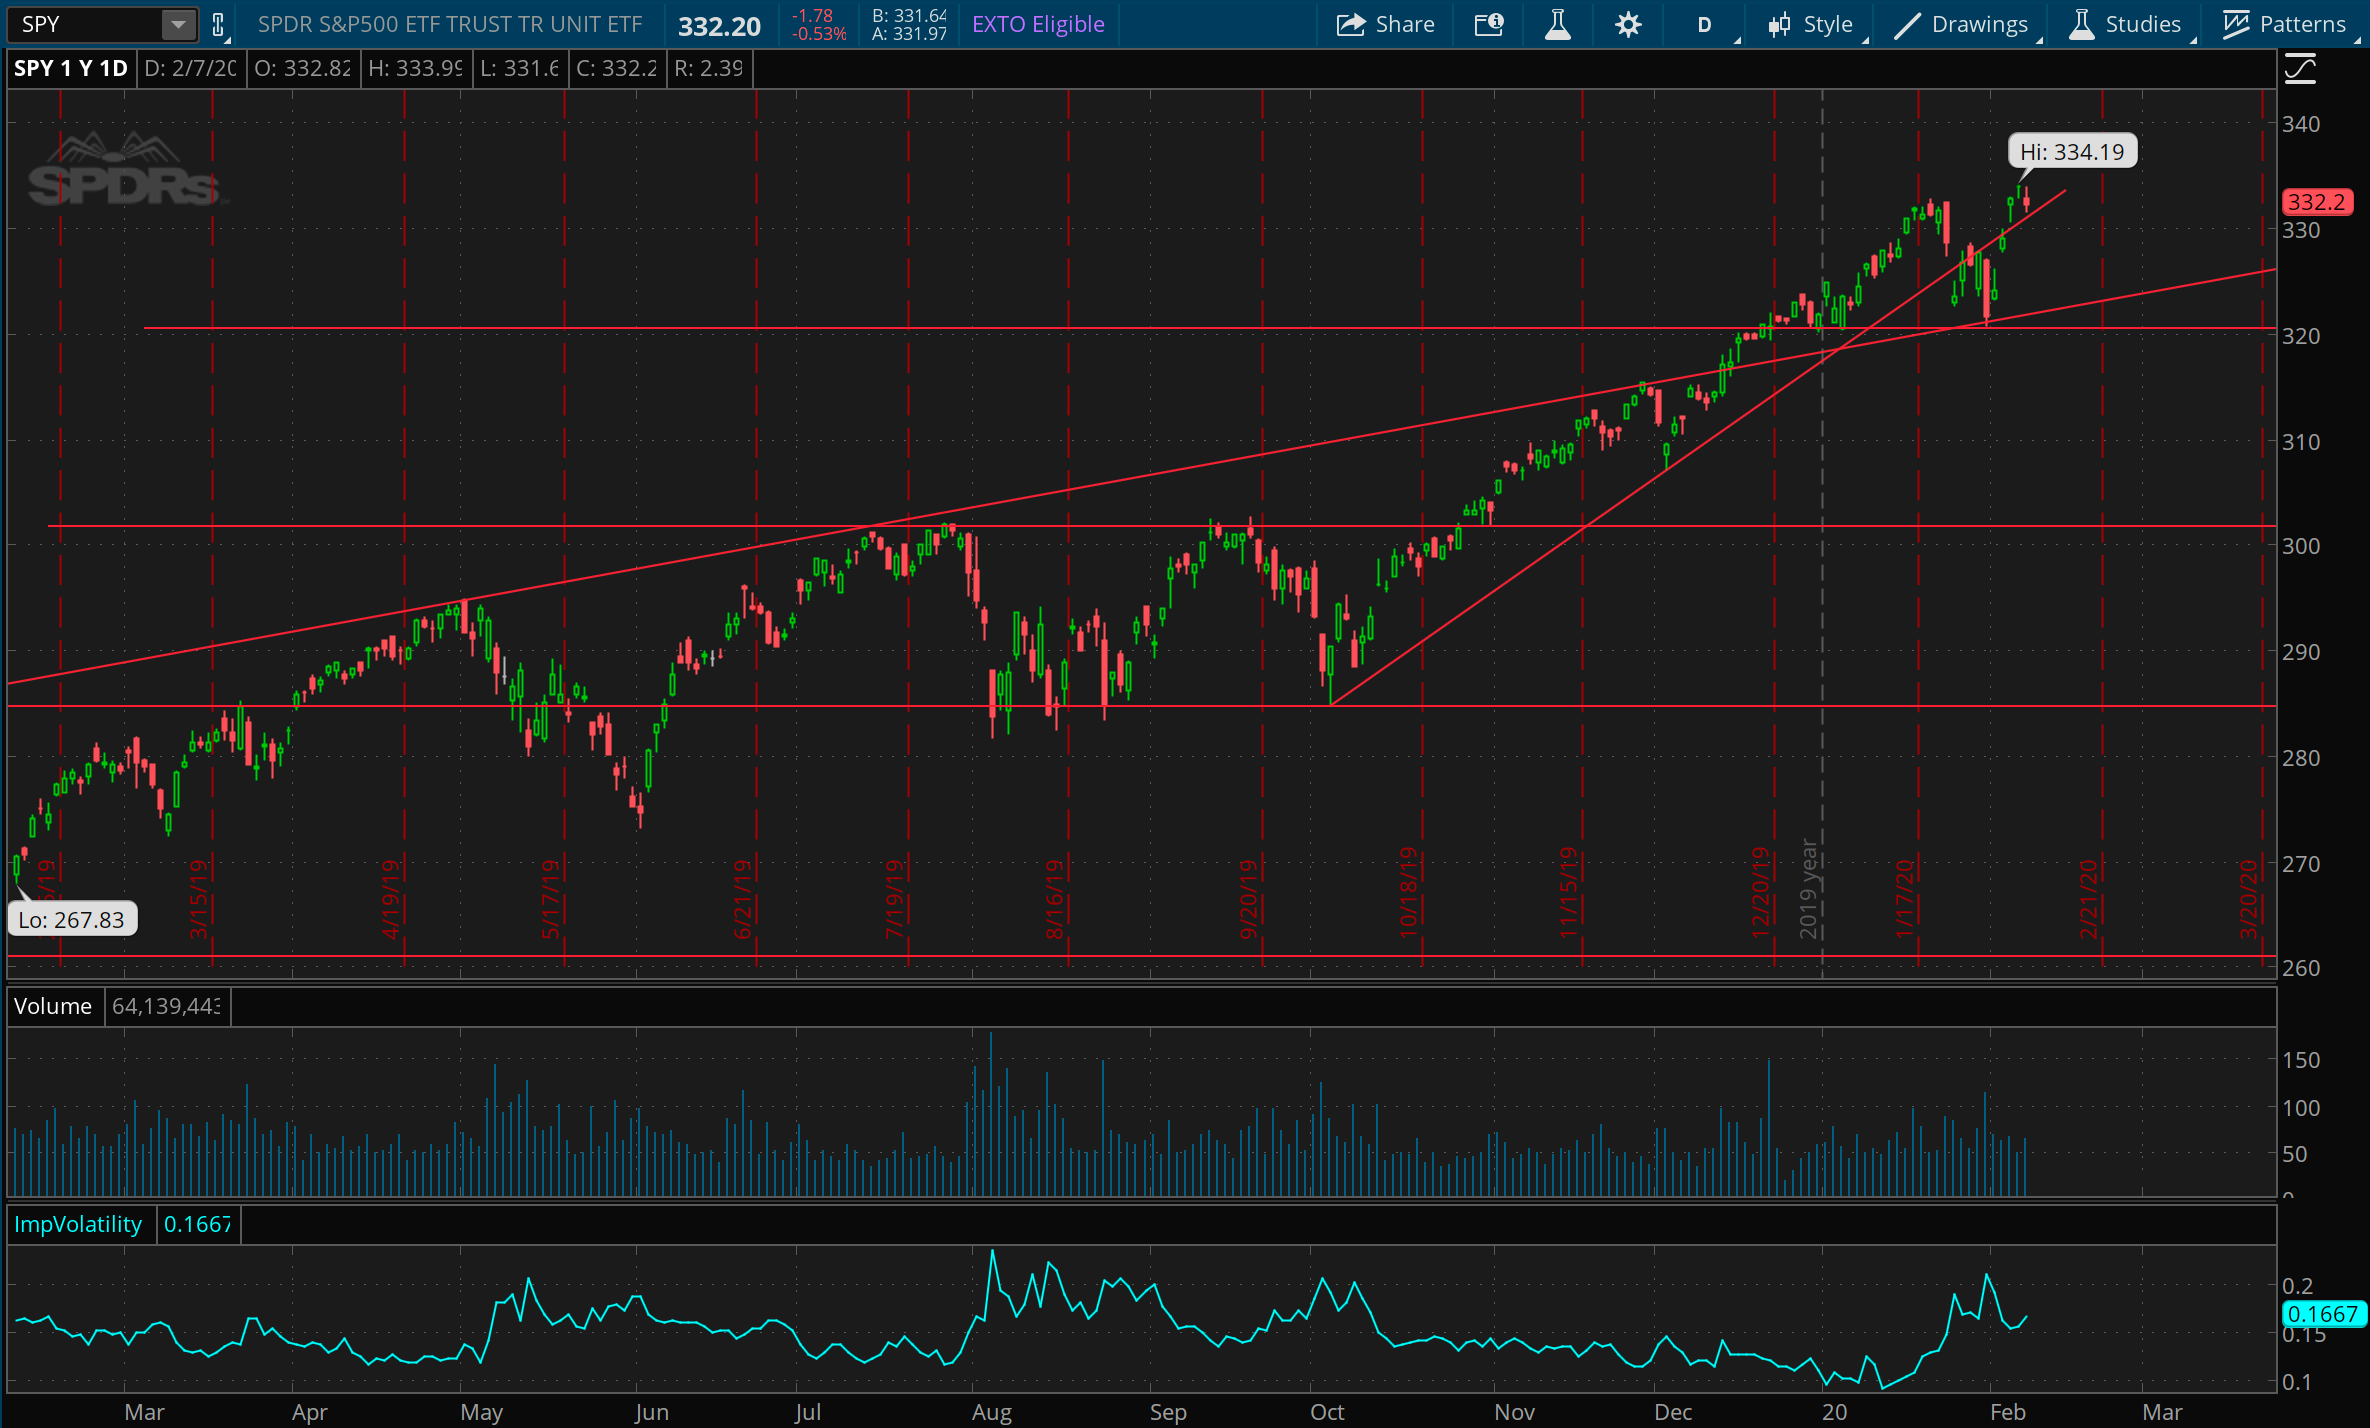
This week was a near mirror image of last week, with a 3% rise vs last week’s 3% fall. Where last week we firmly registered under the trend line in place from October’s lows, this week we appear to have reclaimed it. But often volatility begets a bit more volatility, and to me it looks likely that we’ll continue to see some back-and-forth action between 340 and 320 for the next week or two. This week’s action affirmed 320 as an area of support, with 310 as a secondary place that might stop a fall, and 300 still the major line in the sand.
TLT
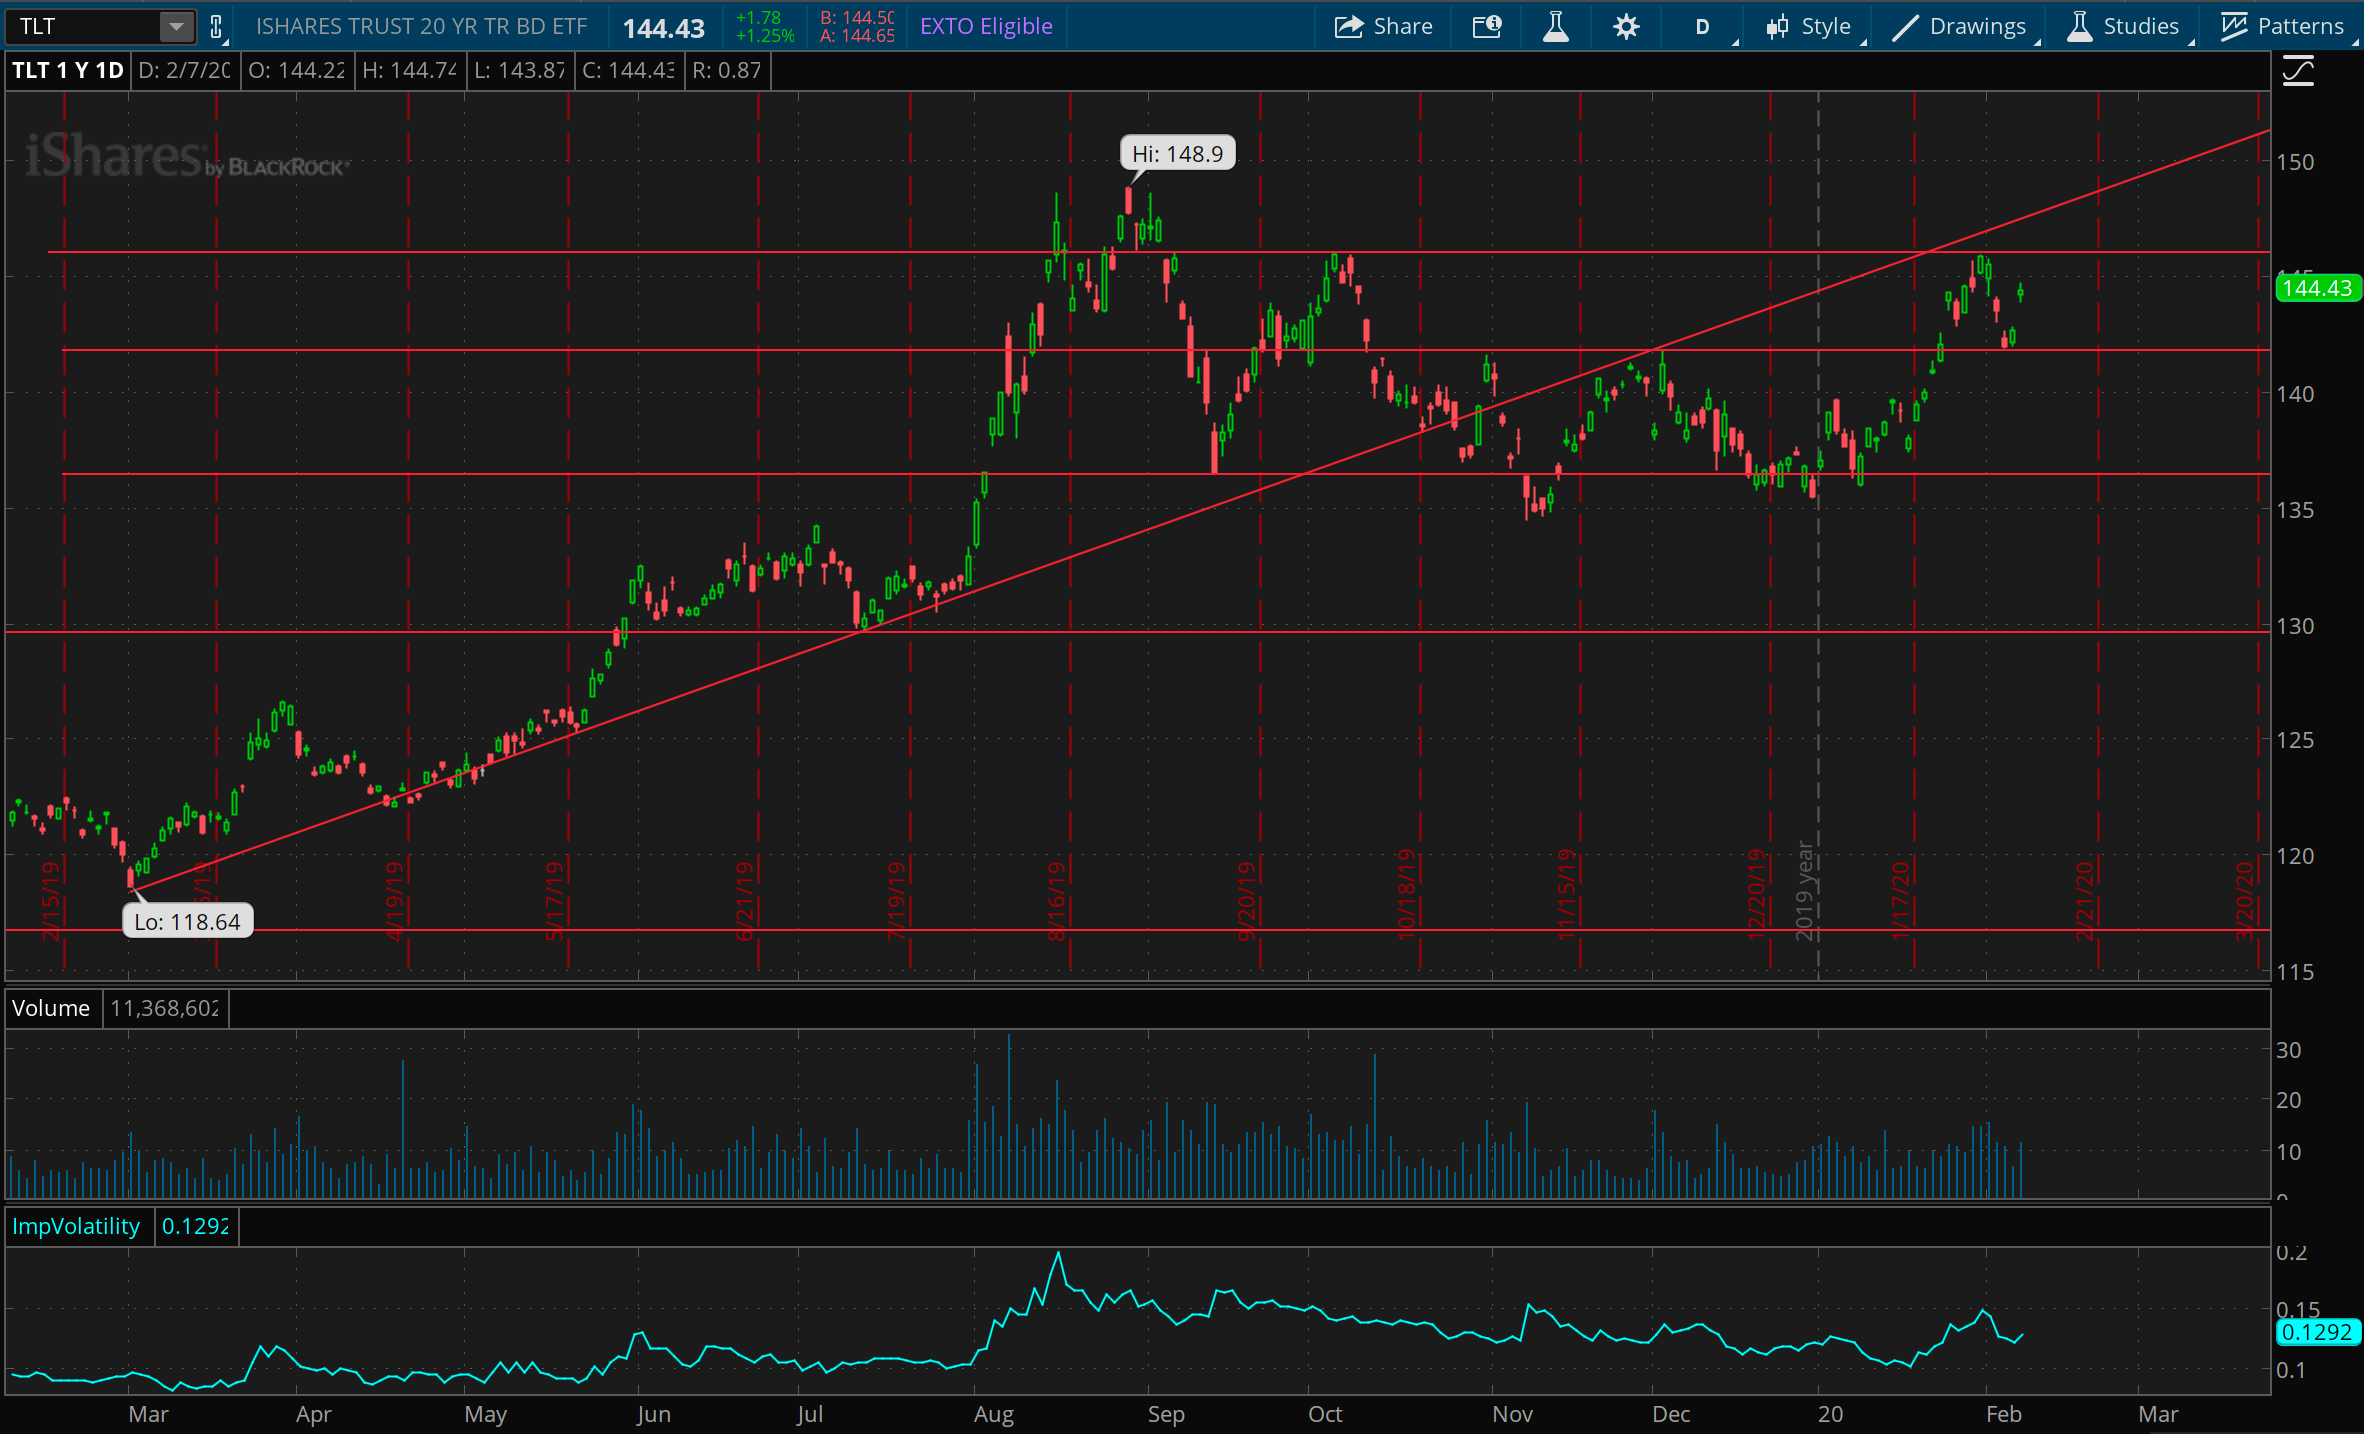
In total, bonds closed lower this week, after quickly reaching prior resistance as noted last week. The deflection off of 146, which we’d seen before in September and October last year, affirmed this as a key price level. But days after heading down from this resistance, TLT found support in the 142 area, which itself had served as prior resistance back in October and November last year. I think 142 and 146 still define the clearest range for TLT in the next couple weeks, with the potential to head down towards 137 if we break under 142, or else 149 if we break over 146.
GLD
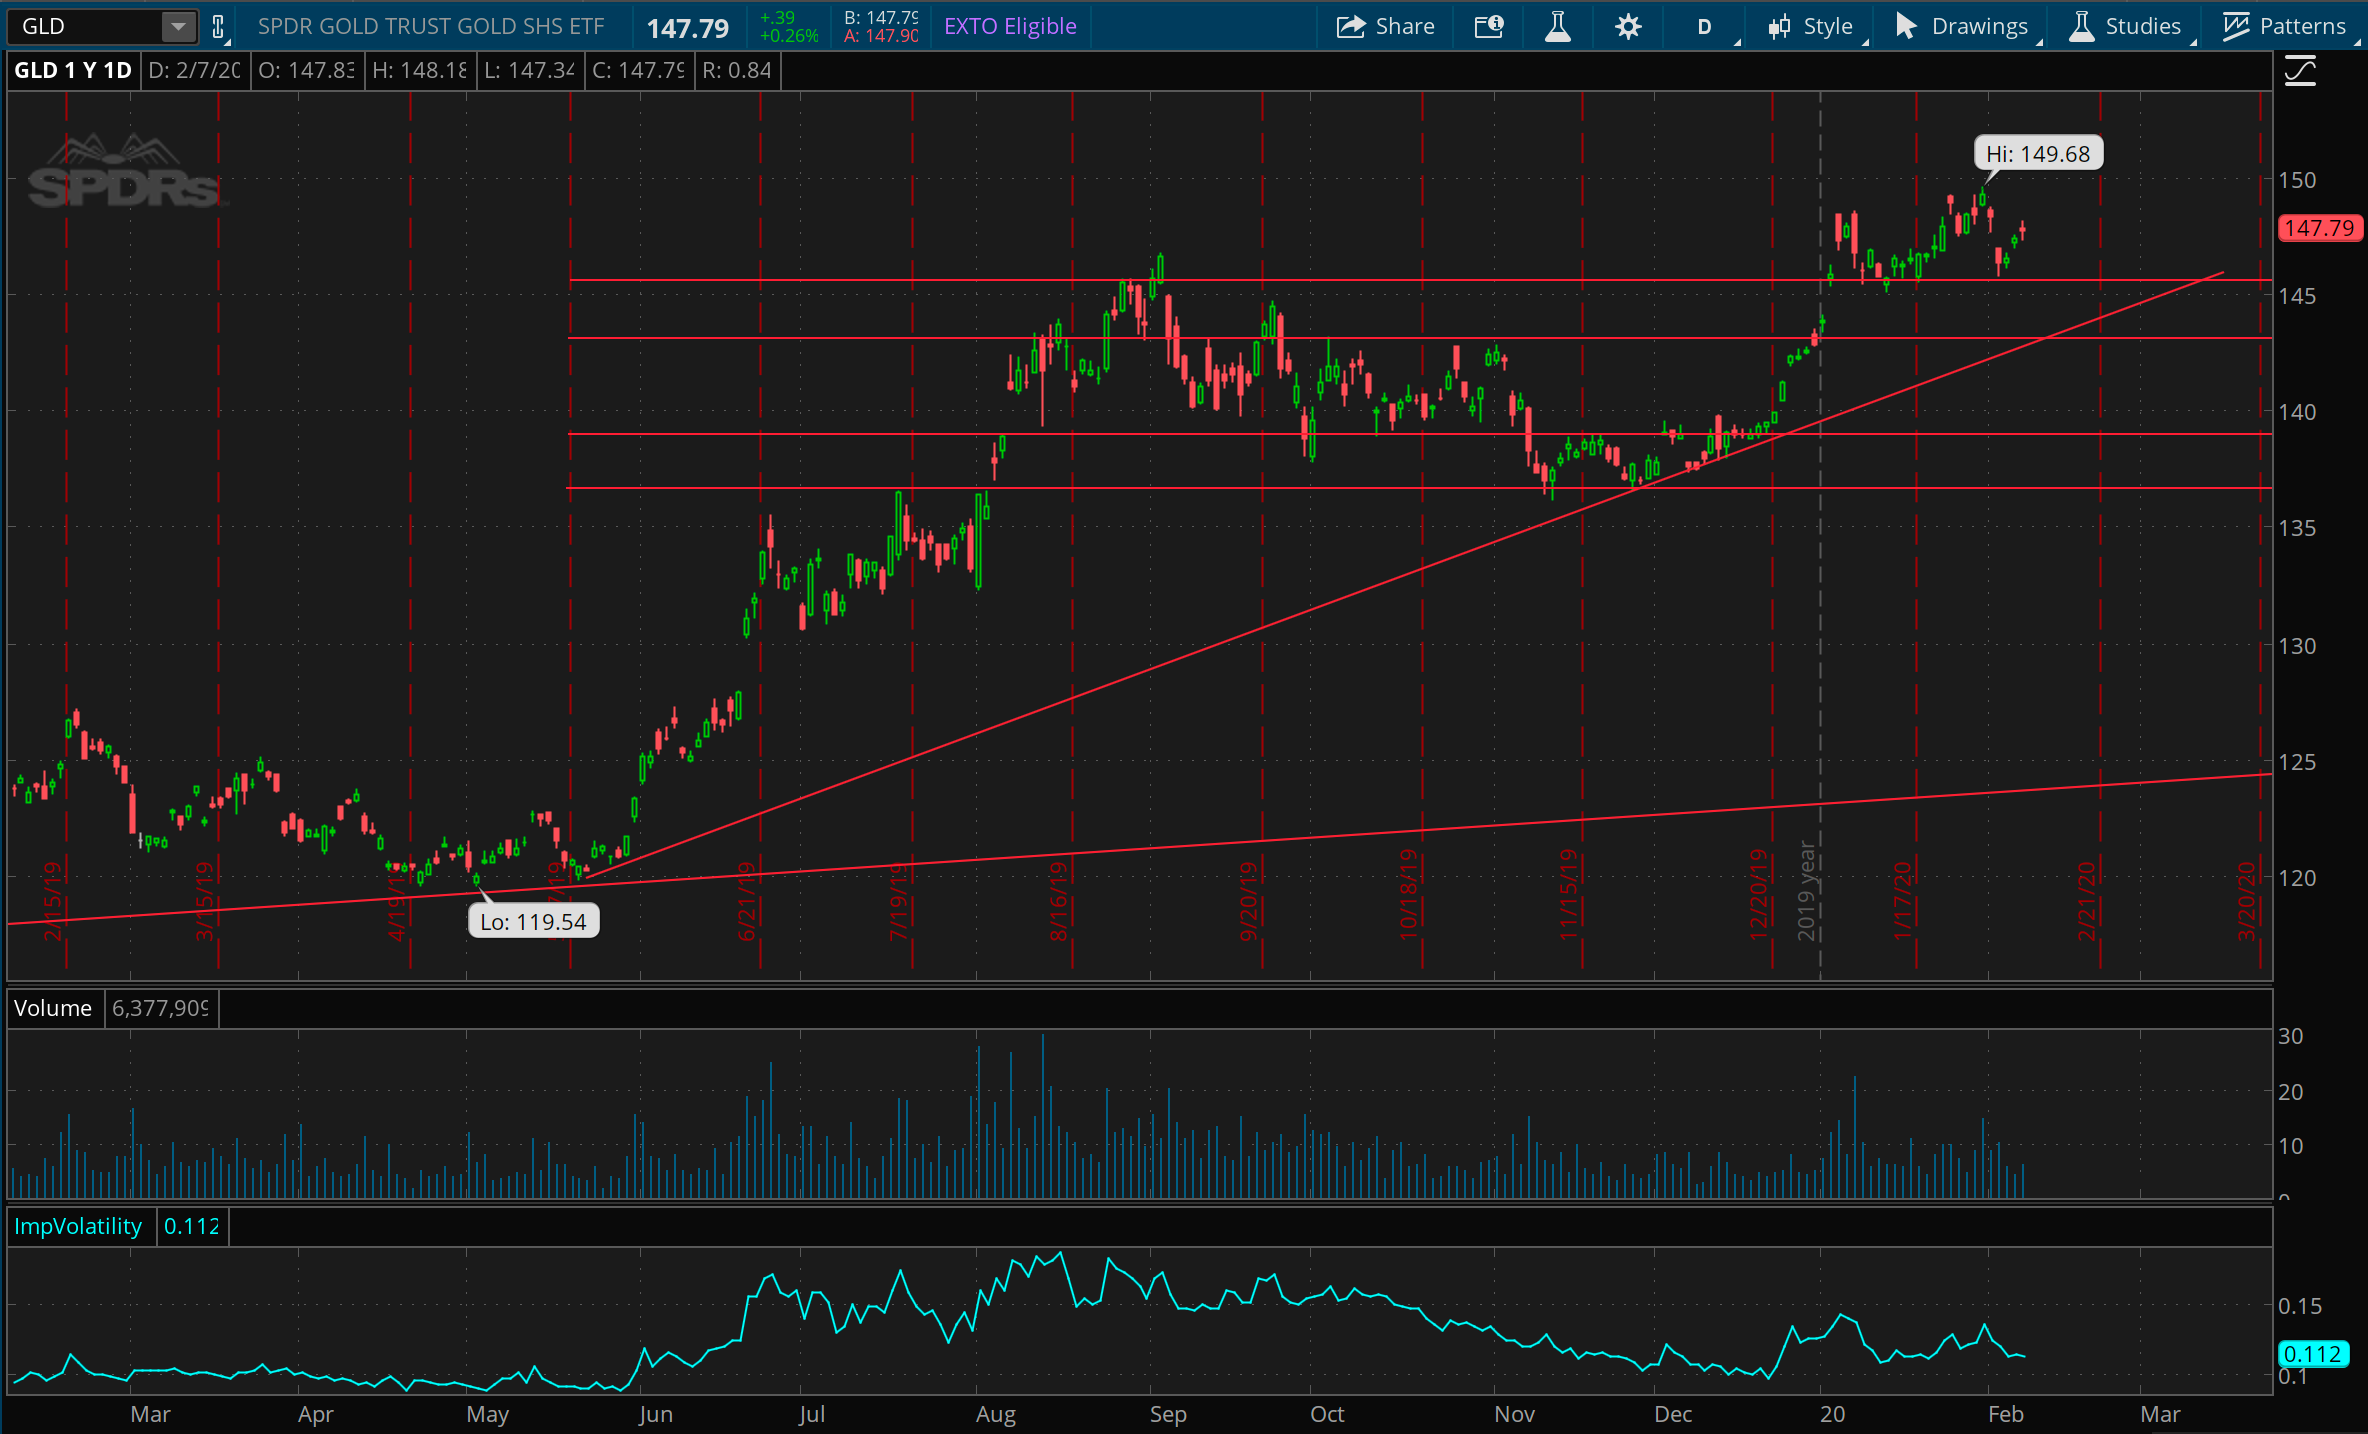
Gold again showed us that 145 is serving as a key support level for prices this week. We saw just the same thing last week, and it bodes well for Gold bulls. With the uptrend in the place and the amount of volume that accumulated between 140 and 145, GLD appears set to continue marching higher over the next several months. In the short term, it feels like GLD will just continue to stumble around in a range between 145 and 150, drifting along until we test the upper trend line again and likely we see it head higher from there.
USO
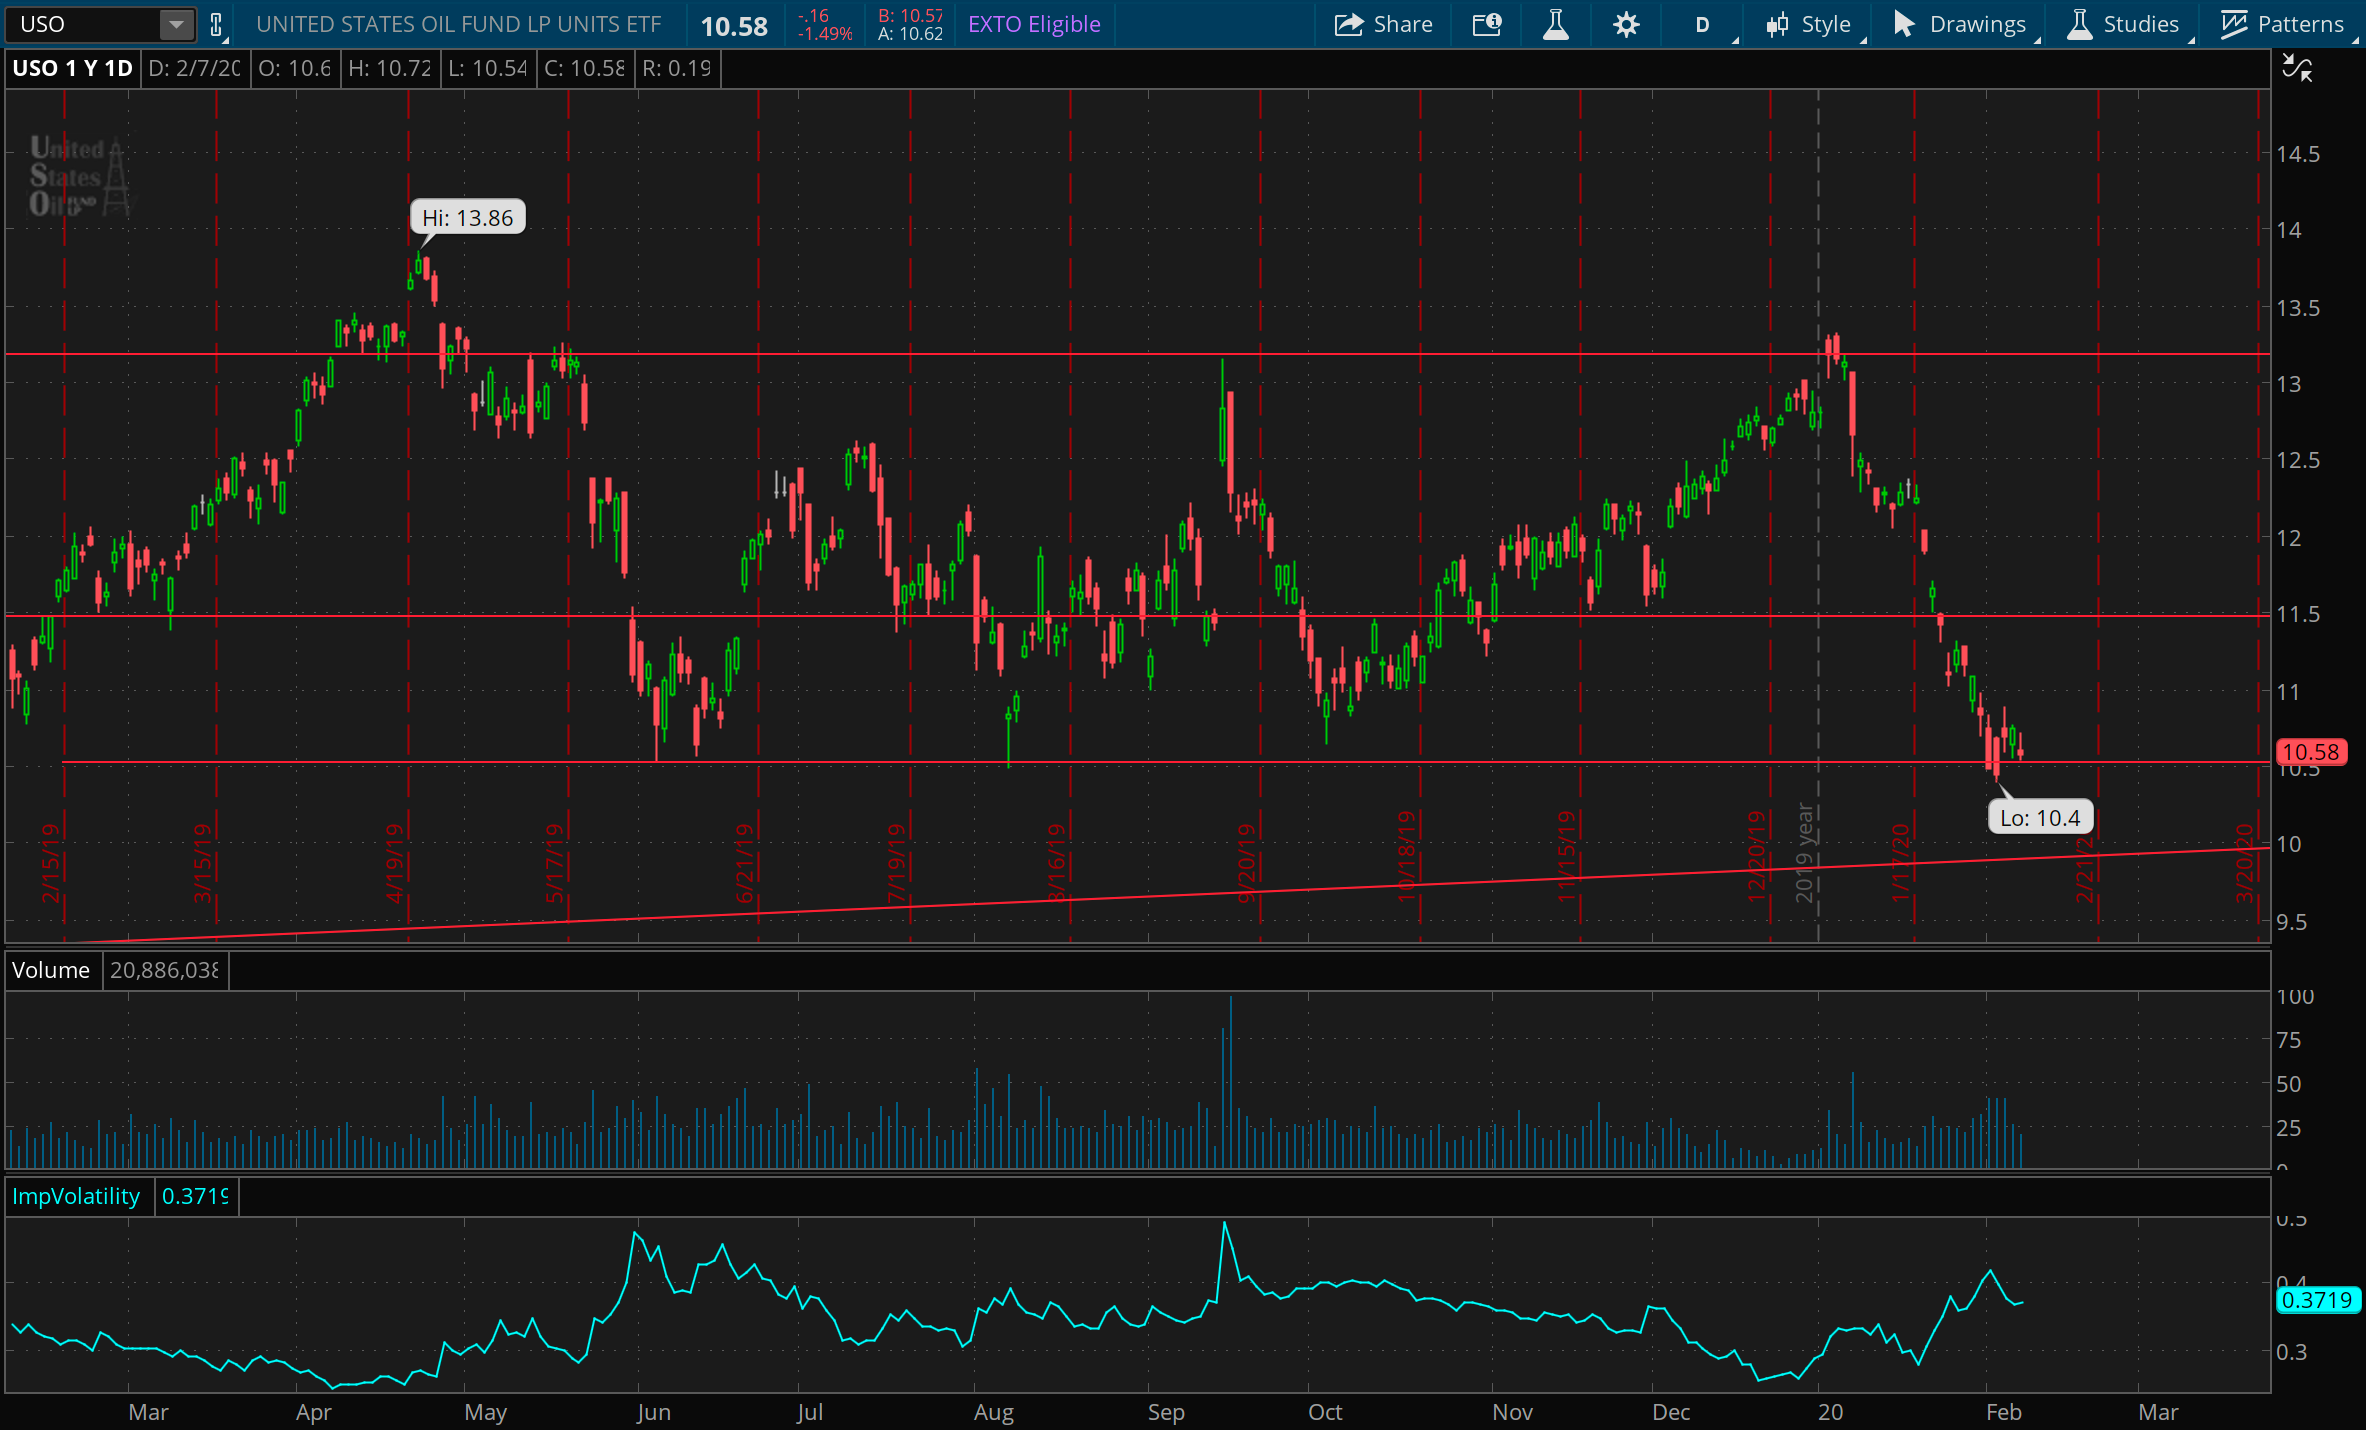
Oil, presented here via USO, continues to look heavy, despite prices are holding at a key support level that has been visited three other times in the past year, during June, August, and October of 2019. I still hold the belief stated last week that oil is going to signal what to expect in other asset classes. If it breaks down under this support level, it feels quite likely that the market will want to follow, and that bonds and gold would be set to move higher. Oil still appears to be the key indicator of the outlook for global economic demand, and given China’s issues, that demand is currently very much in question.
The chart of the week
Now, come on, of course you expect Tesla to be the chart of the week. And it does mark this week more than any other chart out there. But you can see that anywhere you look!
Instead, here’s a data point few others were thinking about, pointed out by @markminervini. Over 60% of the stocks in the S&P 500 have dividend yields over the 10-year Treasury yield.
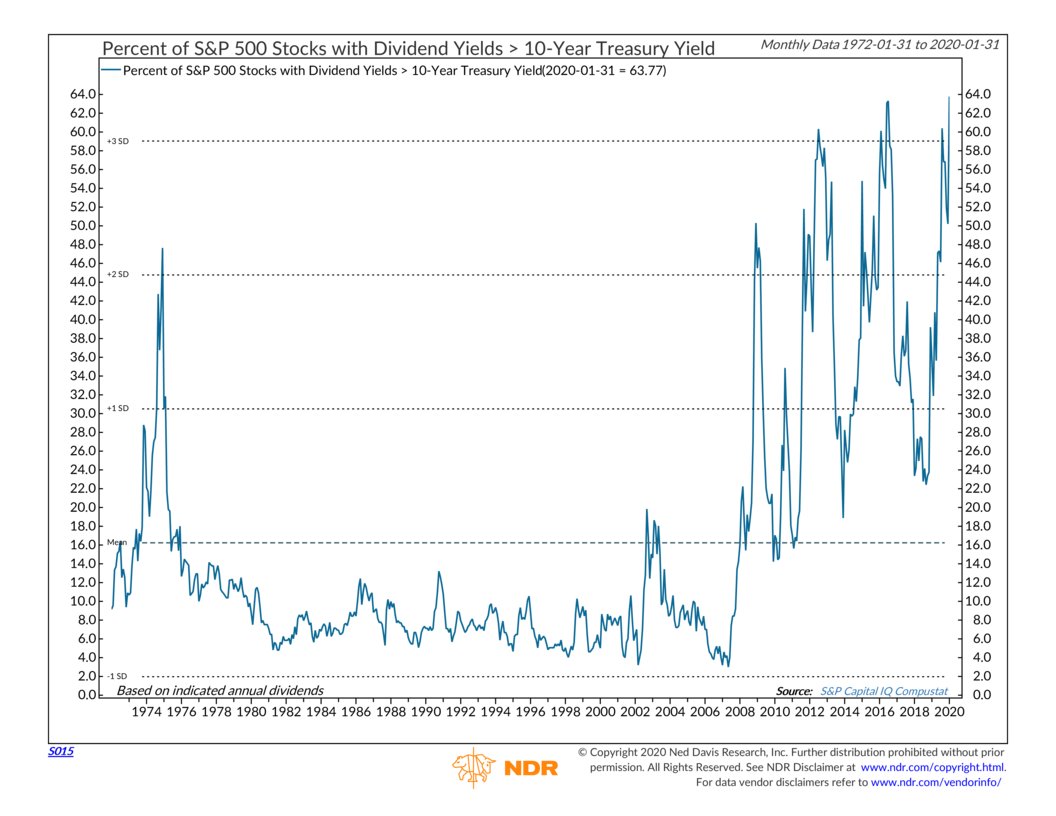
Looking just from the perspective of yields, that does present a case of riskier assets offering higher returns, and does suggest health to this market. Though… I admit that I share the skeptic’s view of the fundamentals.