I SPY a short?
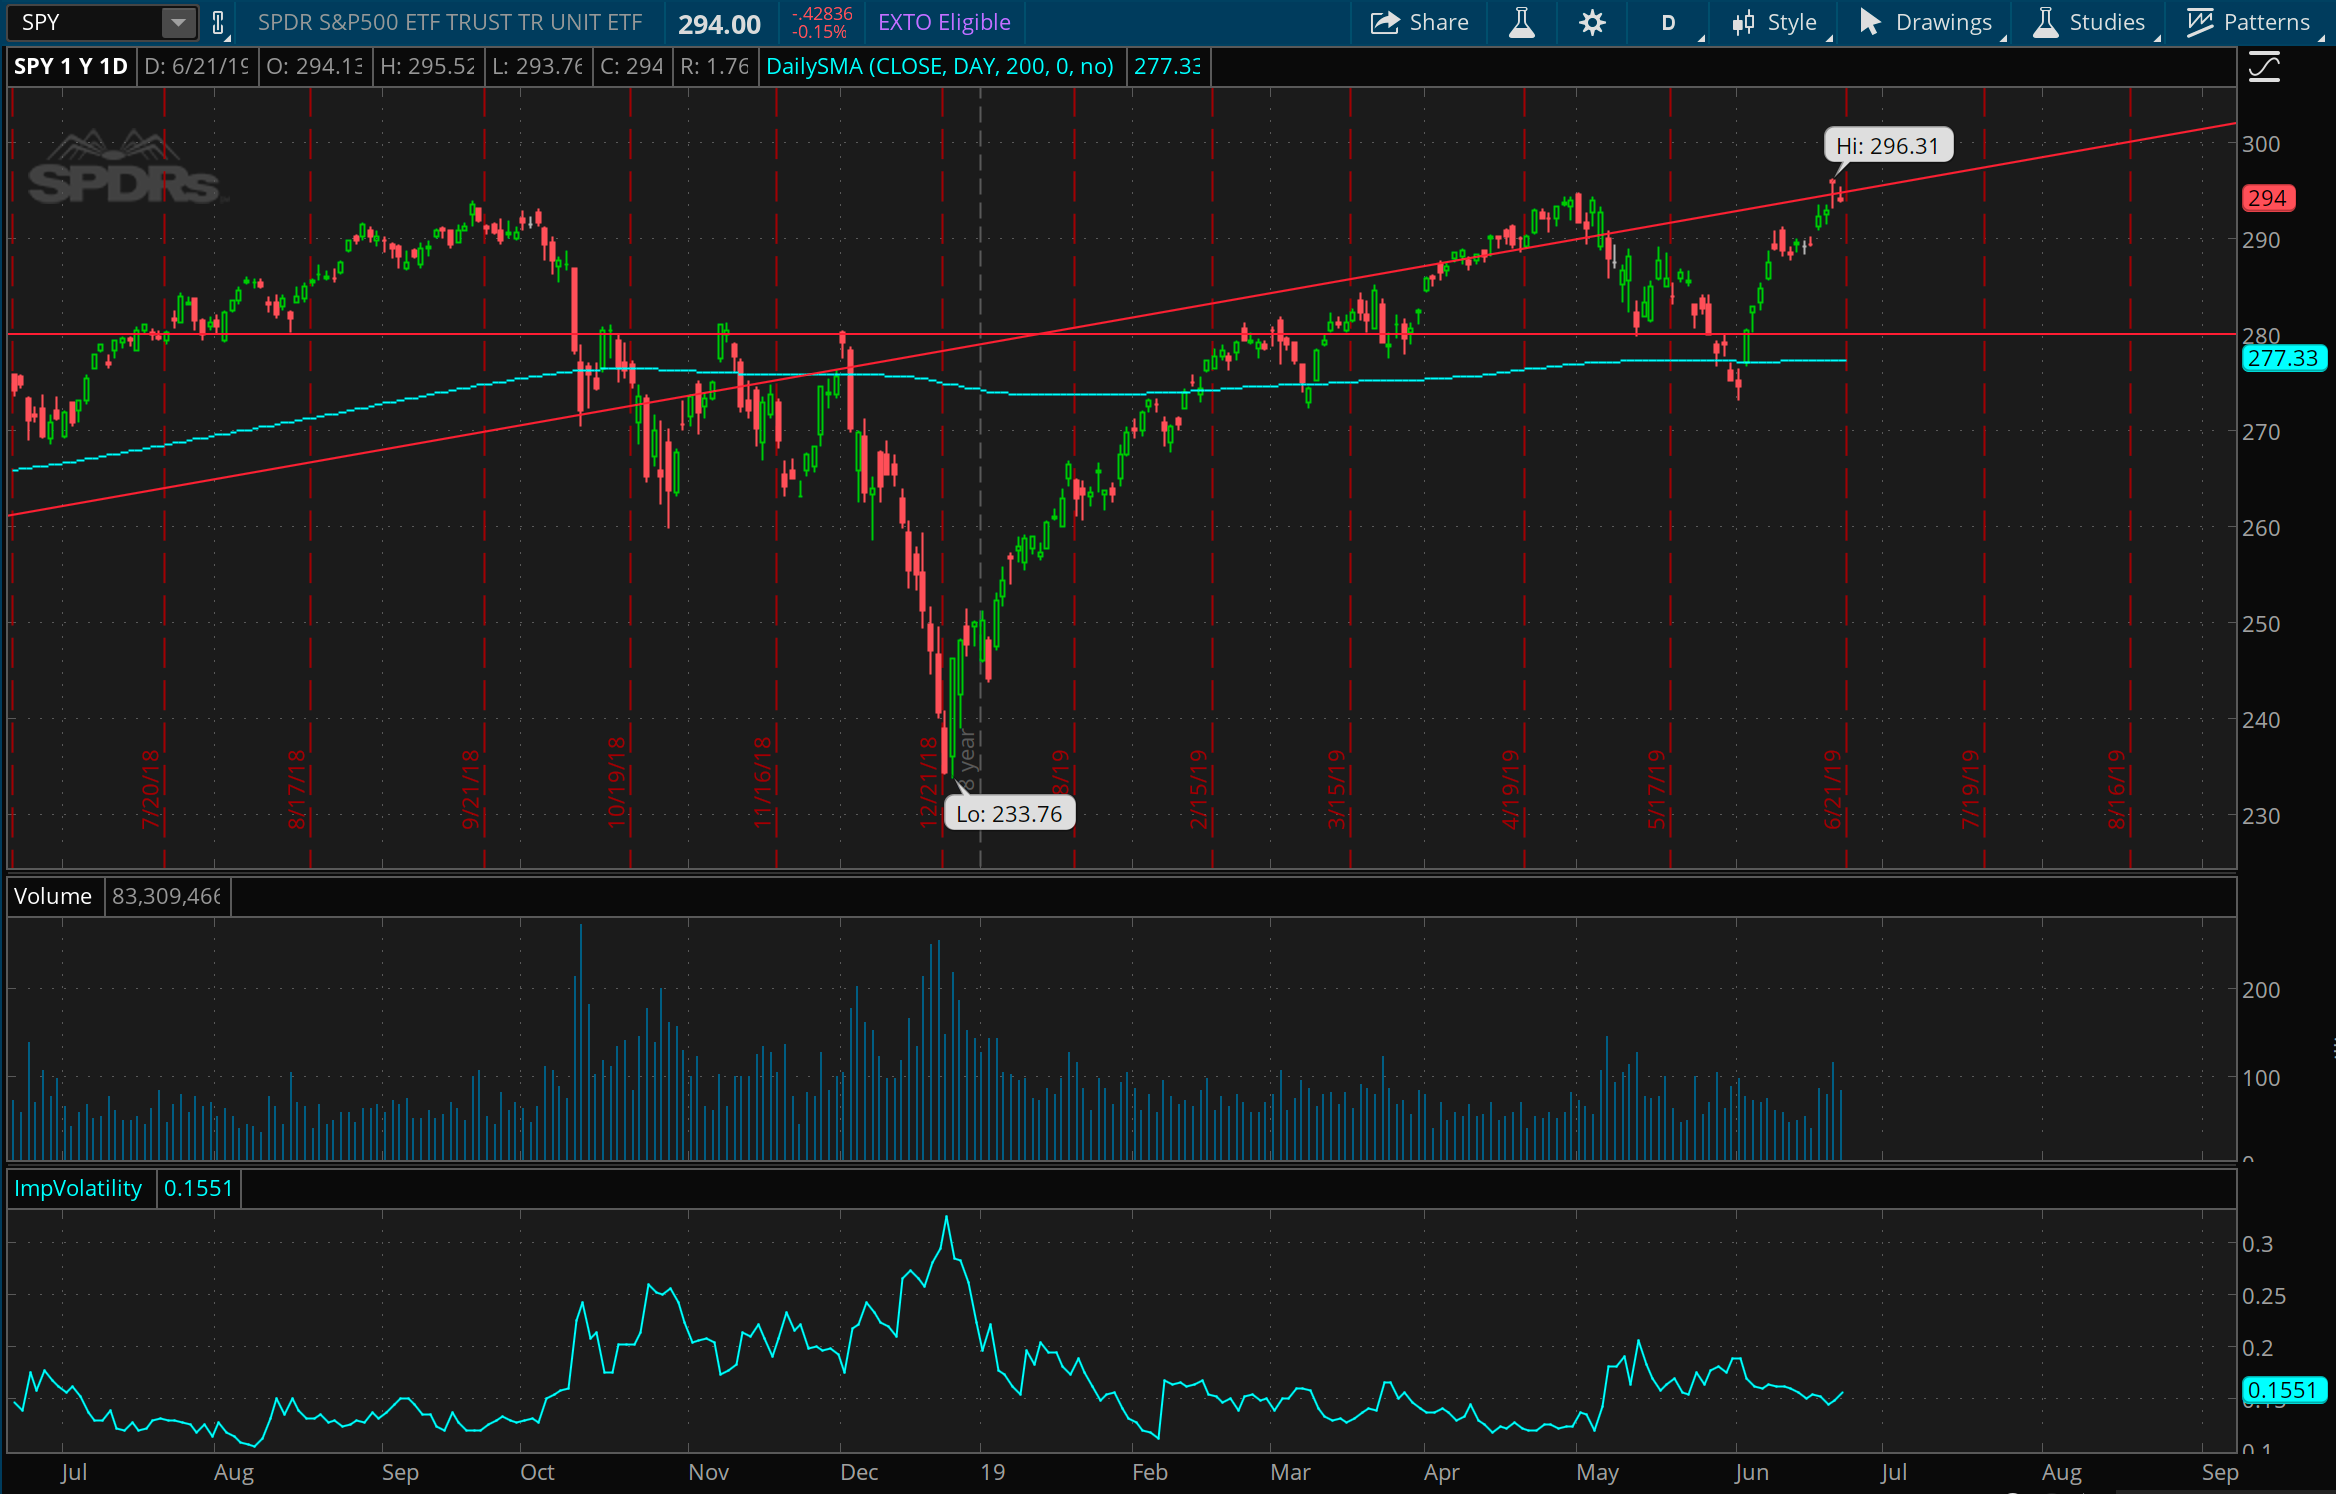
How can you not want to short the market here? Even just a little. After a lull last week, this week took the market to even loftier levels. In fact, the market registered a new all time high this week, which is always fun… but also tempting. I do think this is the higher end of a range for the market, and at this point, as I’ve said for the past couple weeks but now really mean it, I think there’s more room to the downside than the upside over the next several weeks. What follows is a bunch of short positions in individual stocks, to that end.
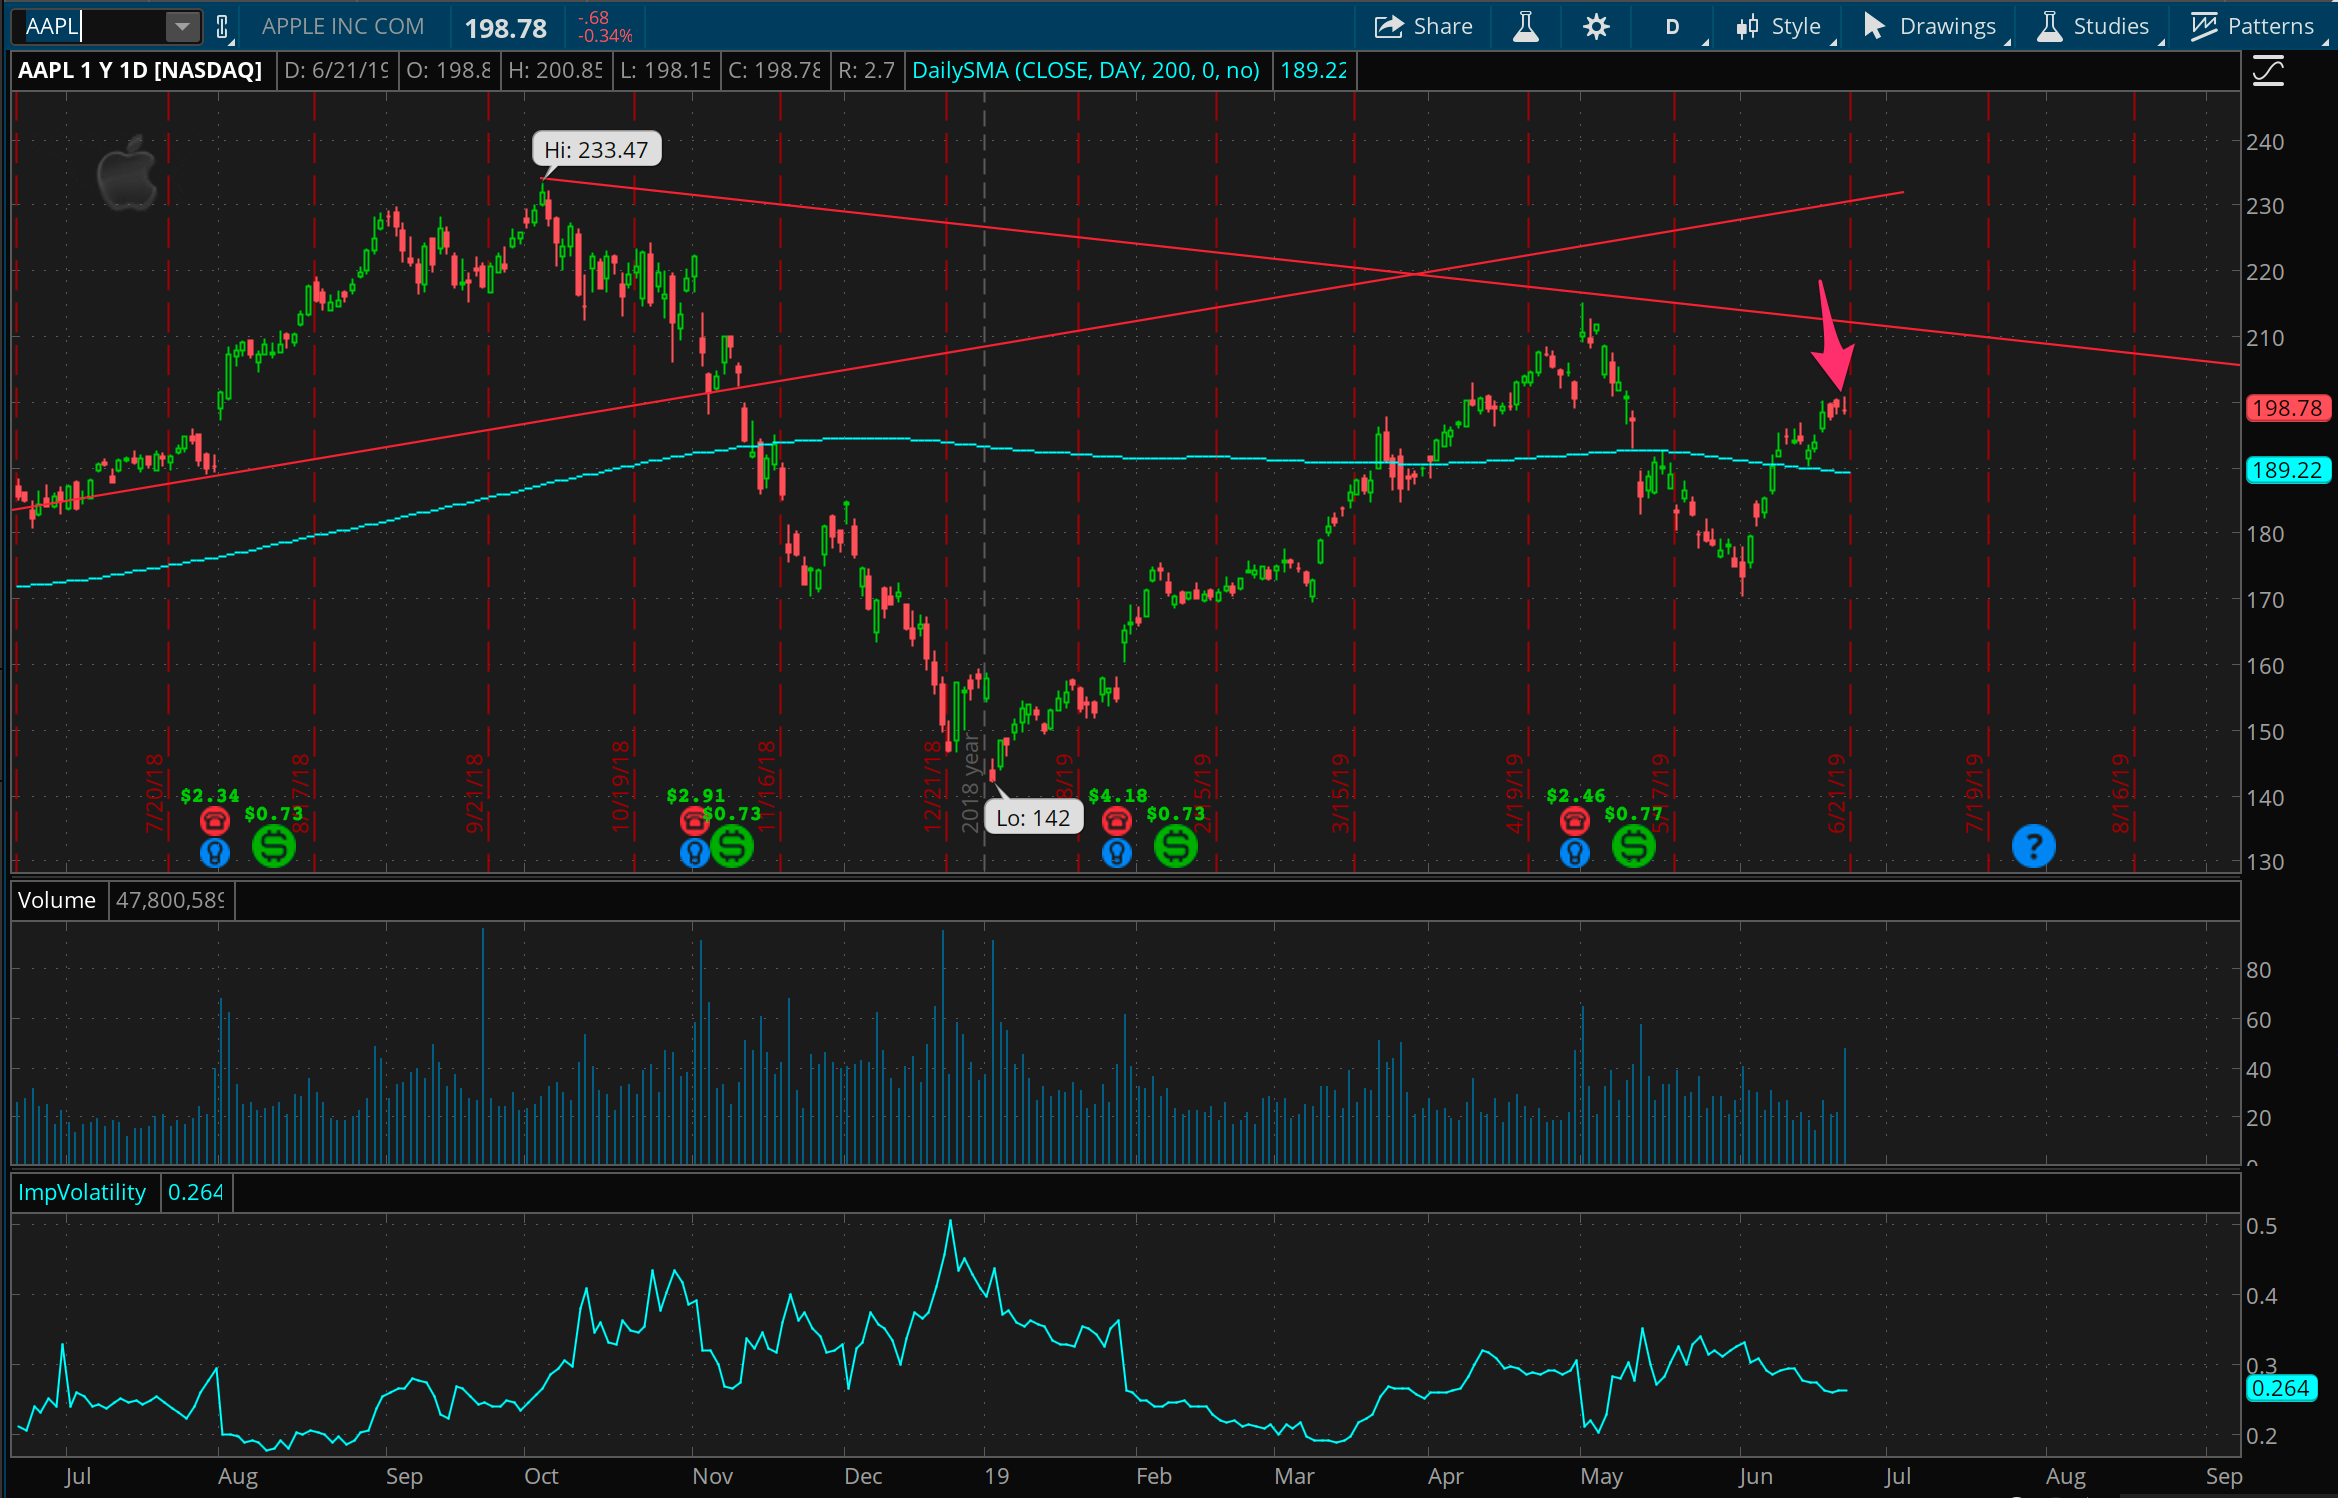
Take a bite of the AAPL
After a pretty clean short of AAPL back in May, it’s time to take another bite. This could absolutely head higher, perhaps up towards 210 next, but this is also where I’ve put the trade, betting on resistance by selling a call spread at 210. I’m looking for another quick, low stress win by putting the strike out that far above here and the market looking sketchy. We’ll see!
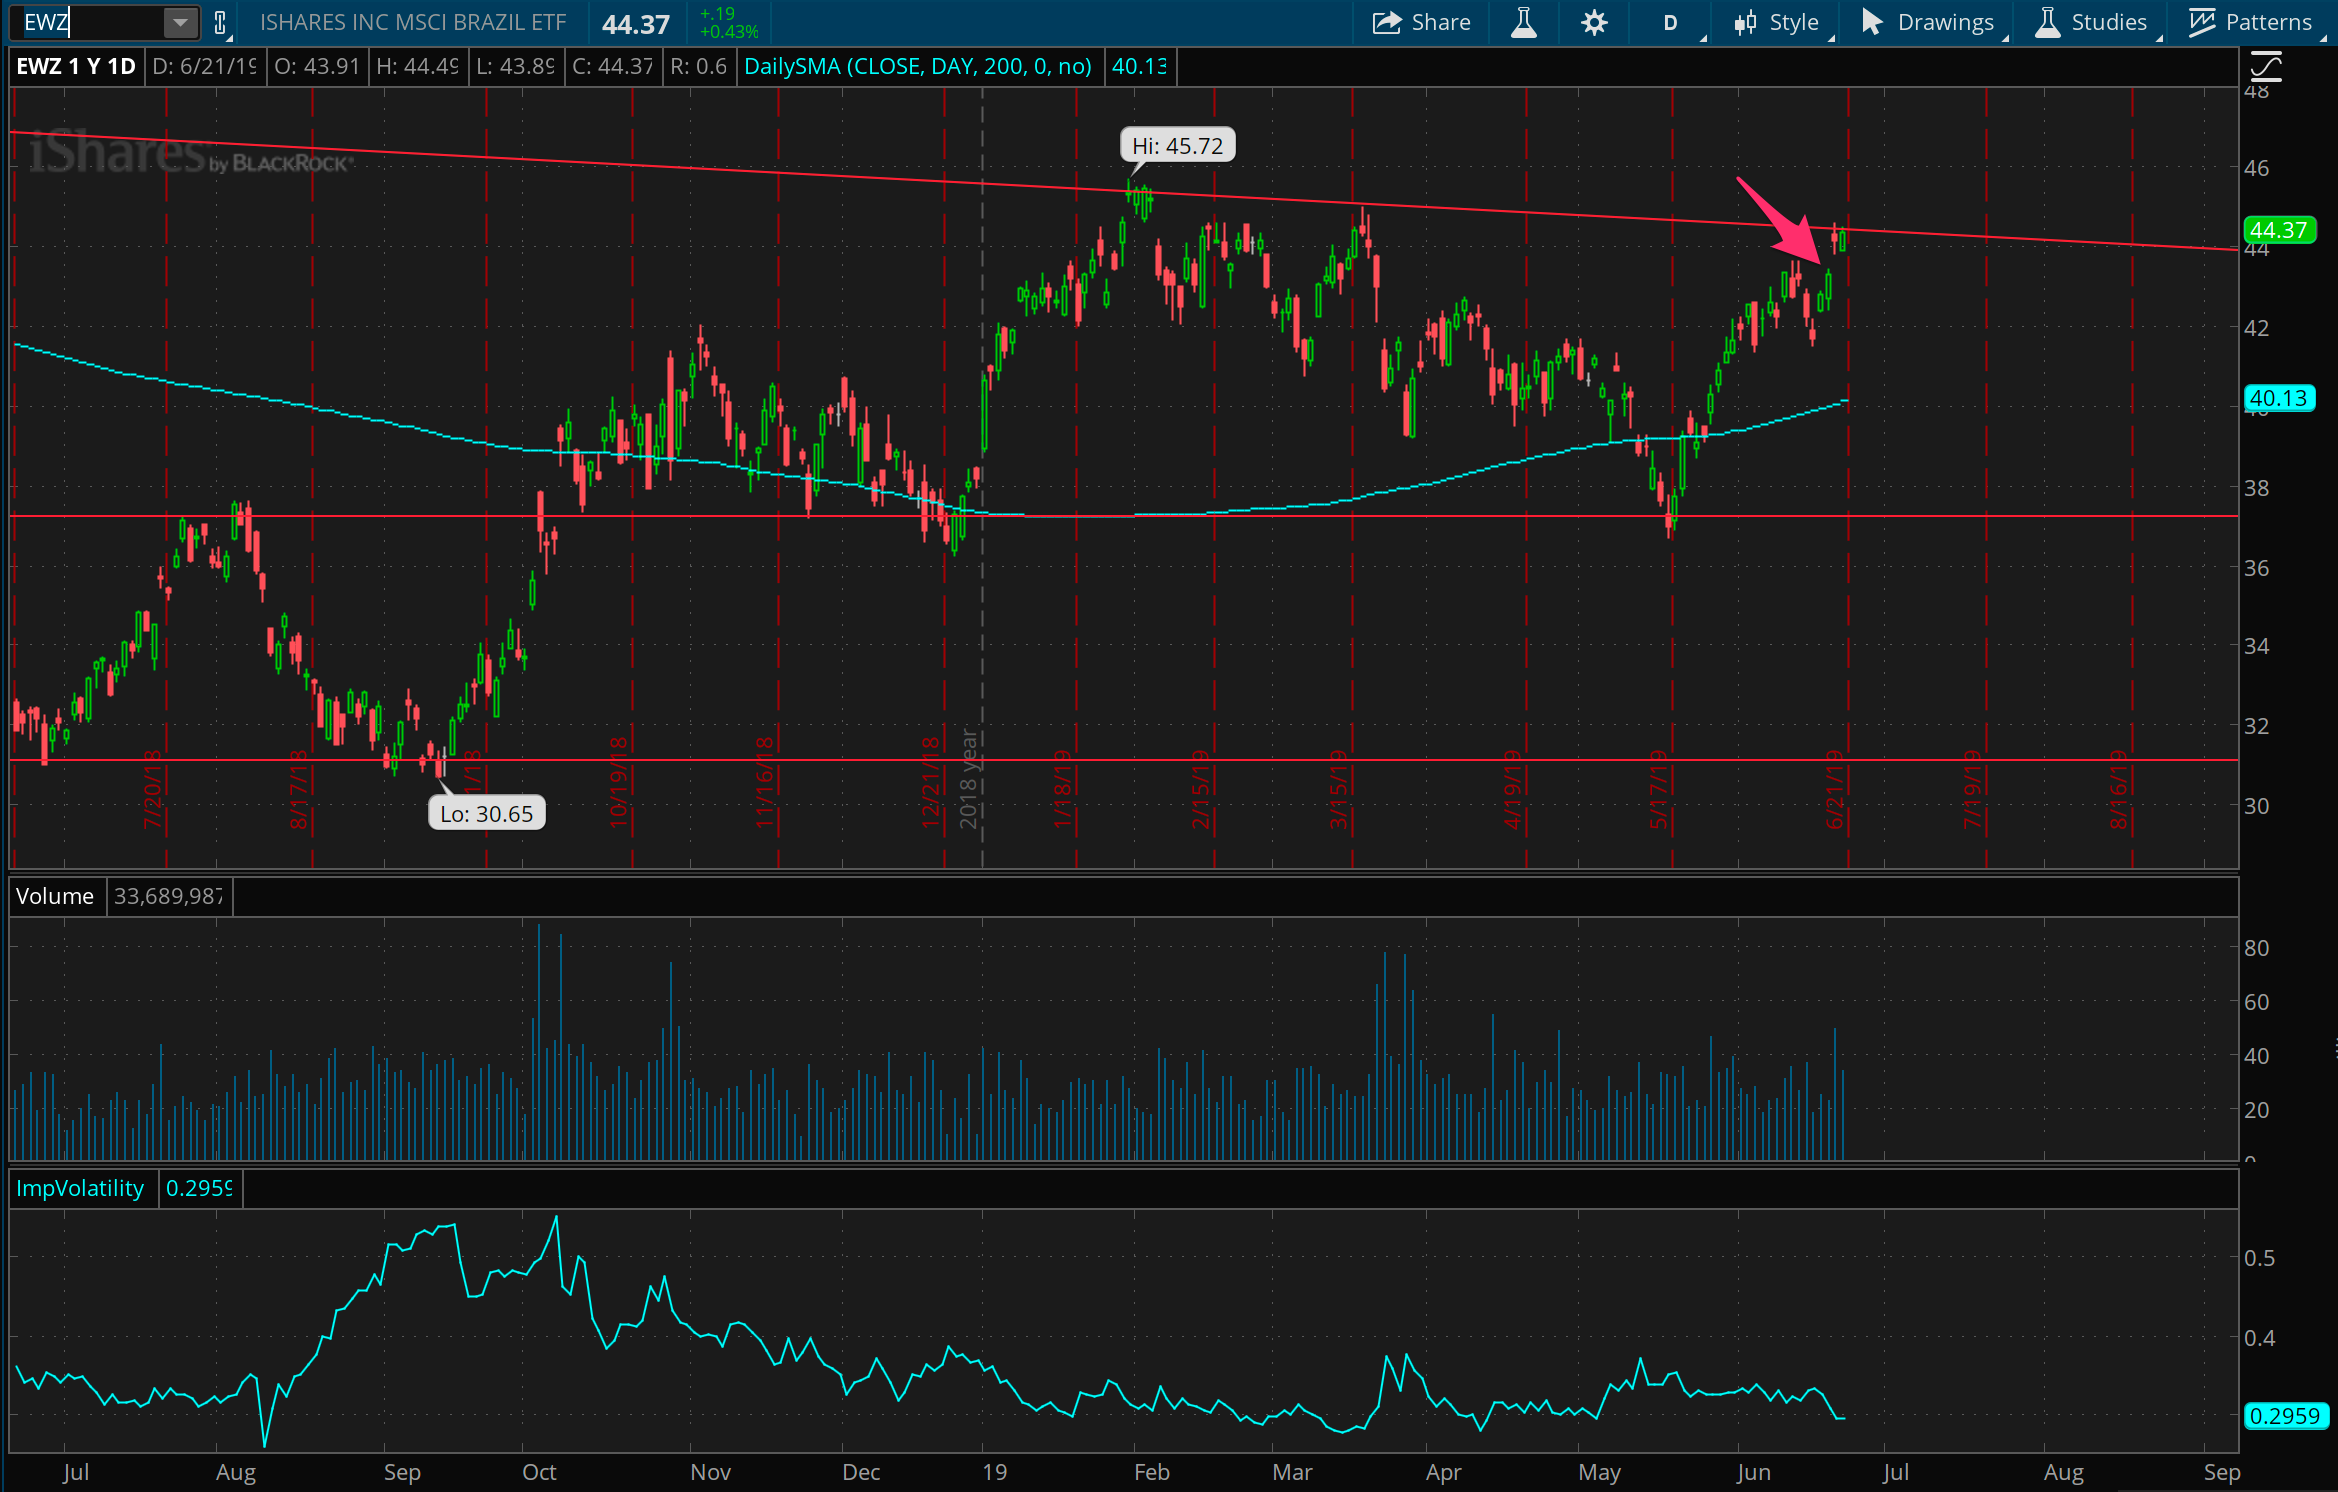
Looking for a Brazilian breakdown
Last week, we looked at how EWZ has reached some important resistance levels. I think this 44 - 46 price level does represent an area that could pose problems for EWZ to break through, and so, after missing my chance to put on this trade last week, I stepped in to a defined risk short position with a short call spread at 44.
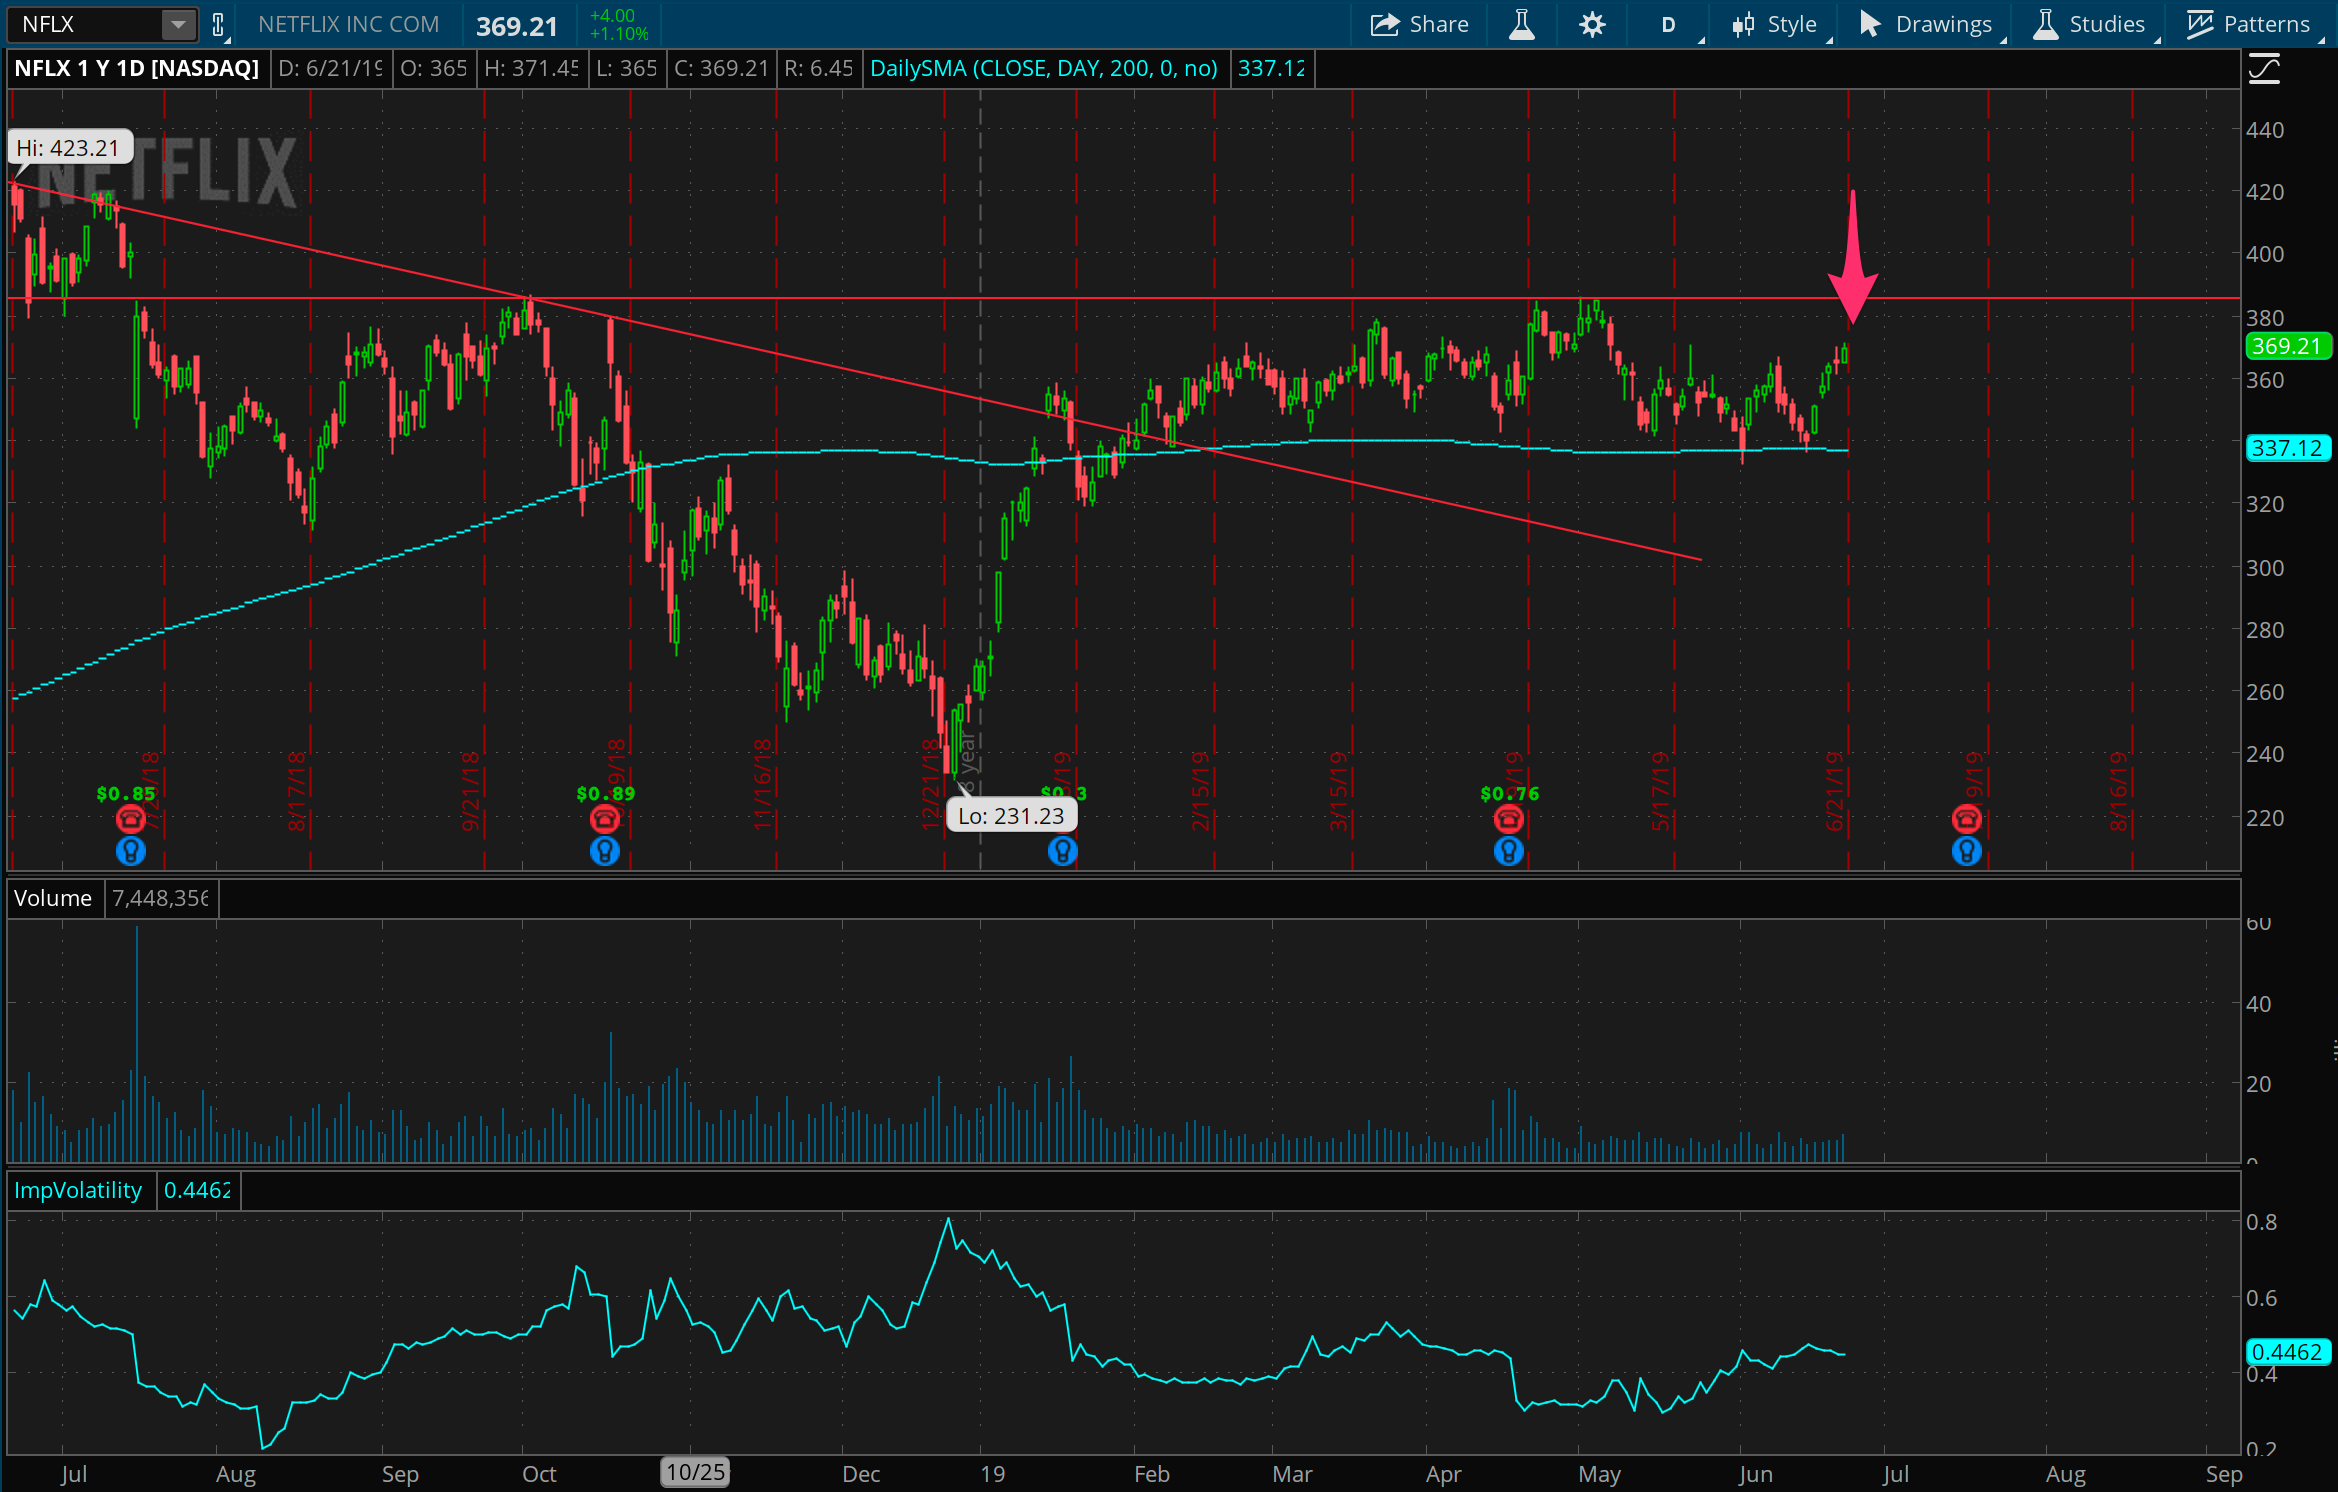
The shorter side of NFLX
We’ve been watching this range in NFLX for weeks and weeks, as it bounces between 340 and 380 now since March. After turning around a quick trade on the short side a few weeks back, it’s time to reload on this. It could, like then, be an impatient trade ultimately, but this level looks close enough for me to put on a short call spread at 380.
Still waiting on the financials
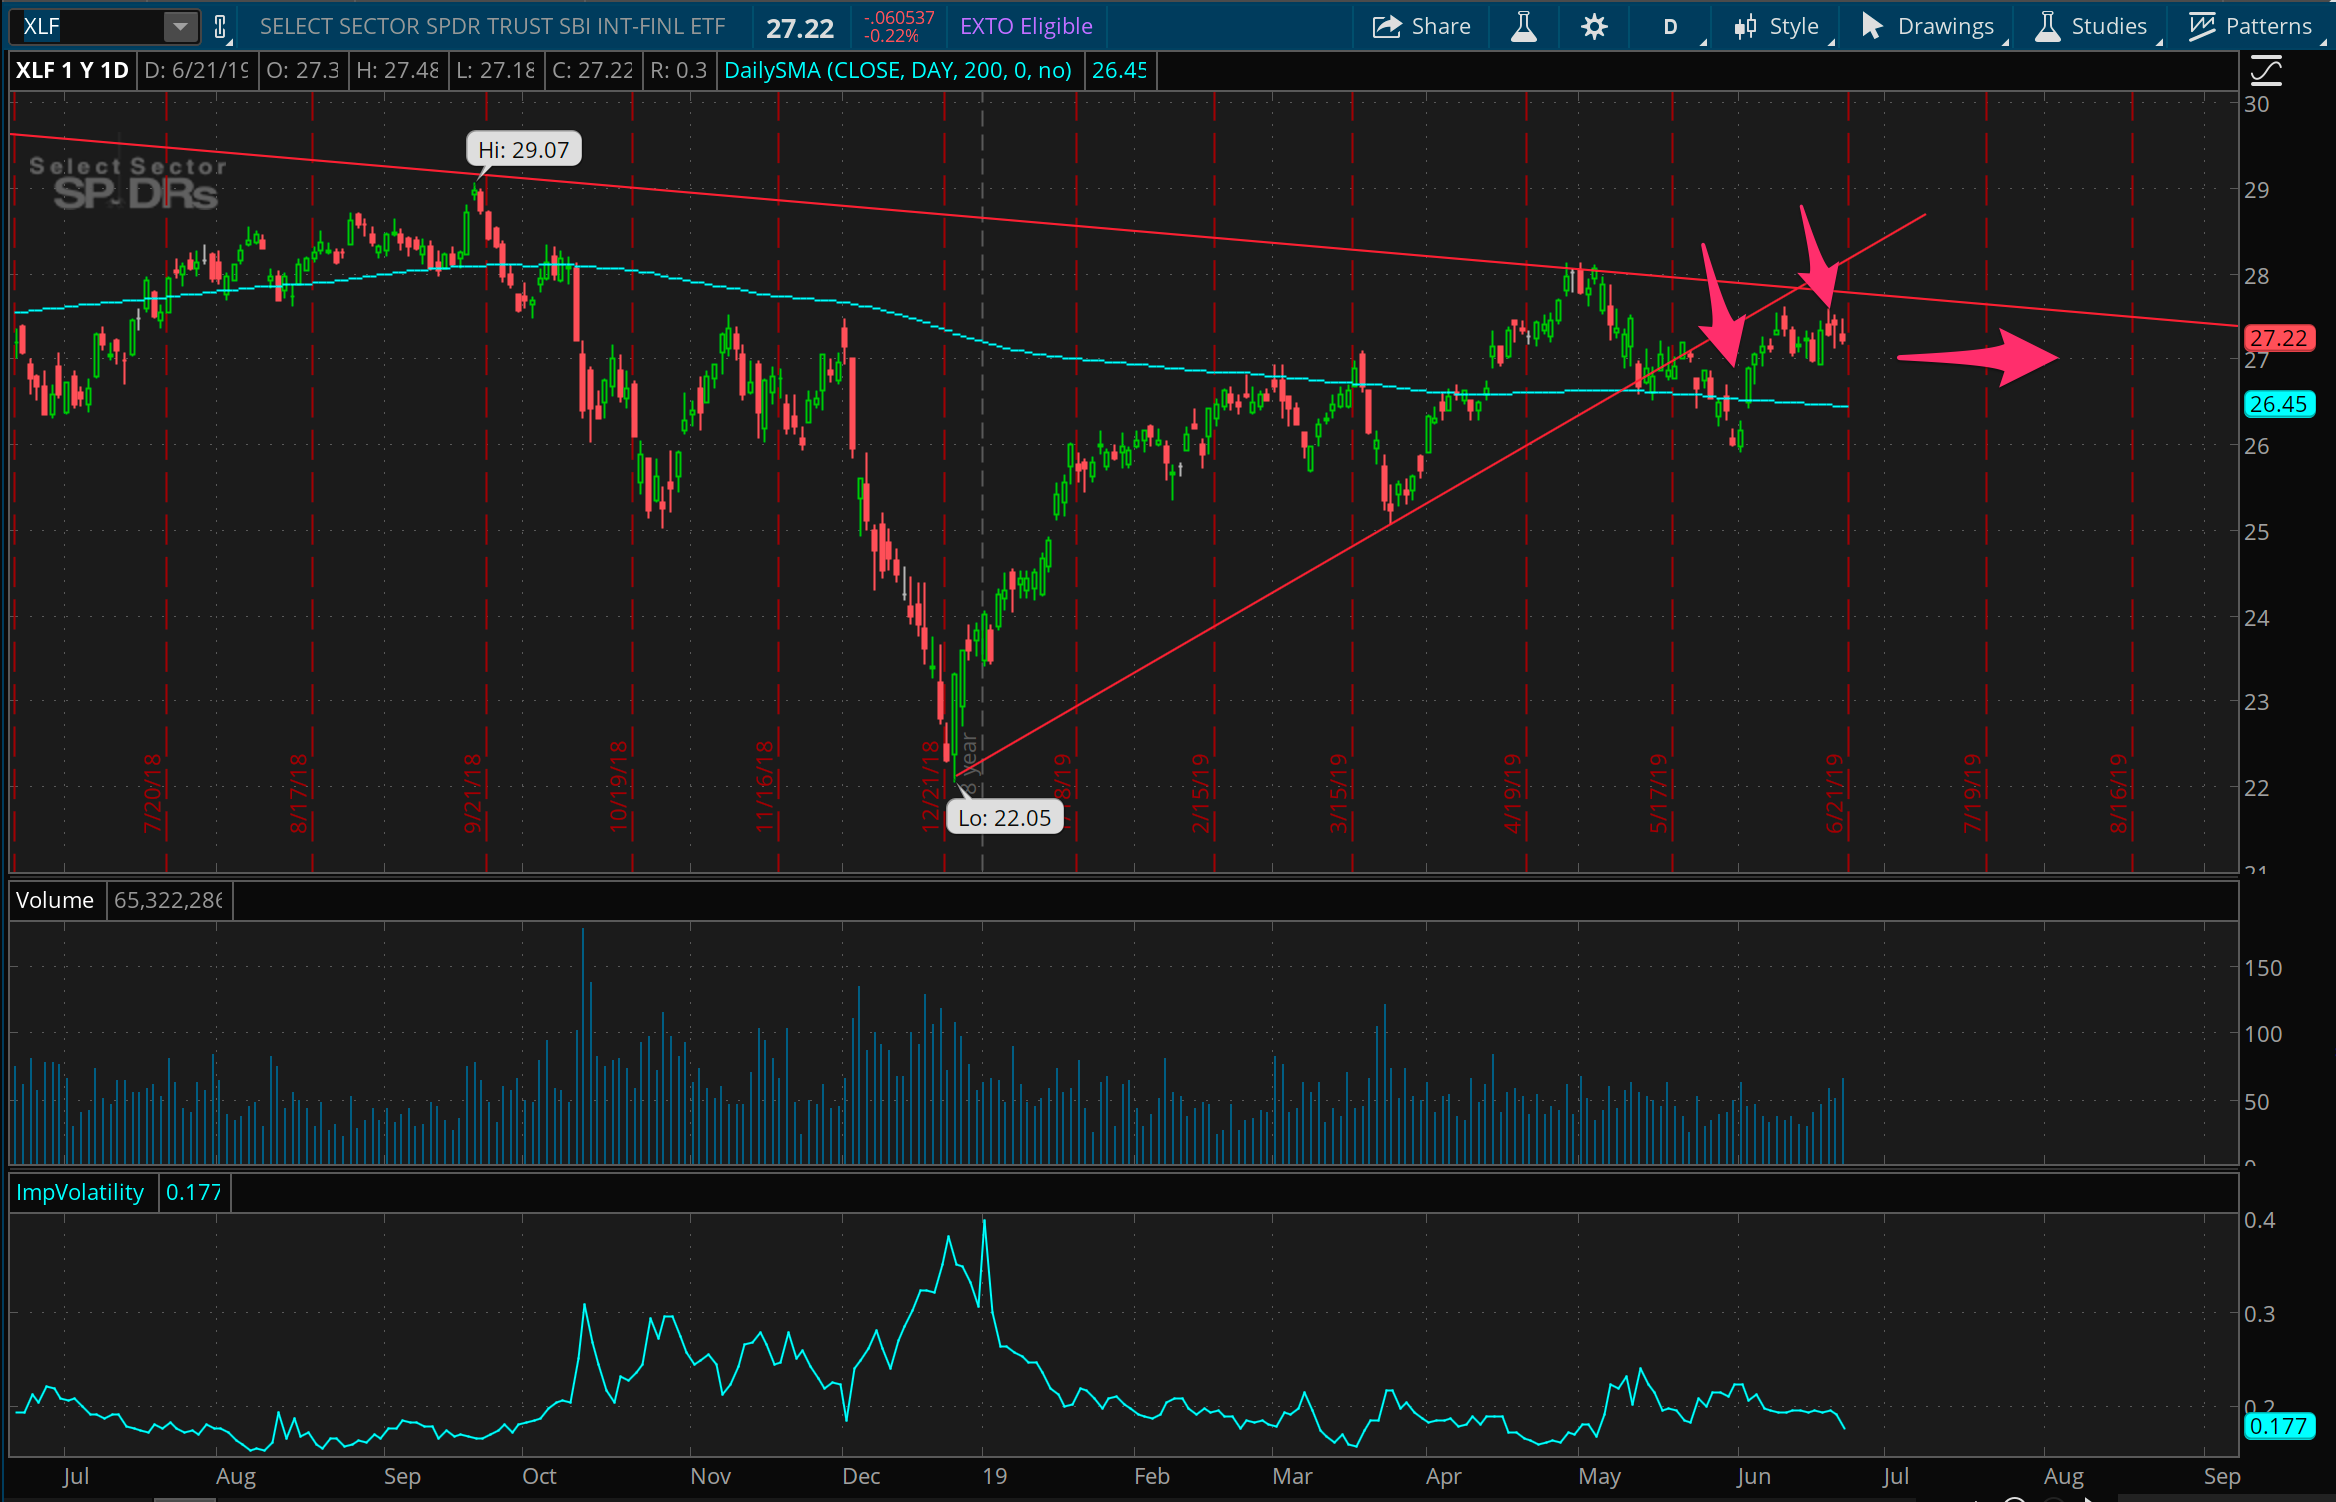
I’m still waiting for this XLF trade to work out, just like last week, but the waiting is fairly easy, as XLF continues to look to heavy. It’s struggling here at this long term overhead resistance, as hoped for. I’ve added to this trade this week, feeling more convicted by the price action we see and the height of the overall market.
The builder struggle
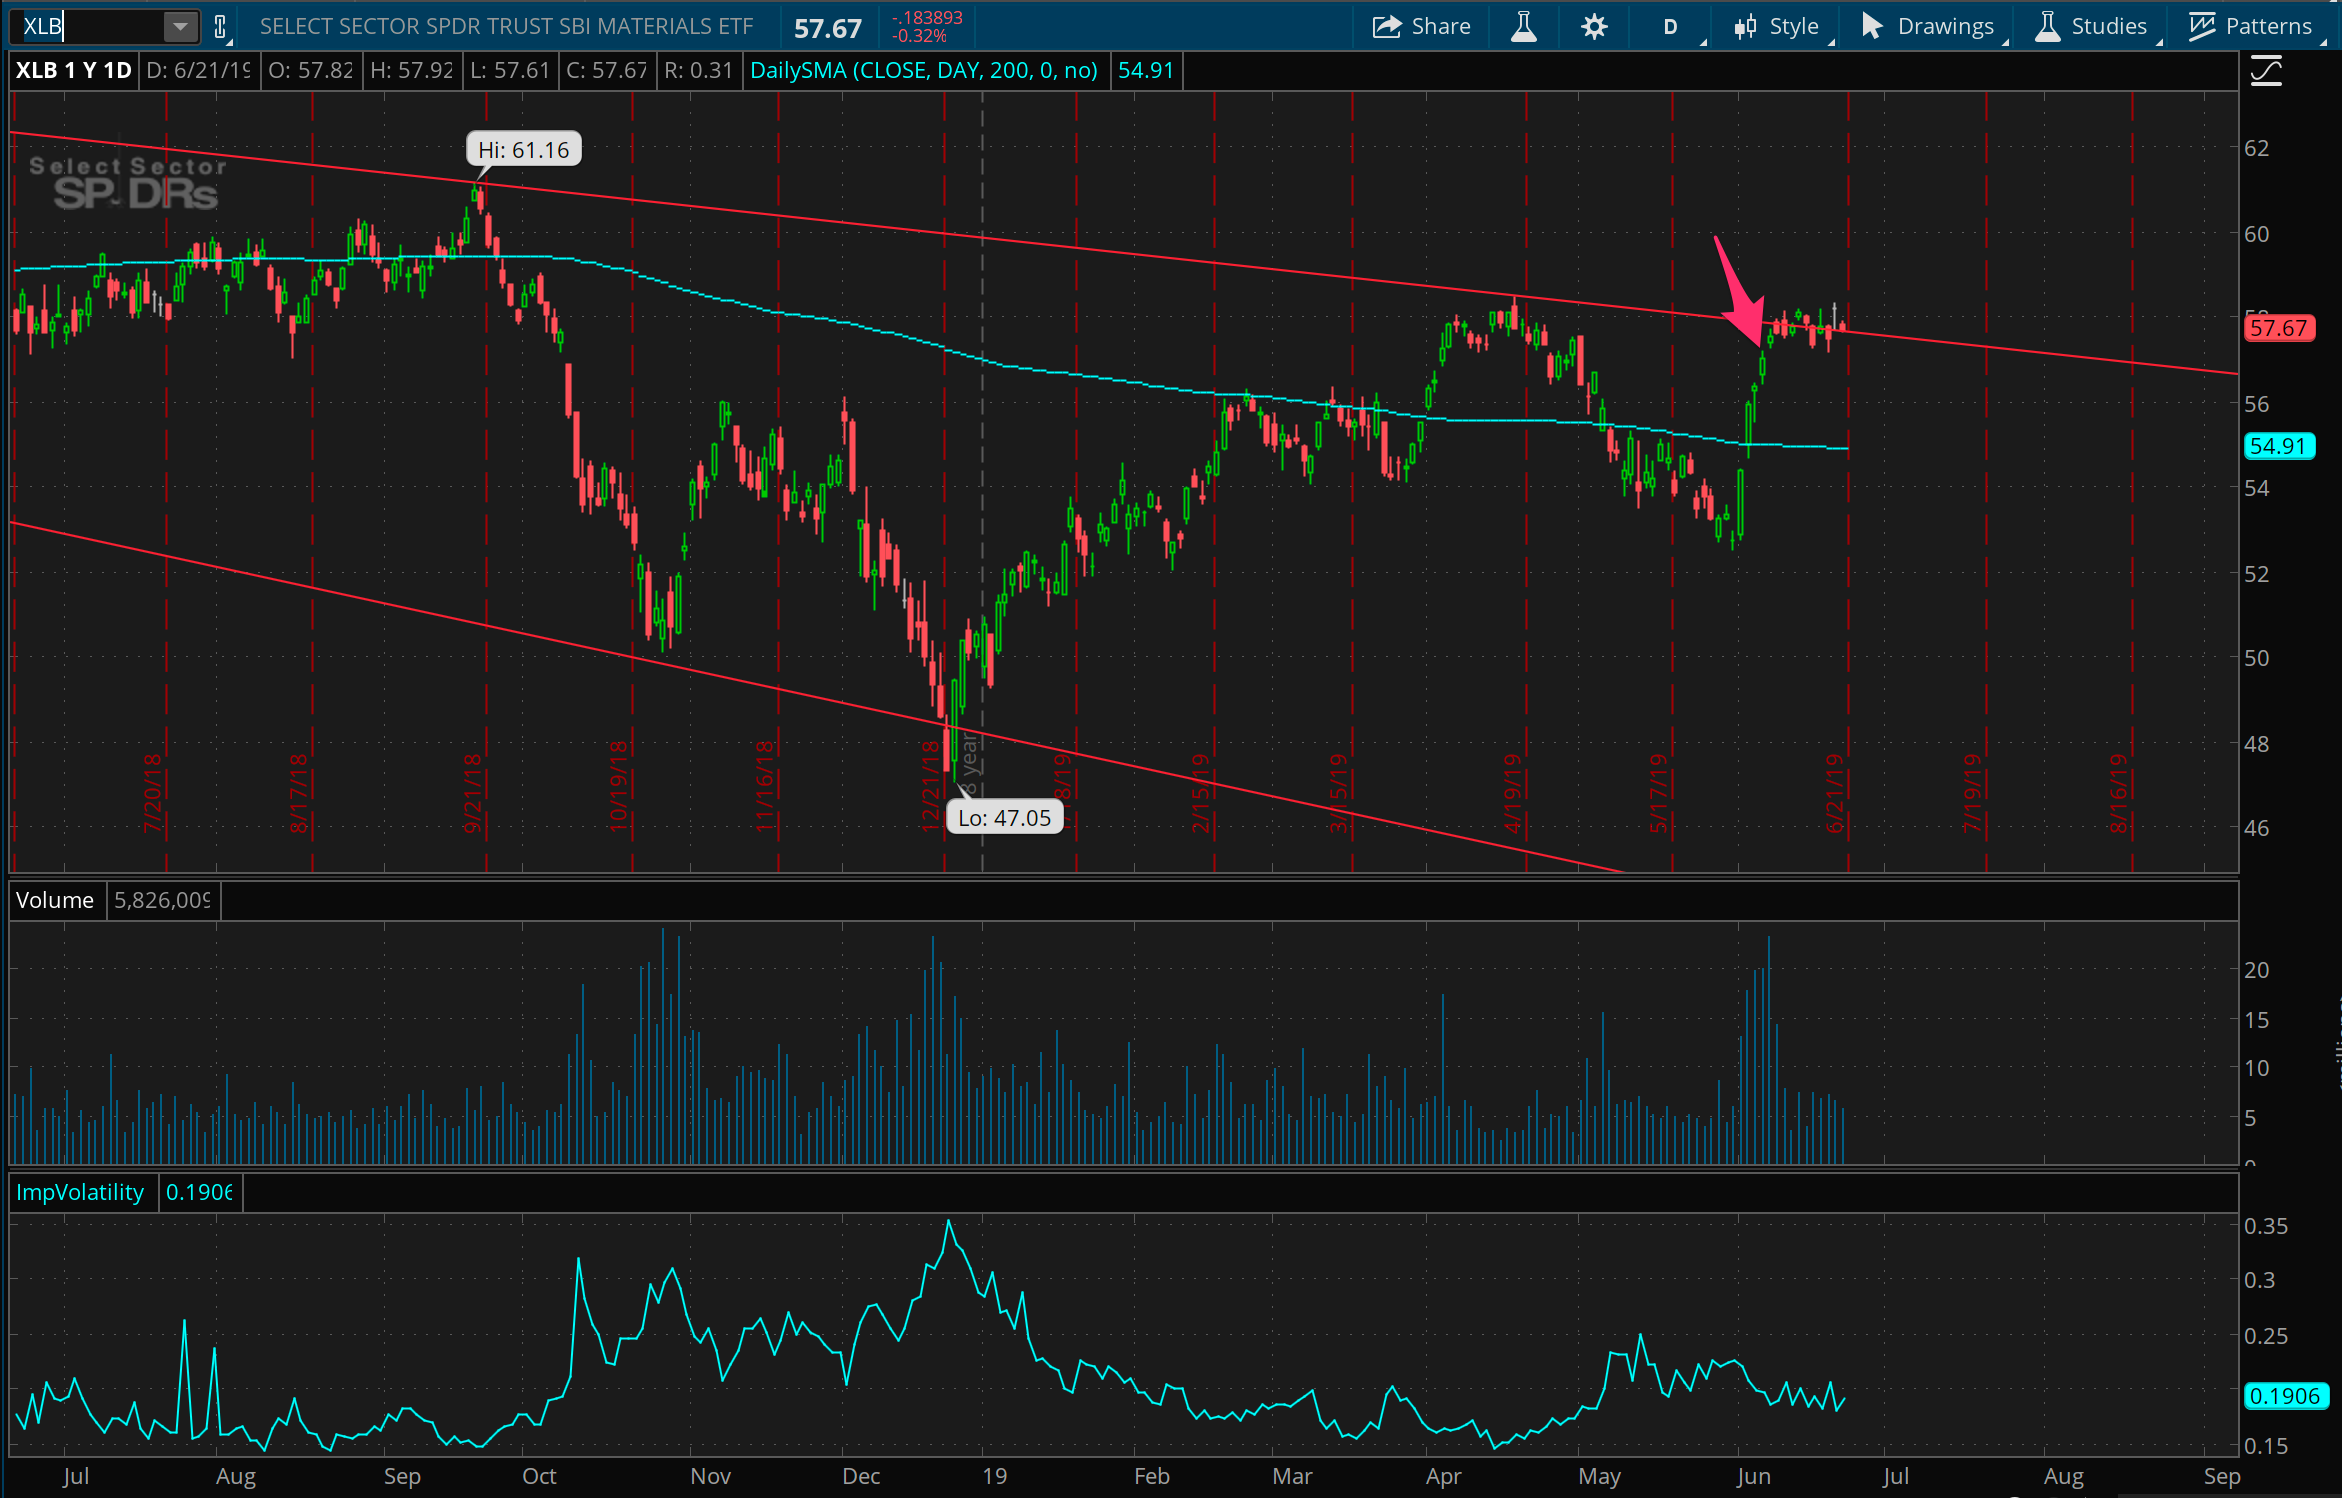
The SPDR builders sector ETF, XLB, is similarly struggling against overhead resistance here, and I’m happy to hang with this trade further for now. As mentioned last week, this is a more aggressive all-out short, so this could be a valuable trade to have on if we see some accelerated movement to the downside.
Oil prices are staying… fun?
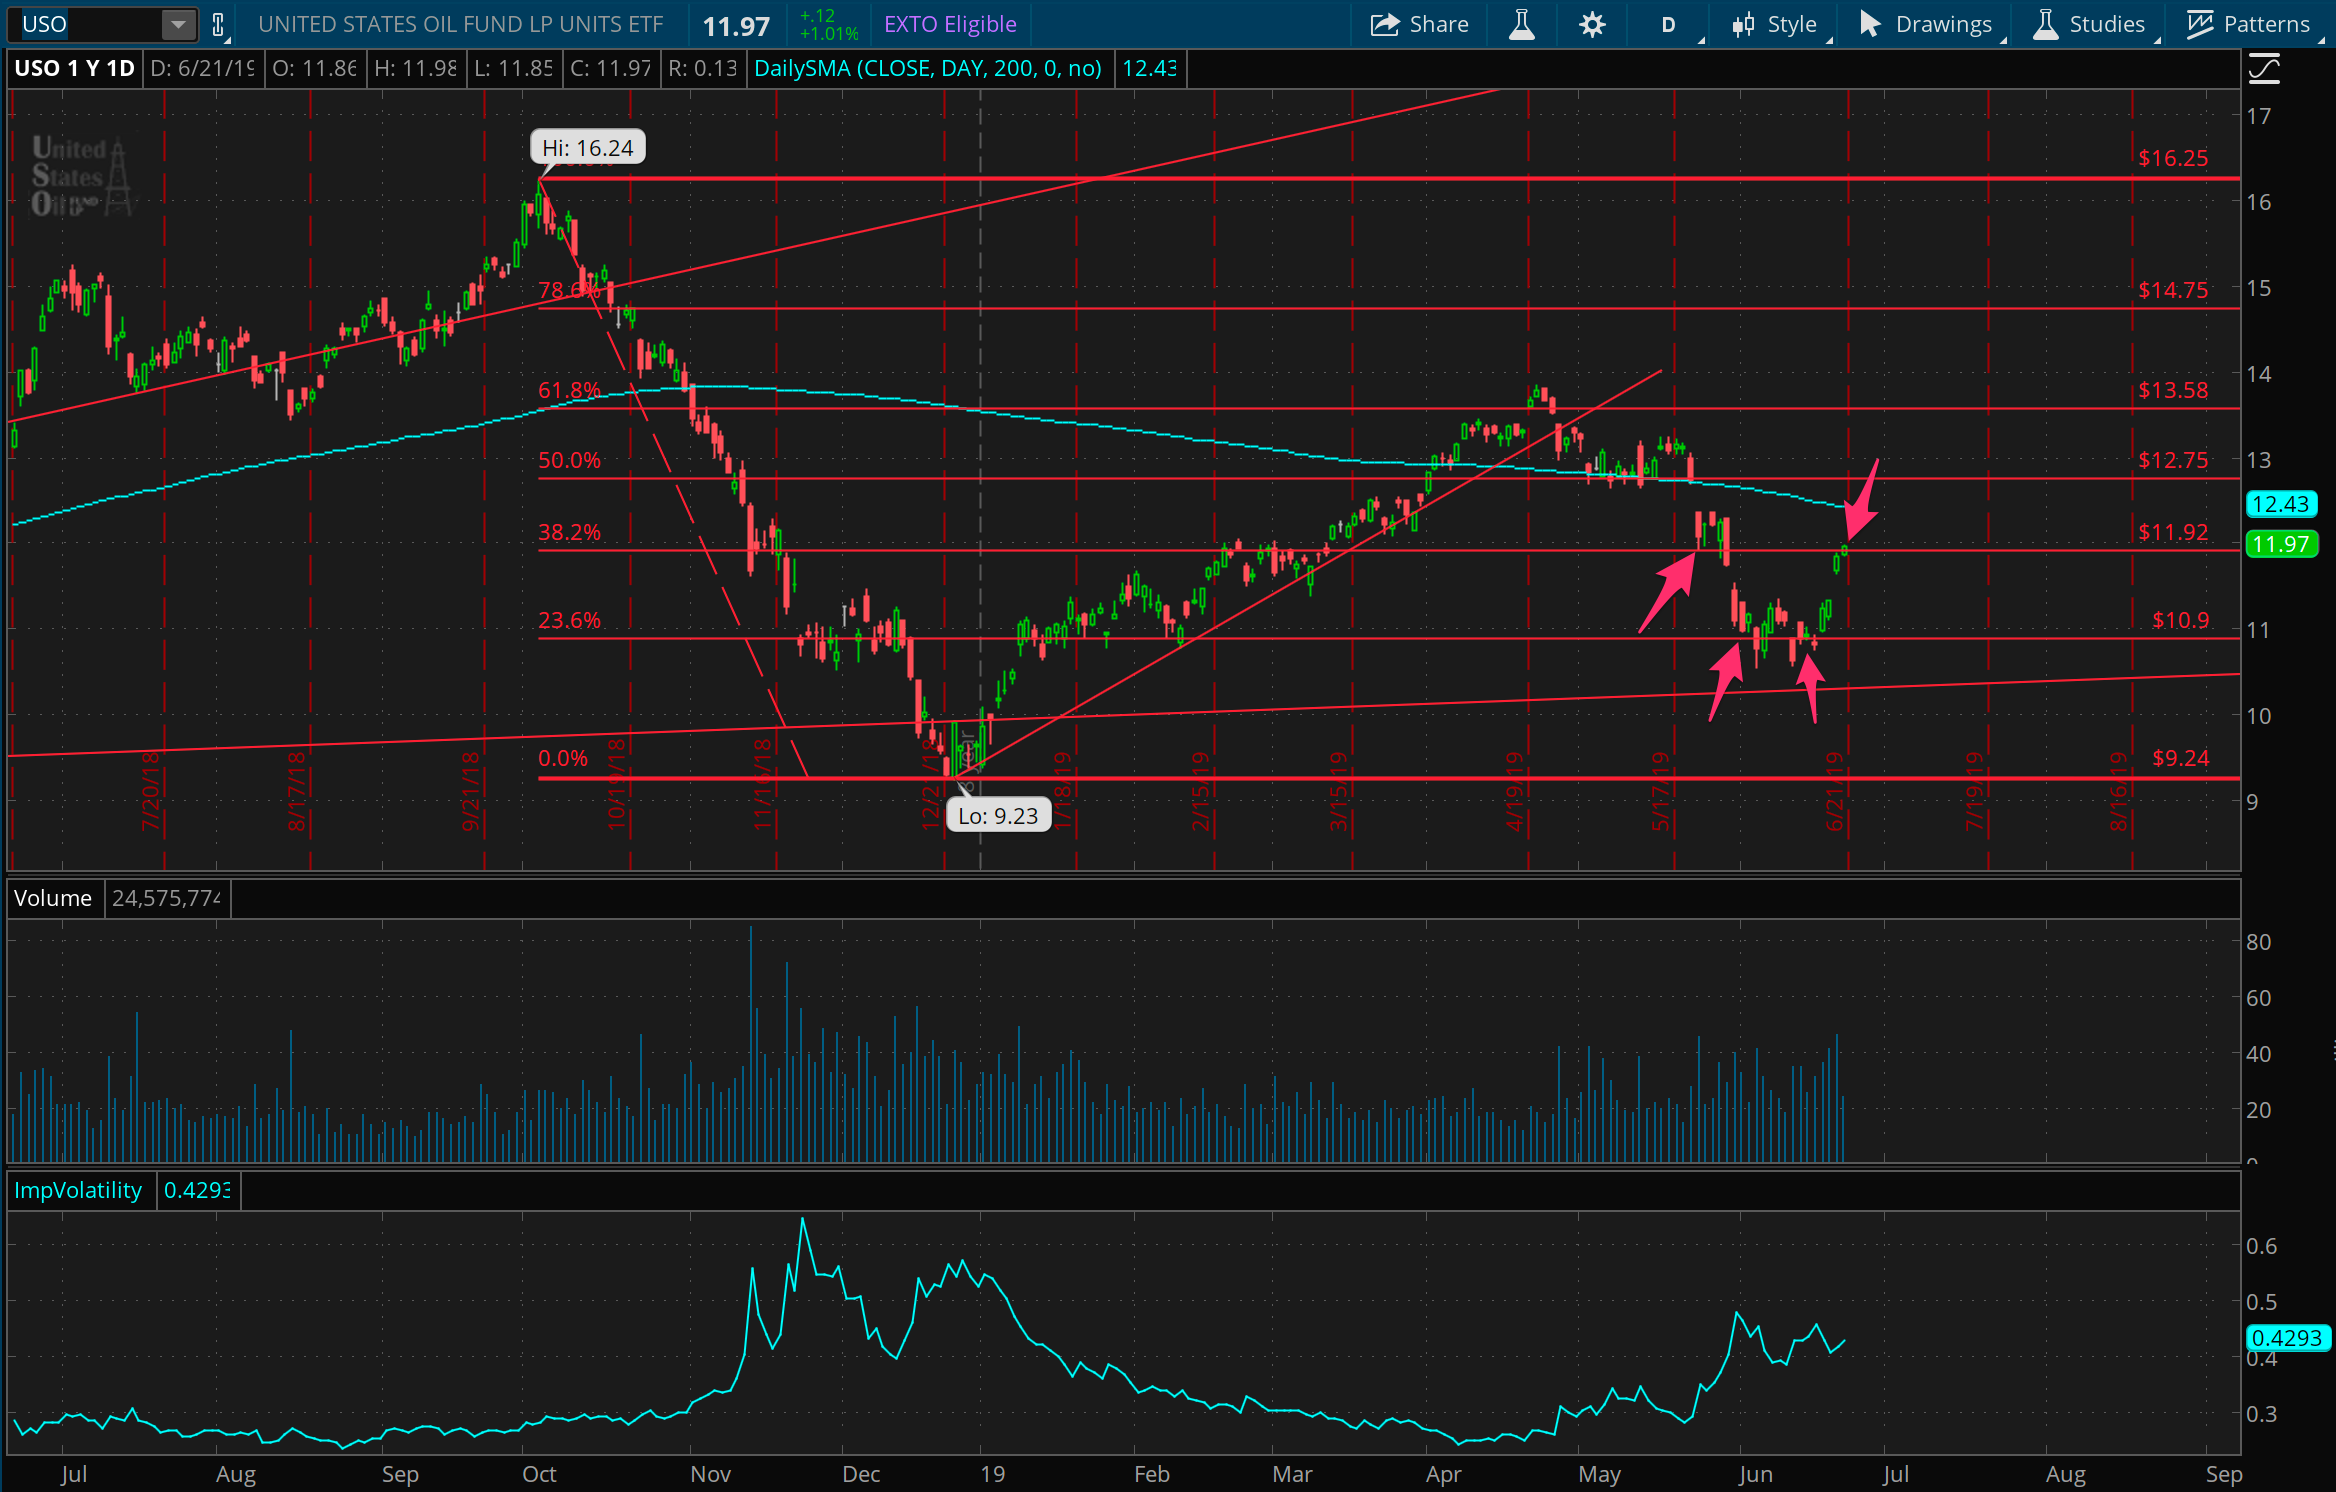
The USO trade we’ve been watching together for several weeks now is finally getting a little simpler. After a lot of gyrations with betting on support (by selling puts) and balancing the trade (by selling calls), I moved to a more long stance last week, and that repositioning worked out well this week. The last downward arrow in the above chart is indicating me taking off about half of this position, taking profits from the prior support trades when USO moved down to 11 over the past few weeks. Still waiting out for the initial trades around 12 to show a better profit before closing them out.
An imminent TSLA short?
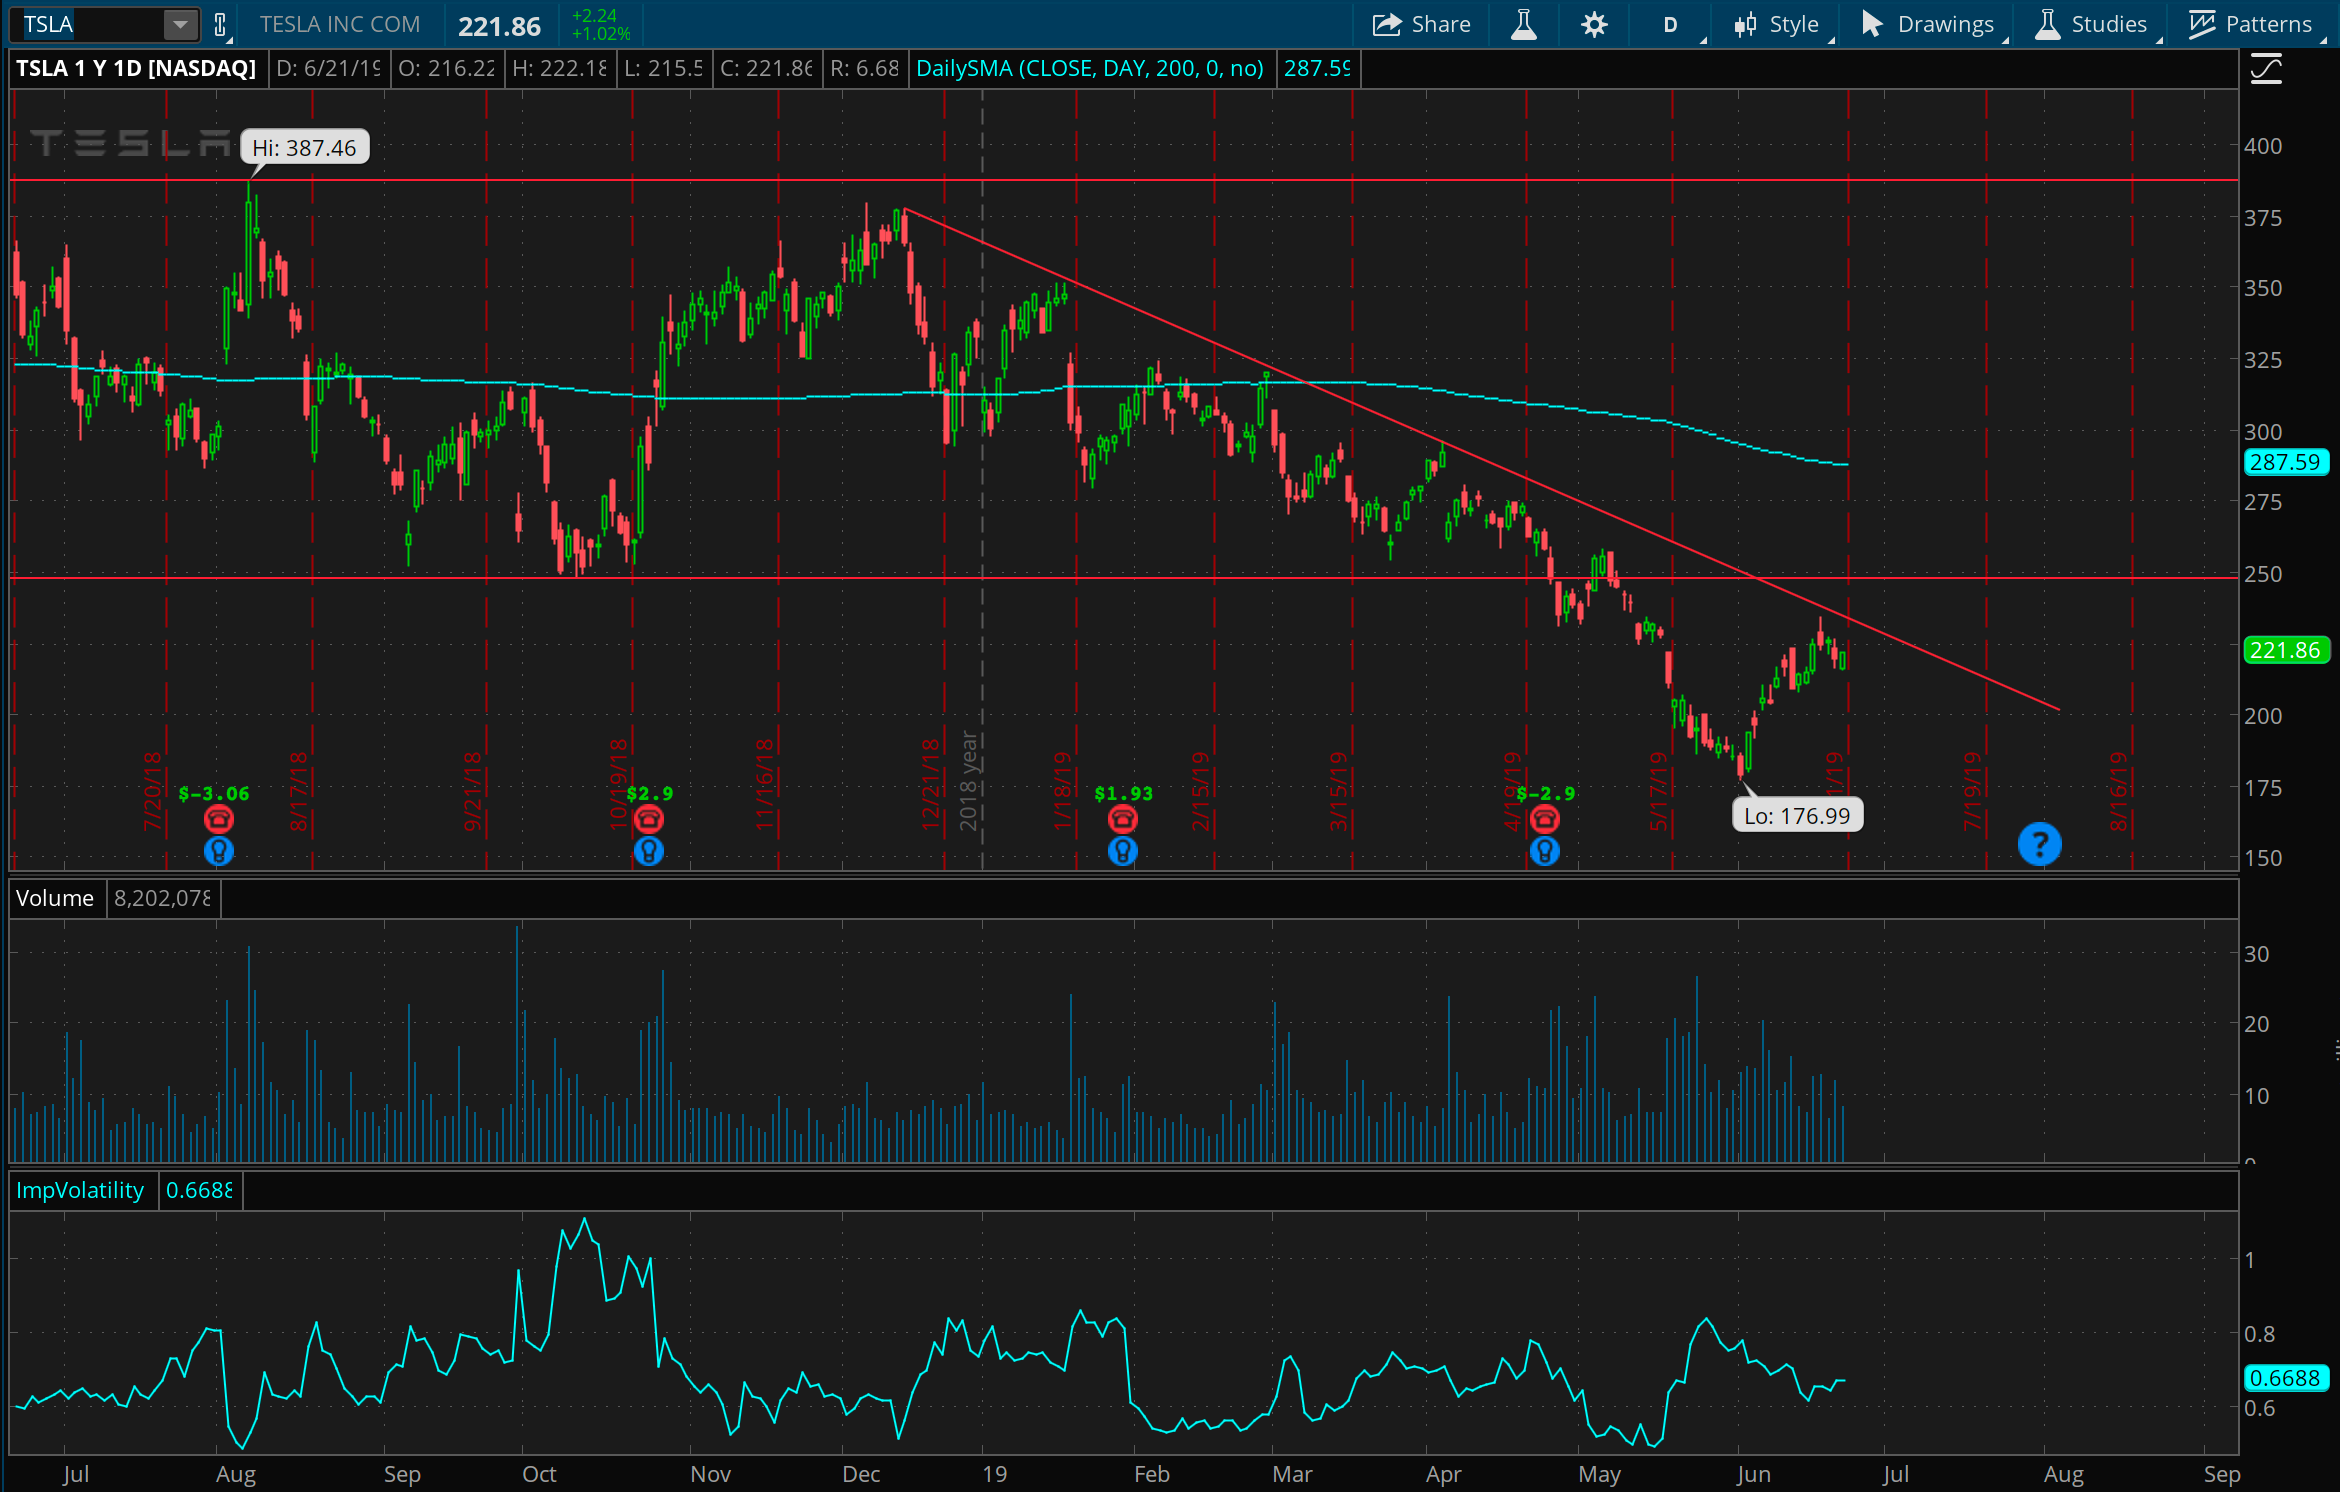
I’m not scared to admit that I’m scared to short Tesla, generally. Who knows what piece of news could take it higher than a SpaceX rocket next week? But that said, it does look quite ripe for a (defined risk!) short trade according to this downward trend it’s been subject to for all of 2019. It’s fascinating to see this along with many other individual stocks tell a similar story of resistance, just like the overall market indexes.
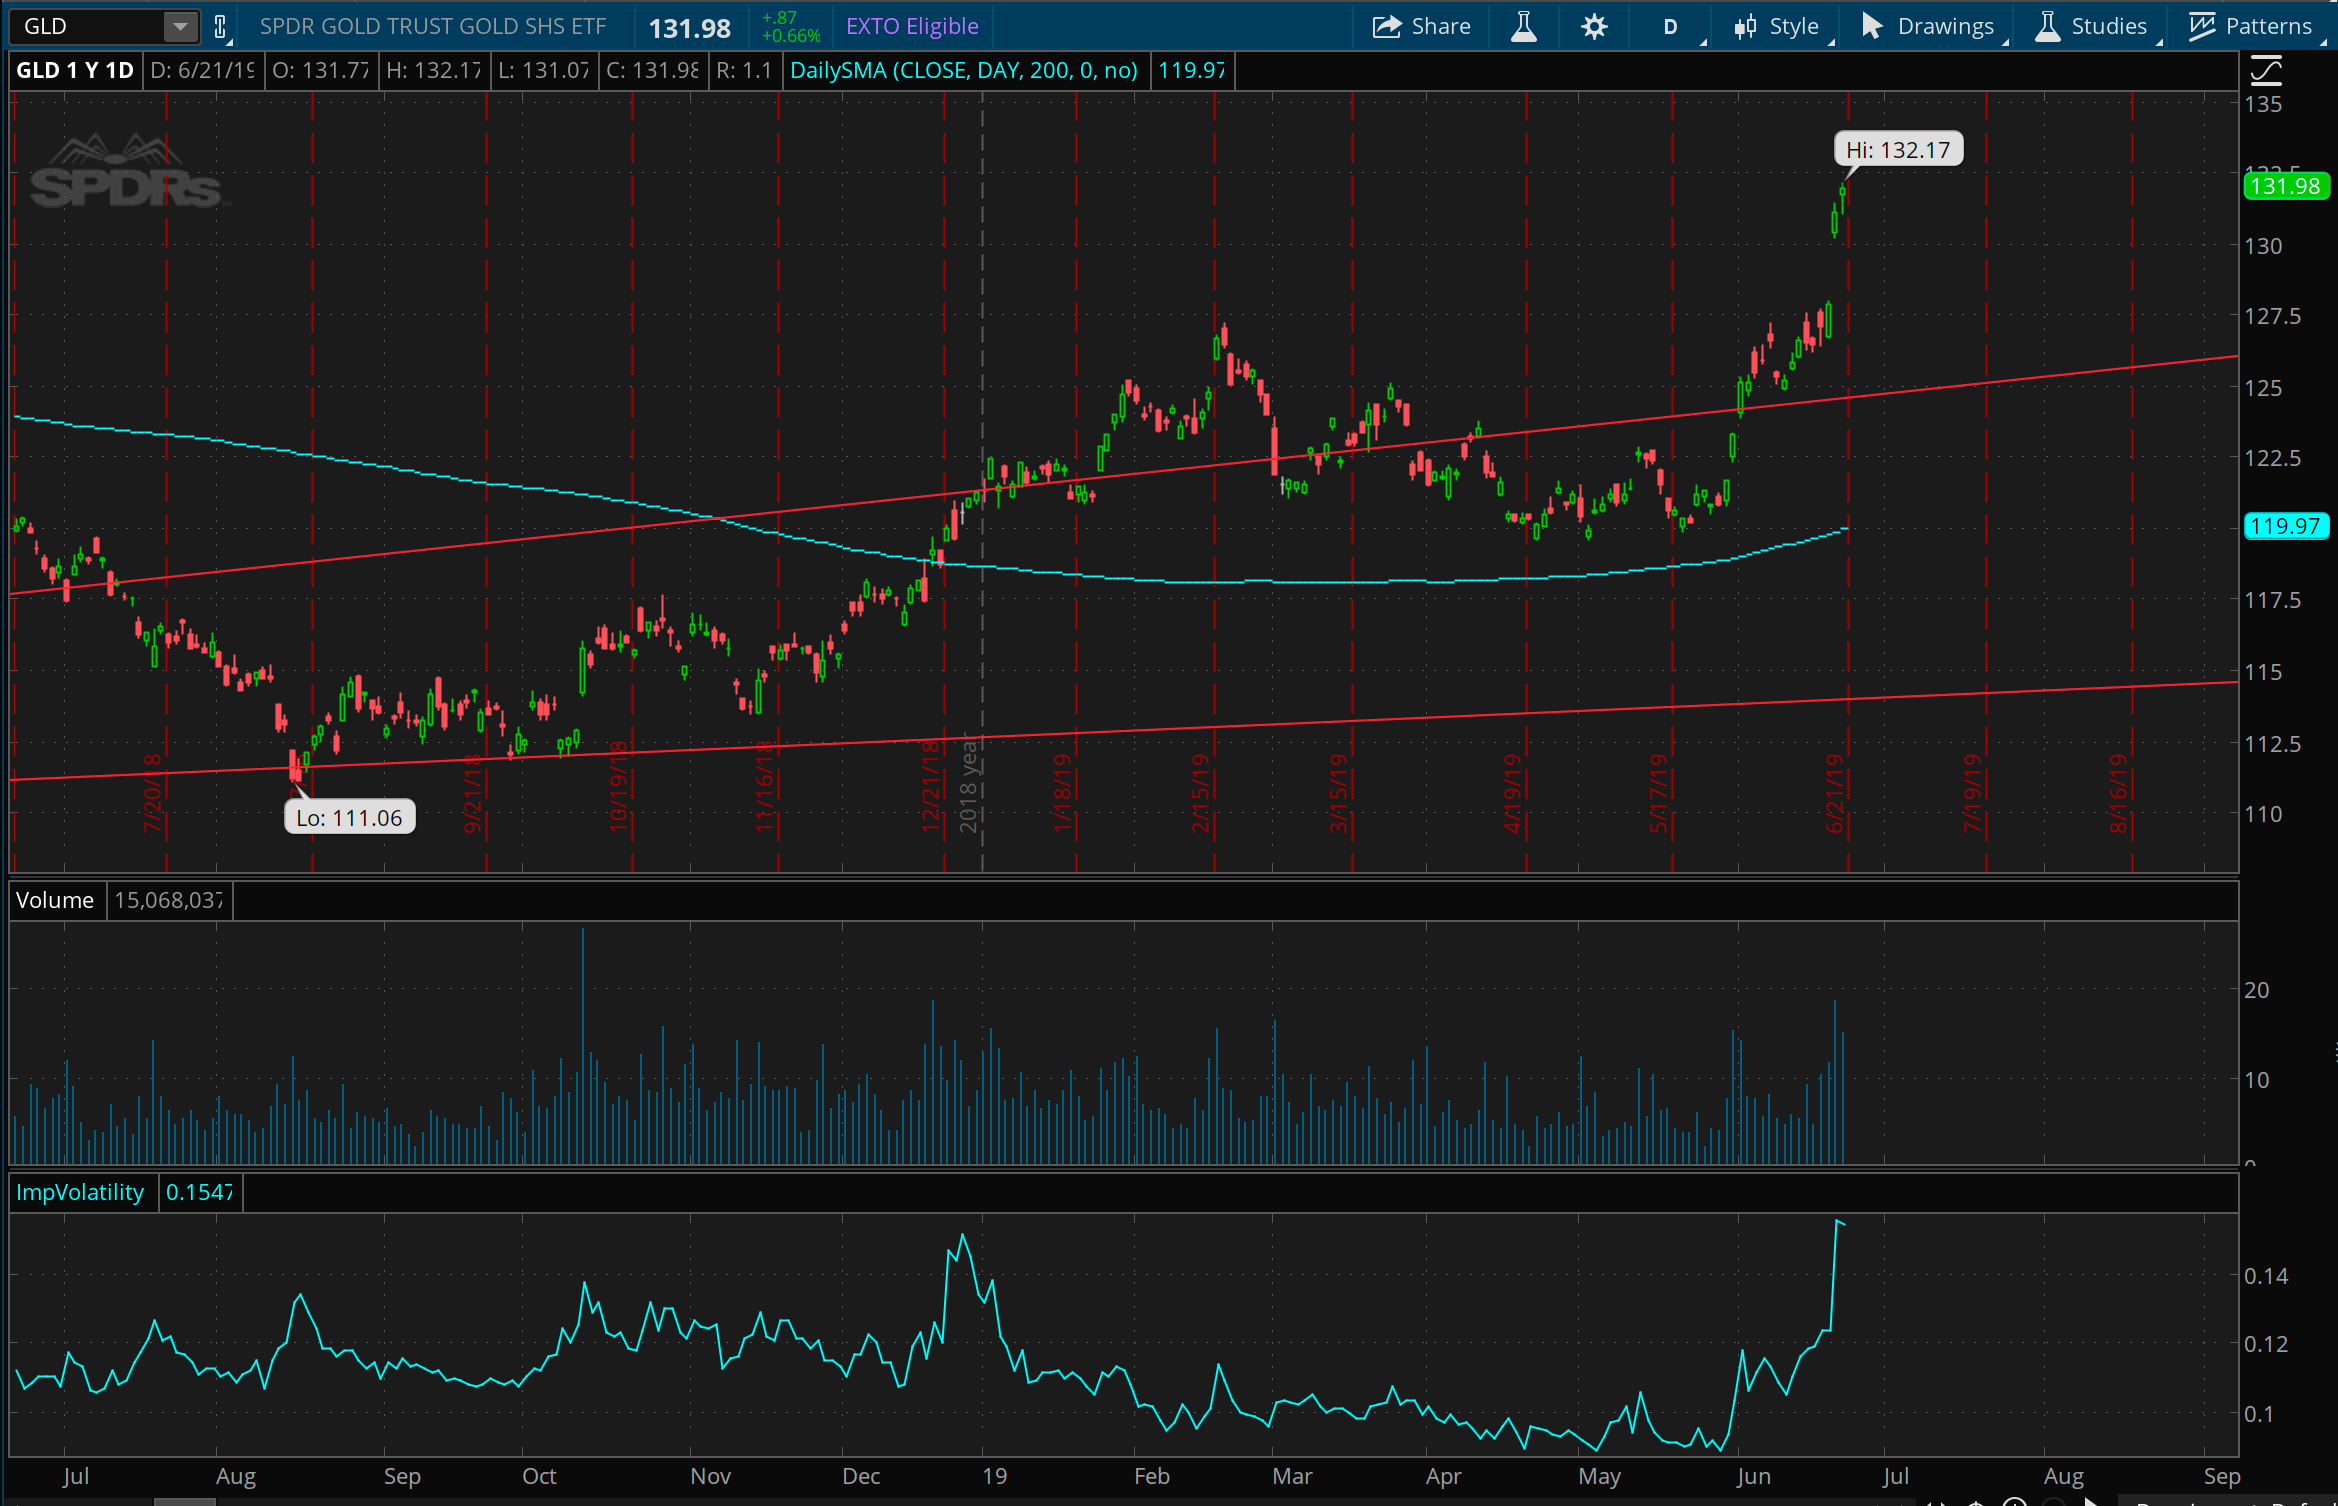
GLD is the new WTF
Nothing I’m doing here, but just check out this chart of gold prices. Within this week, they rose by ~5%, jumping in a tremendous gap up opening on Thursday. As I said about TLT a few weeks ago: as long as you aren’t on the wrong side of a trade with these types of moves, they are just fascinating and fun to witness. Will be interesting to see what happens next with GLD, but I have to imagine we’ll see prices return to “fill in” the gap created this week at some point.
