Hello, wake up
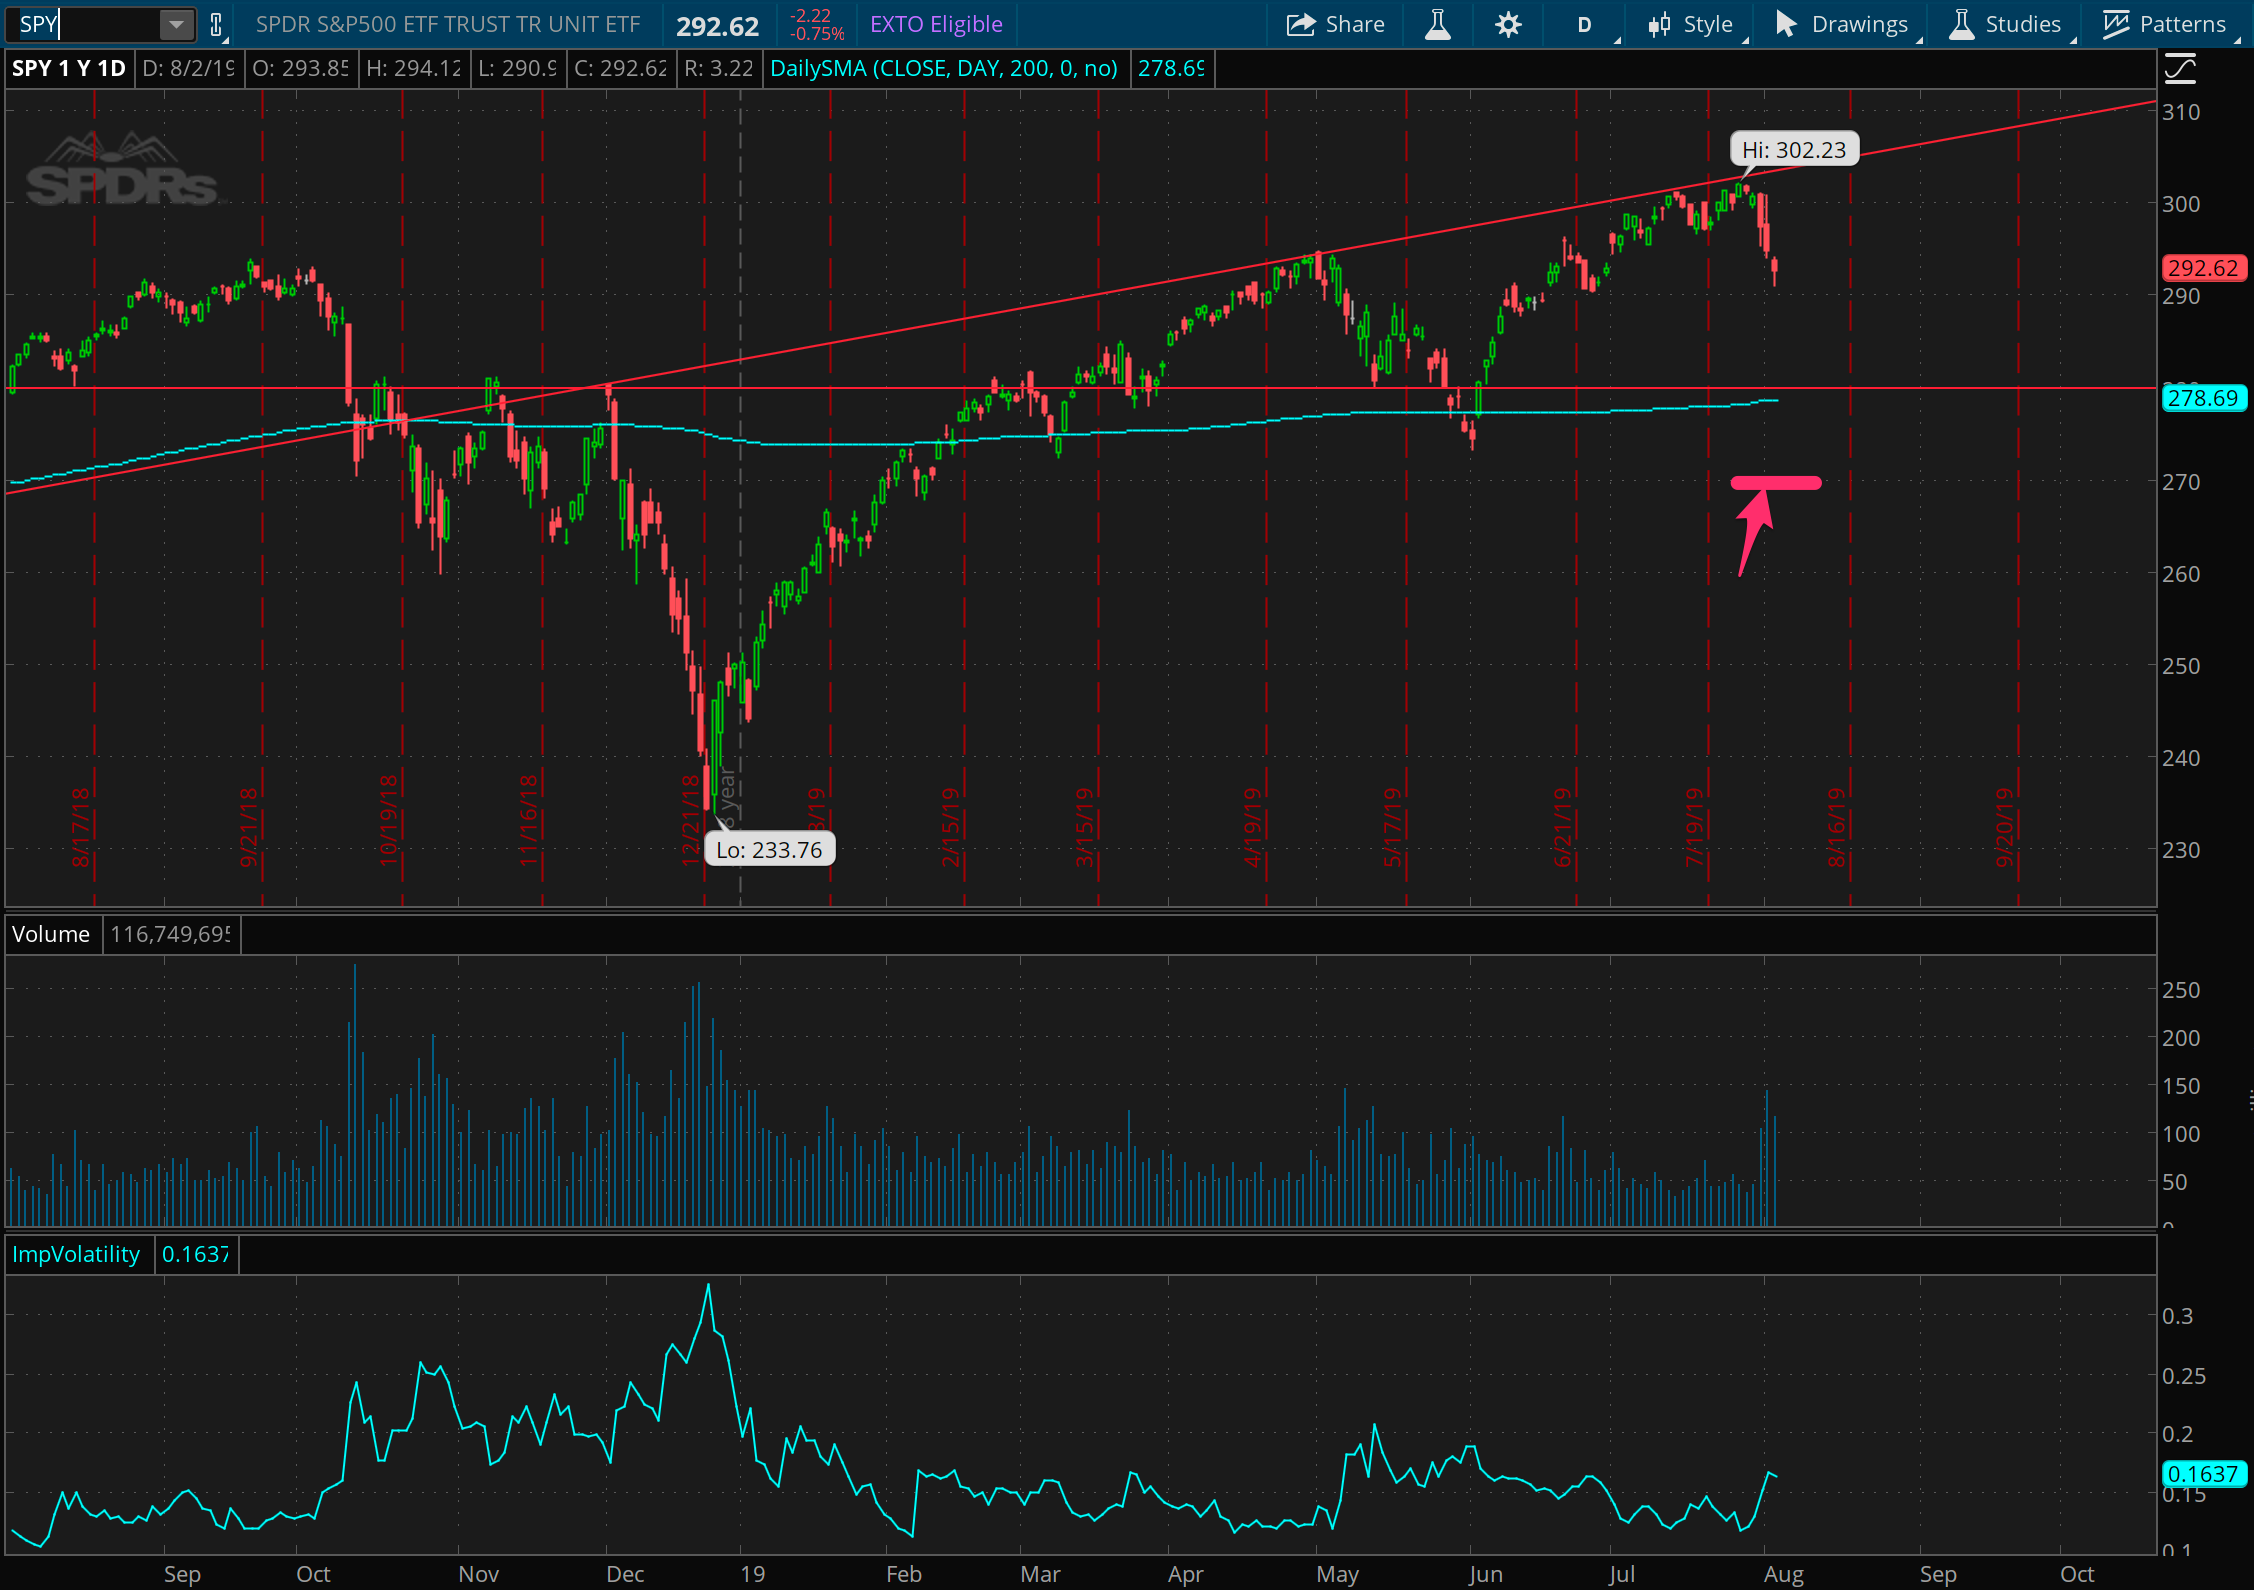
As we’ve been talking about for the past few weeks, the SPY has been stretching up towards the top of what the general trend (or sentiment) has been allowing, leaving a lot of room for downside movement. Well, we finally got a little. This past week, we erased all of July’s gains. It’s time to wake up and smell the volatility. Now is the time when trading gets interesting, and if you are a trader, this is the point at which you want to step in. Many different underlyings out there are going to have varying spikes in their volatility, which is presenting opportunity.
This particular trader roundup has a lot more than the usual trades, and not just because we haven’t talked in two weeks, but also because I put on a ton of short term positions during the past week, and took off a lot of short positions I’d been sitting on, which we’ll see below.
That said, starting off here… I rarely make a trade on the broad market index SPY, but here (see the chart above) I put in a super Johnny trade with some way out of the money put spreads around 270, just taking advantage of the expansion of volatility to get something especially far out and safe into play. This has been a junior go-to trade for me since the very earliest days.
There you are, VXX. There you are
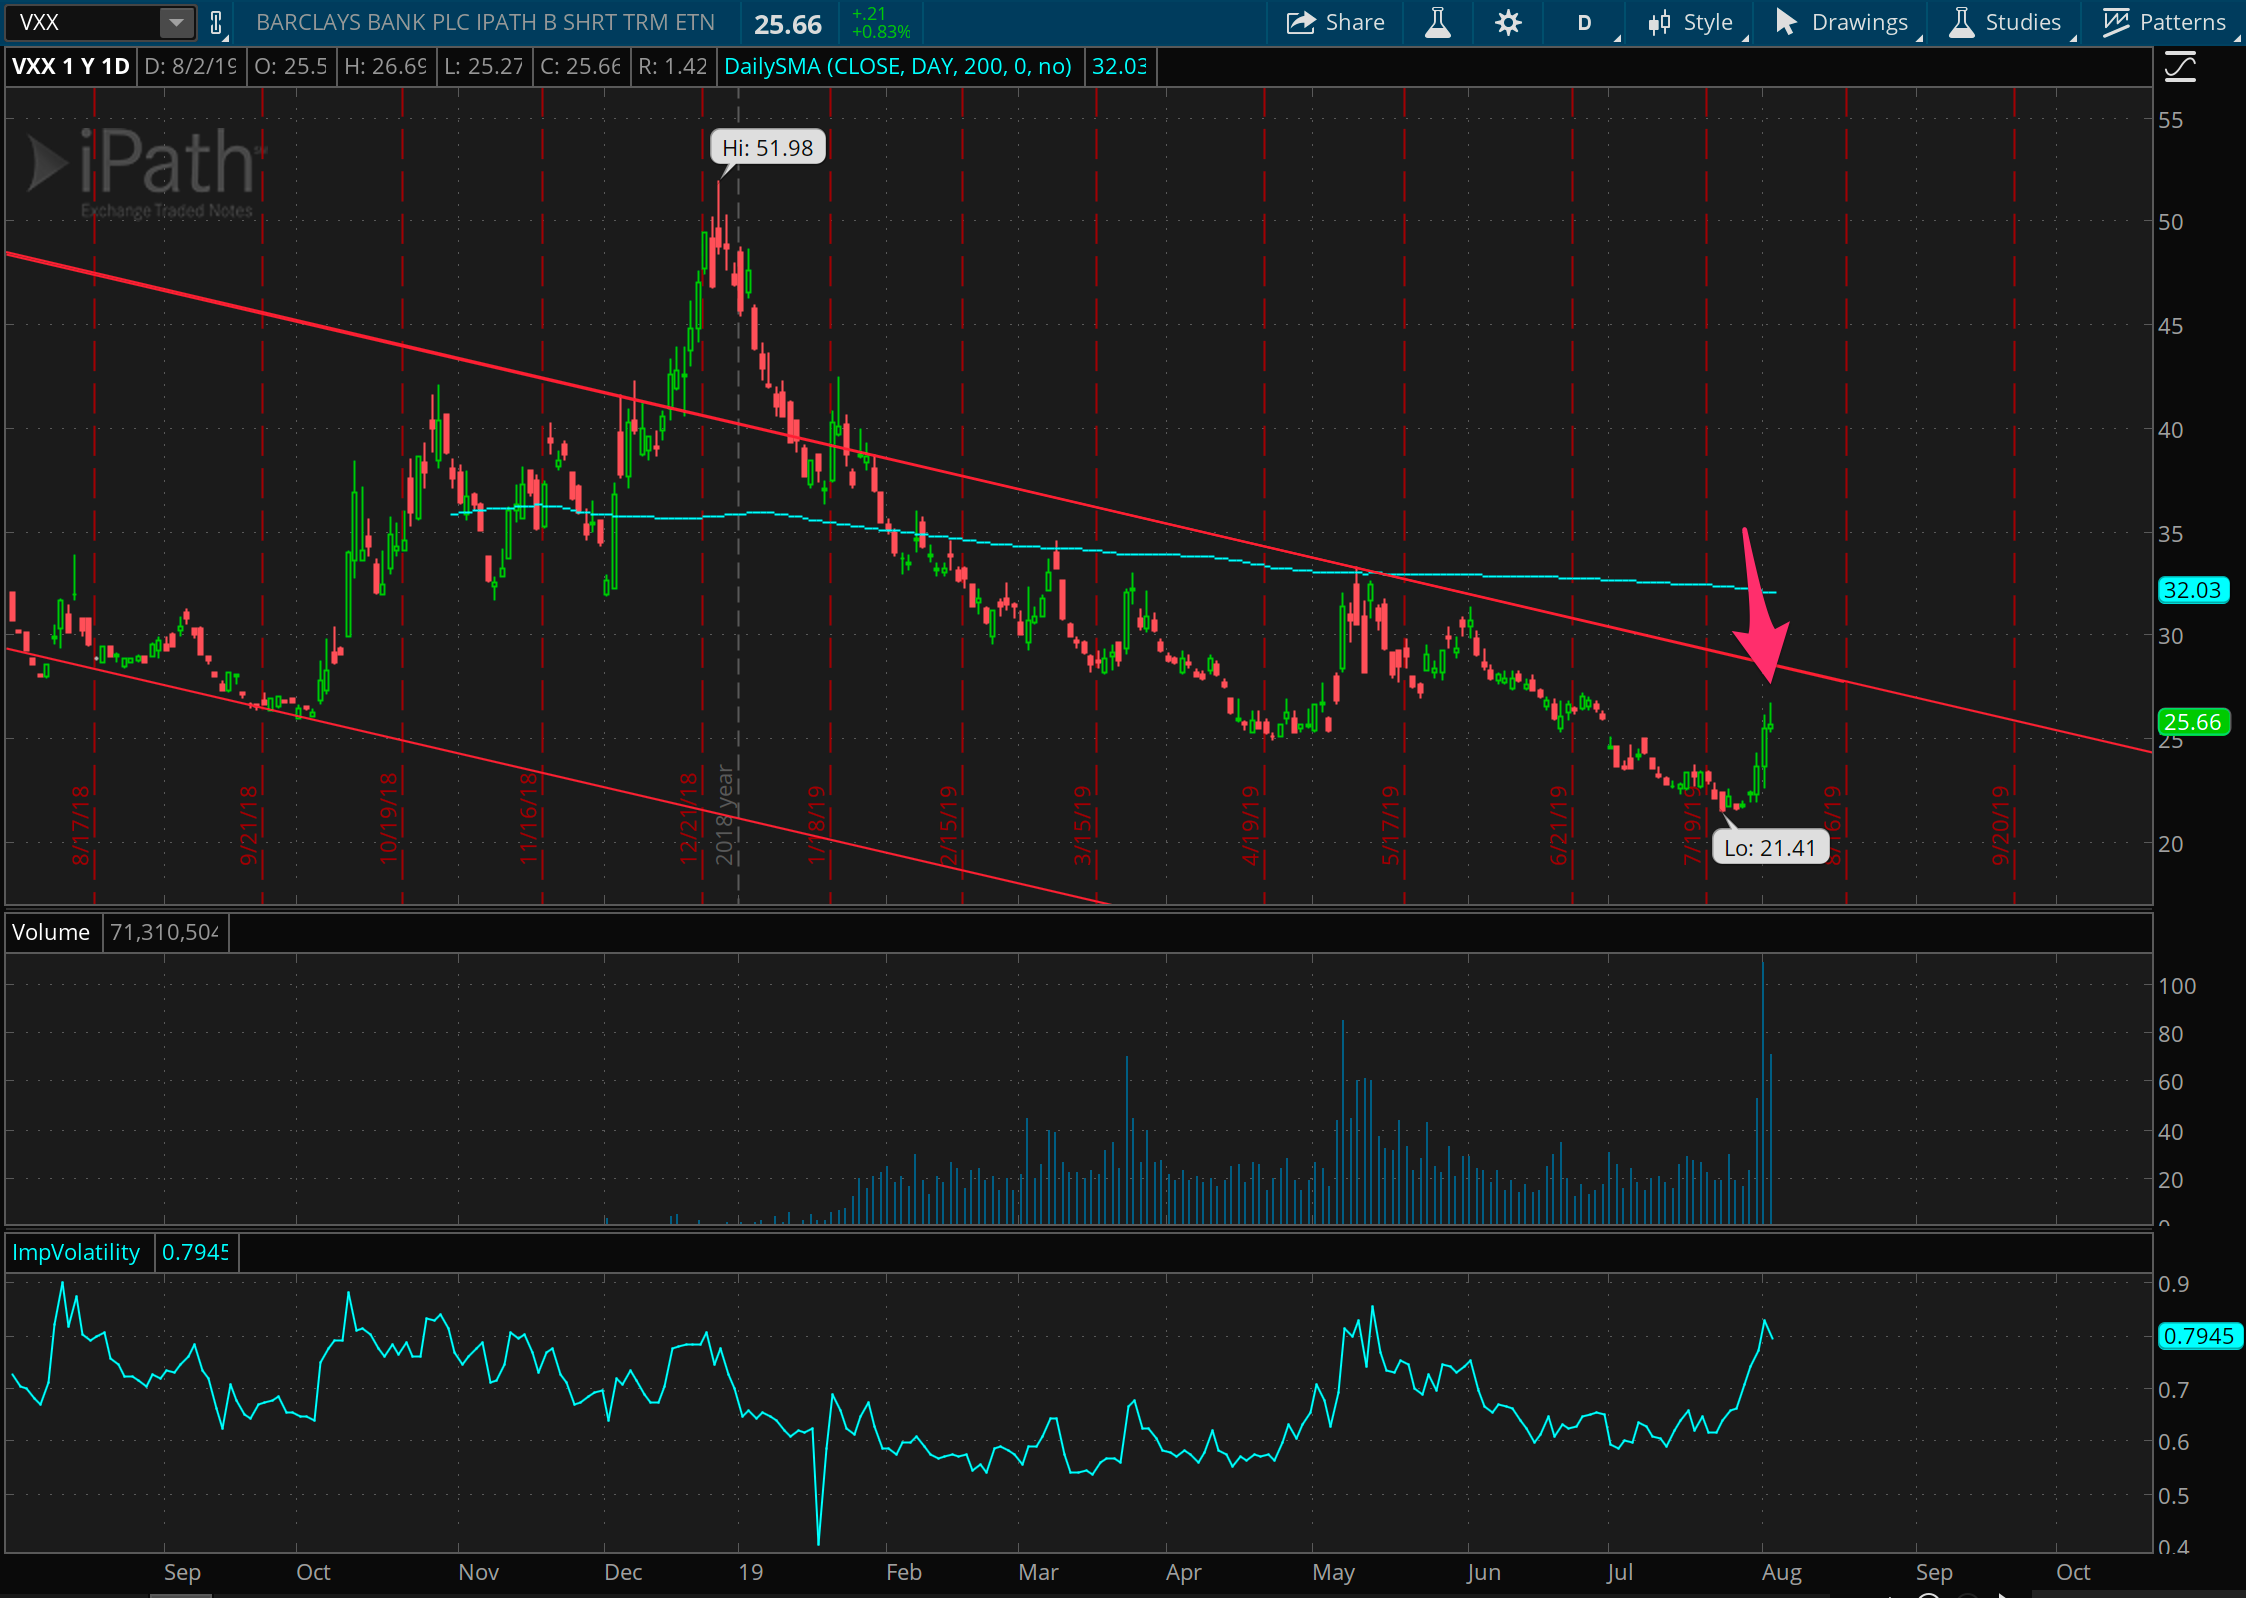
Check out this chart of volatility. We finally got a bit of a pop on it, and for the first time since May, I’ve gotten short VXX again. It helps that it’s reaching up to this downward trendline that’s been in place for some time. But either way, this is nearly a “core position” type of trade for me. It’s a very pure way to play the overstatement of implied volatility and the time decay associated with it. If volatility continues to spike higher, I’ll add to this position. Otherwise, I’ll sit tight and collect!
An AAPL grapple
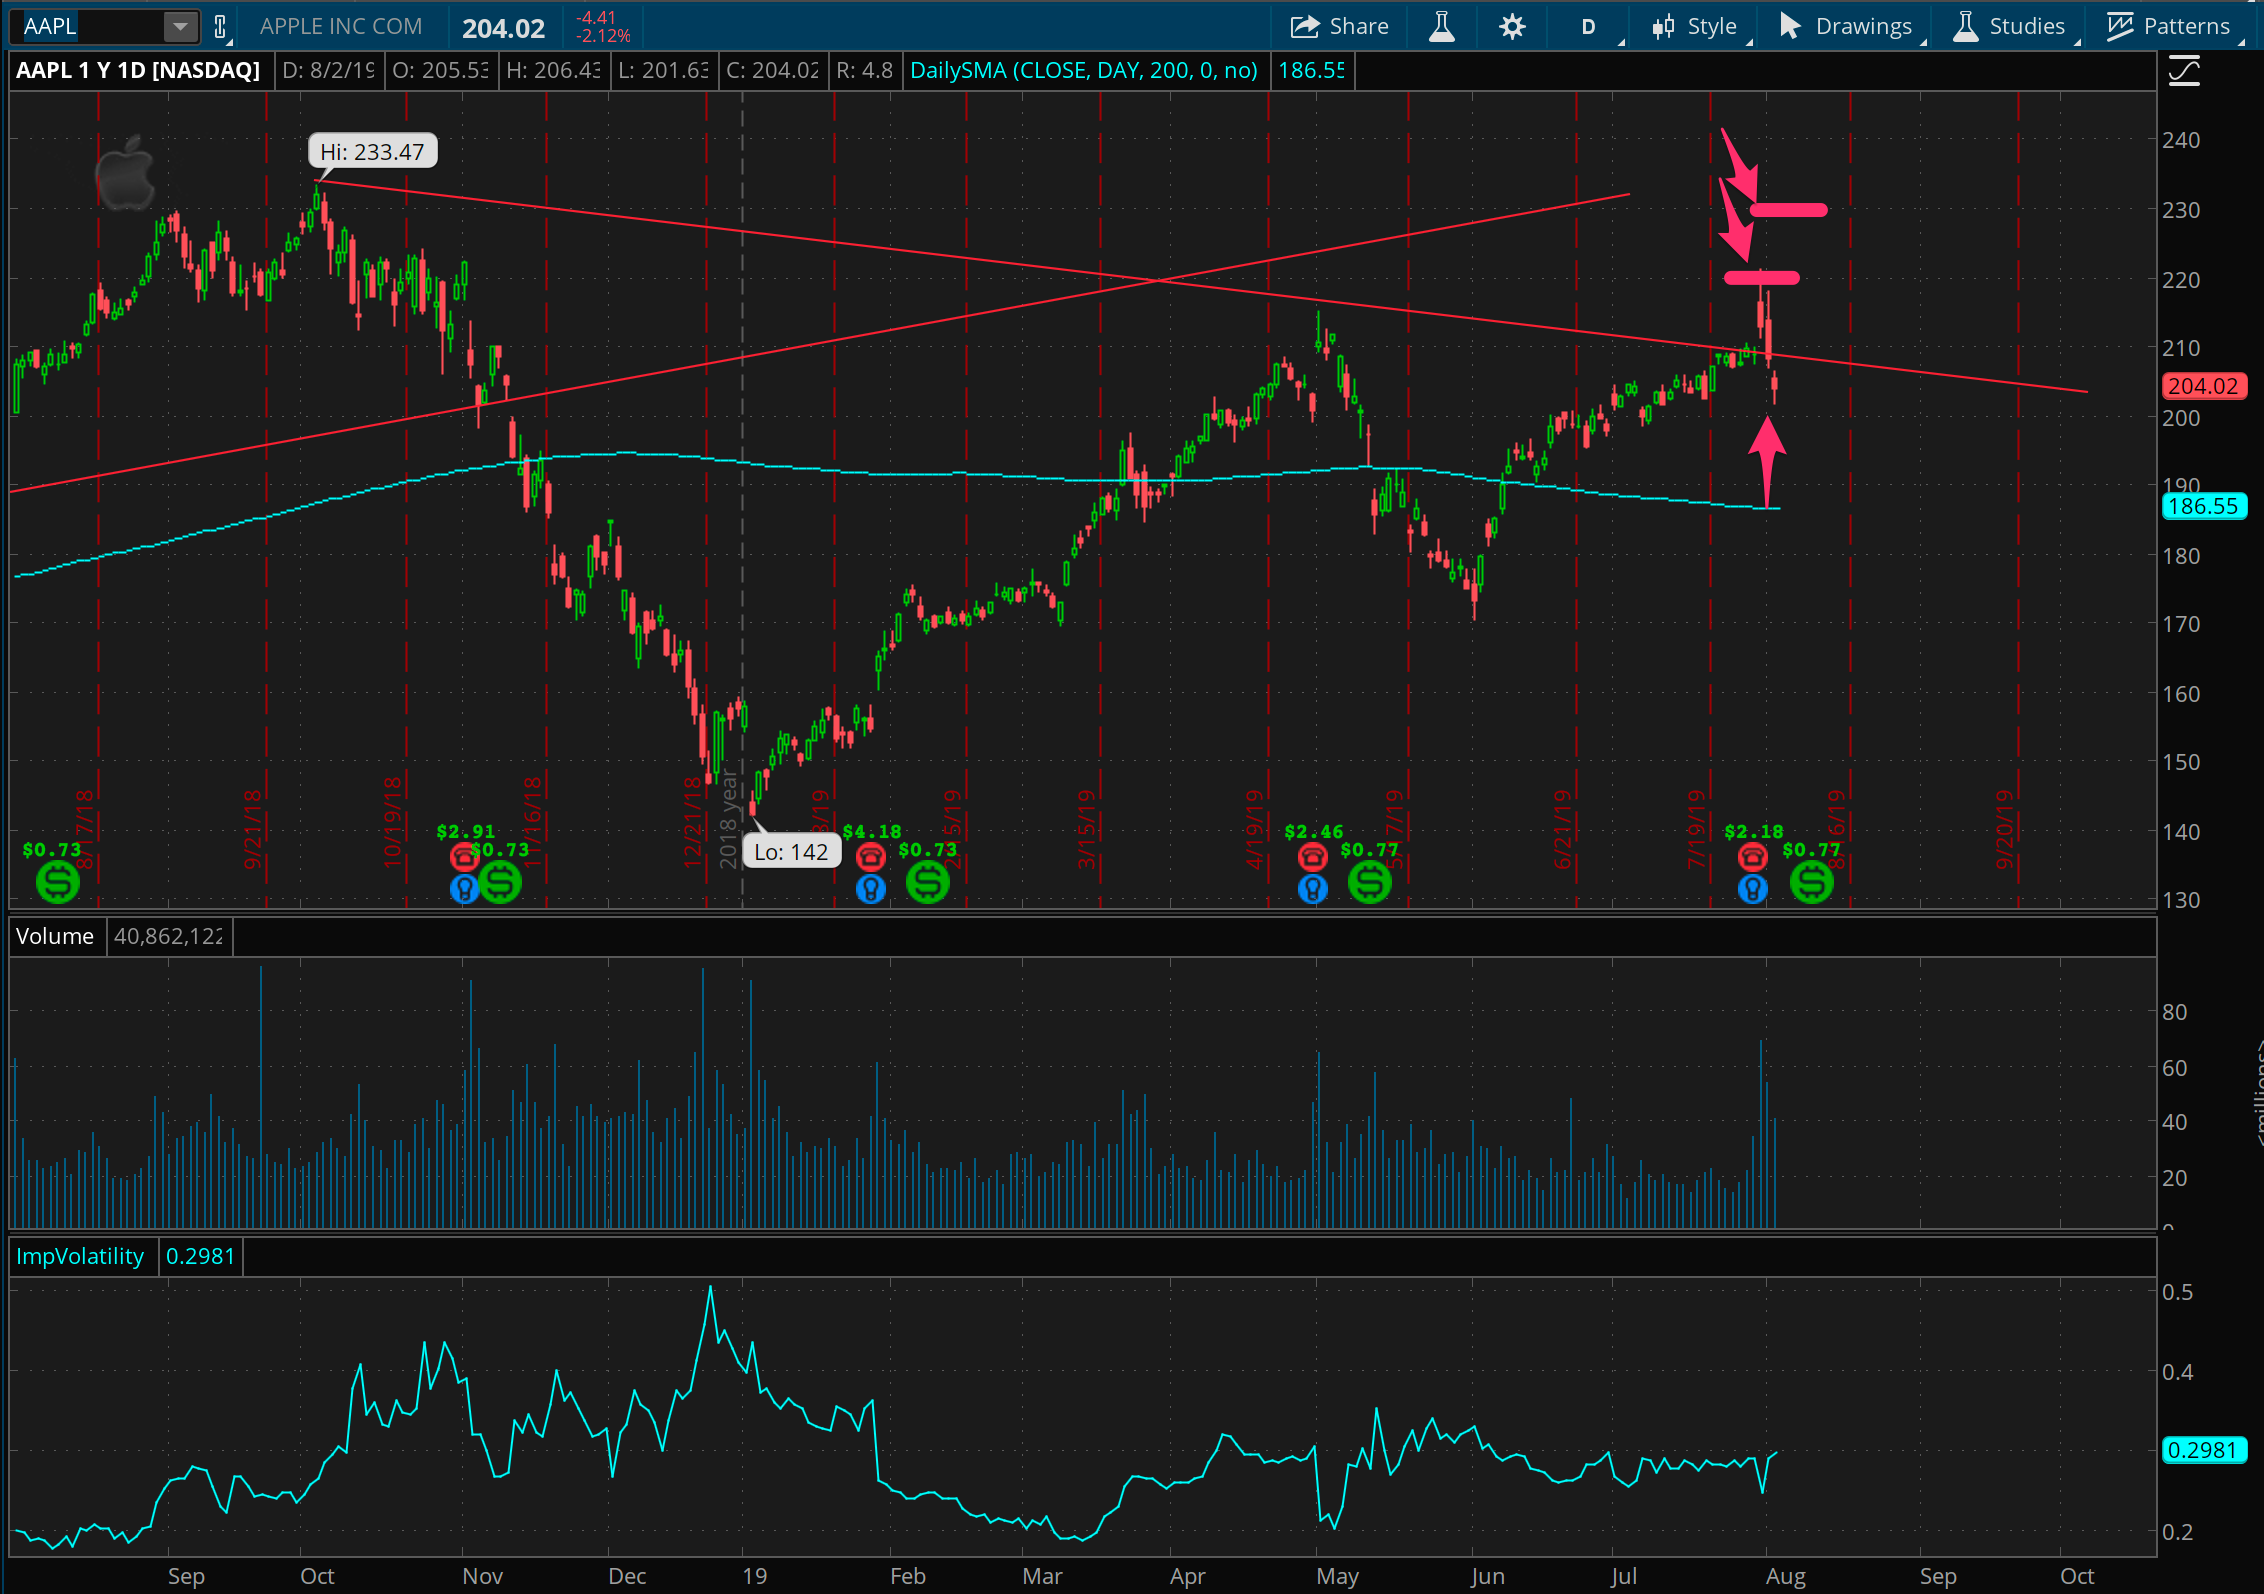
Another reason for a lot of activity this week was because of the many earnings plays out there, and among earnings plays, AAPL was probably the main show for many traders out there. I went short call spreads at 220 and naked calls at 230 prior to Apple’s earnings announcement. Though they surprised to the upside, three things went my way: 1) the price move was inside the range implied by the options, 2) a lot of volatility comes out of options after earnings (which is good if you’re selling them like here), and 3) AAPL did a major reversal downward after the upward surprise. I still have the 230 calls on, since volatility expanded after the drop. Once the stock moves lower, or inches higher, I’ll have a big enough profit to close those out.
Oil be oilin’
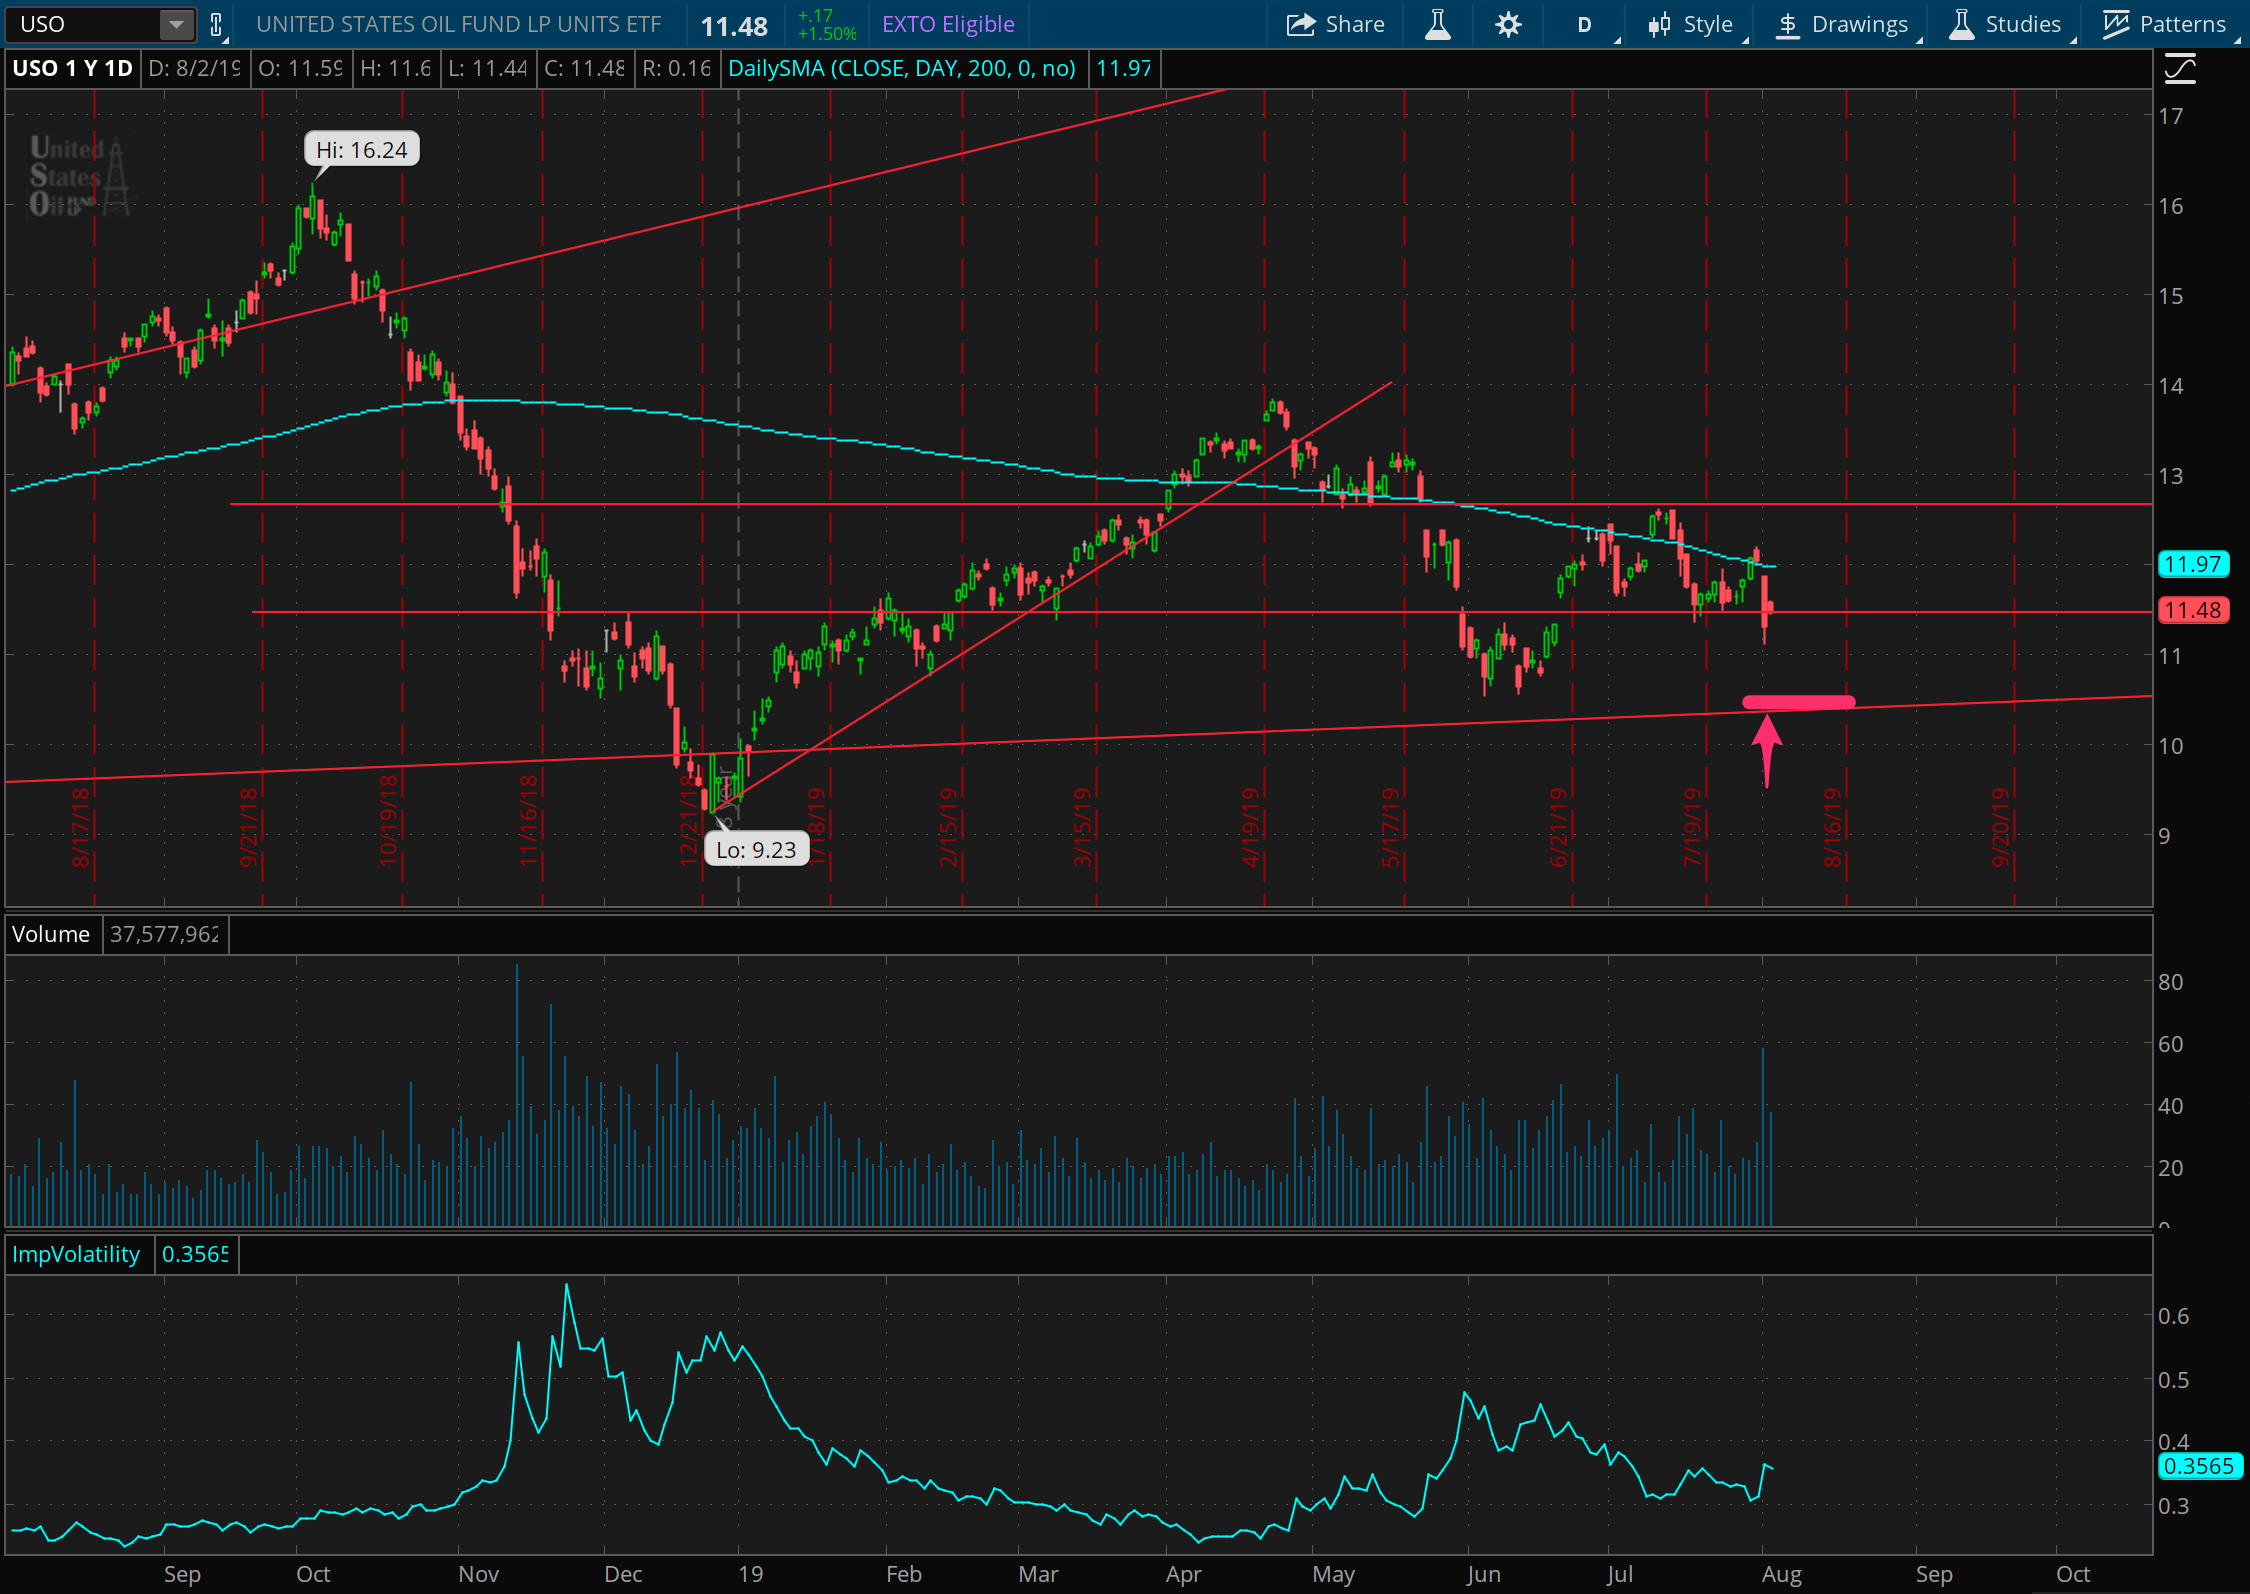
Here’s a pretty basic play. Oil prices held up initially on the market downturn, and then had a pretty spectacular one day drop late in the week. The speed of the move and pop in implied volatility (in the bottom graph shown above) presented an opportunity to short some puts at a reasonable price almost a dollar away from the price at the time, at 10.5… a nearly 10% price cushion. The big advantage of USO is it’s small size (i.e. low price), which makes it easy to take on smaller positions and scale into them and work with them over time. So, if it bounces, great. If it crashes, I can scale further into the position, add short calls to neutralize, etc.
Twittah
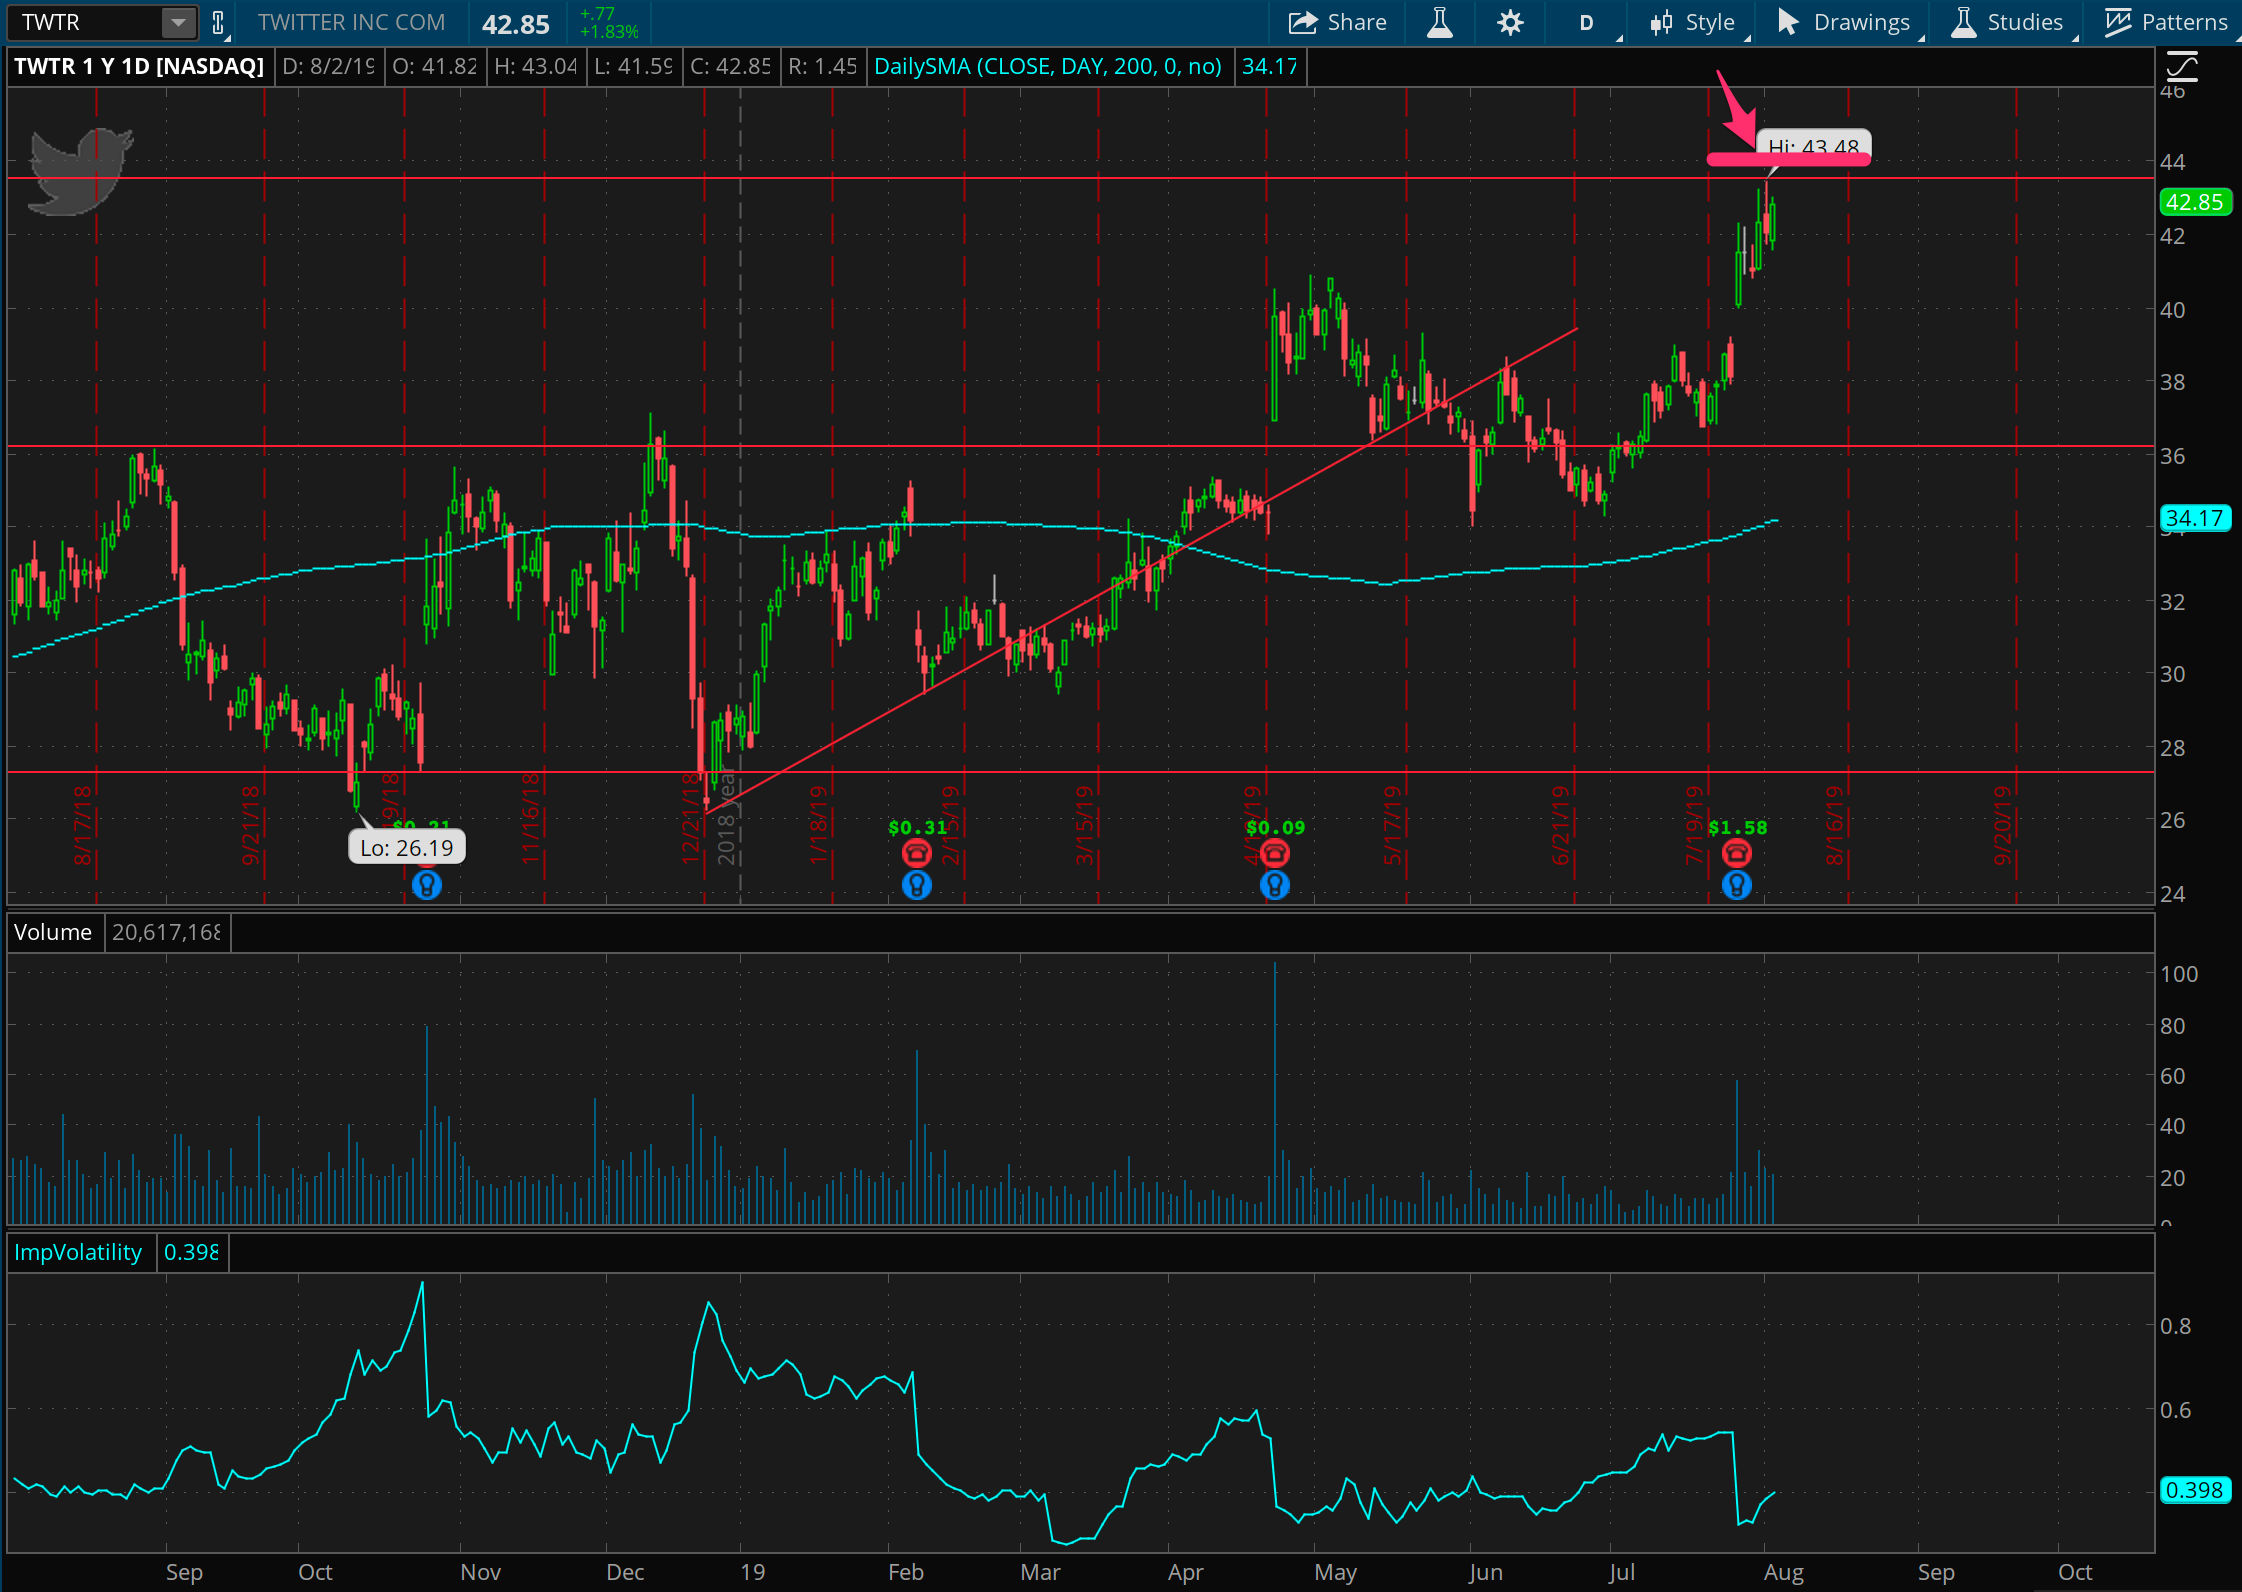
Compared to the market, TWTR had an awesome week. Twitter reported earnings week before last, and had a stellar upside surprise. The trade shown in the graph is a post earnings trade, fading the continued post earnings strength of the stock by shorting call spreads above at 44. TWTR has just really stretched itself up here, hit a historical stopping point from the past, and I’m expecting it to at least take a breath before moving higher, or else head back down to fill the gap it left behind in the earnings move, from 39 to 40.
NFLX rollercoaster
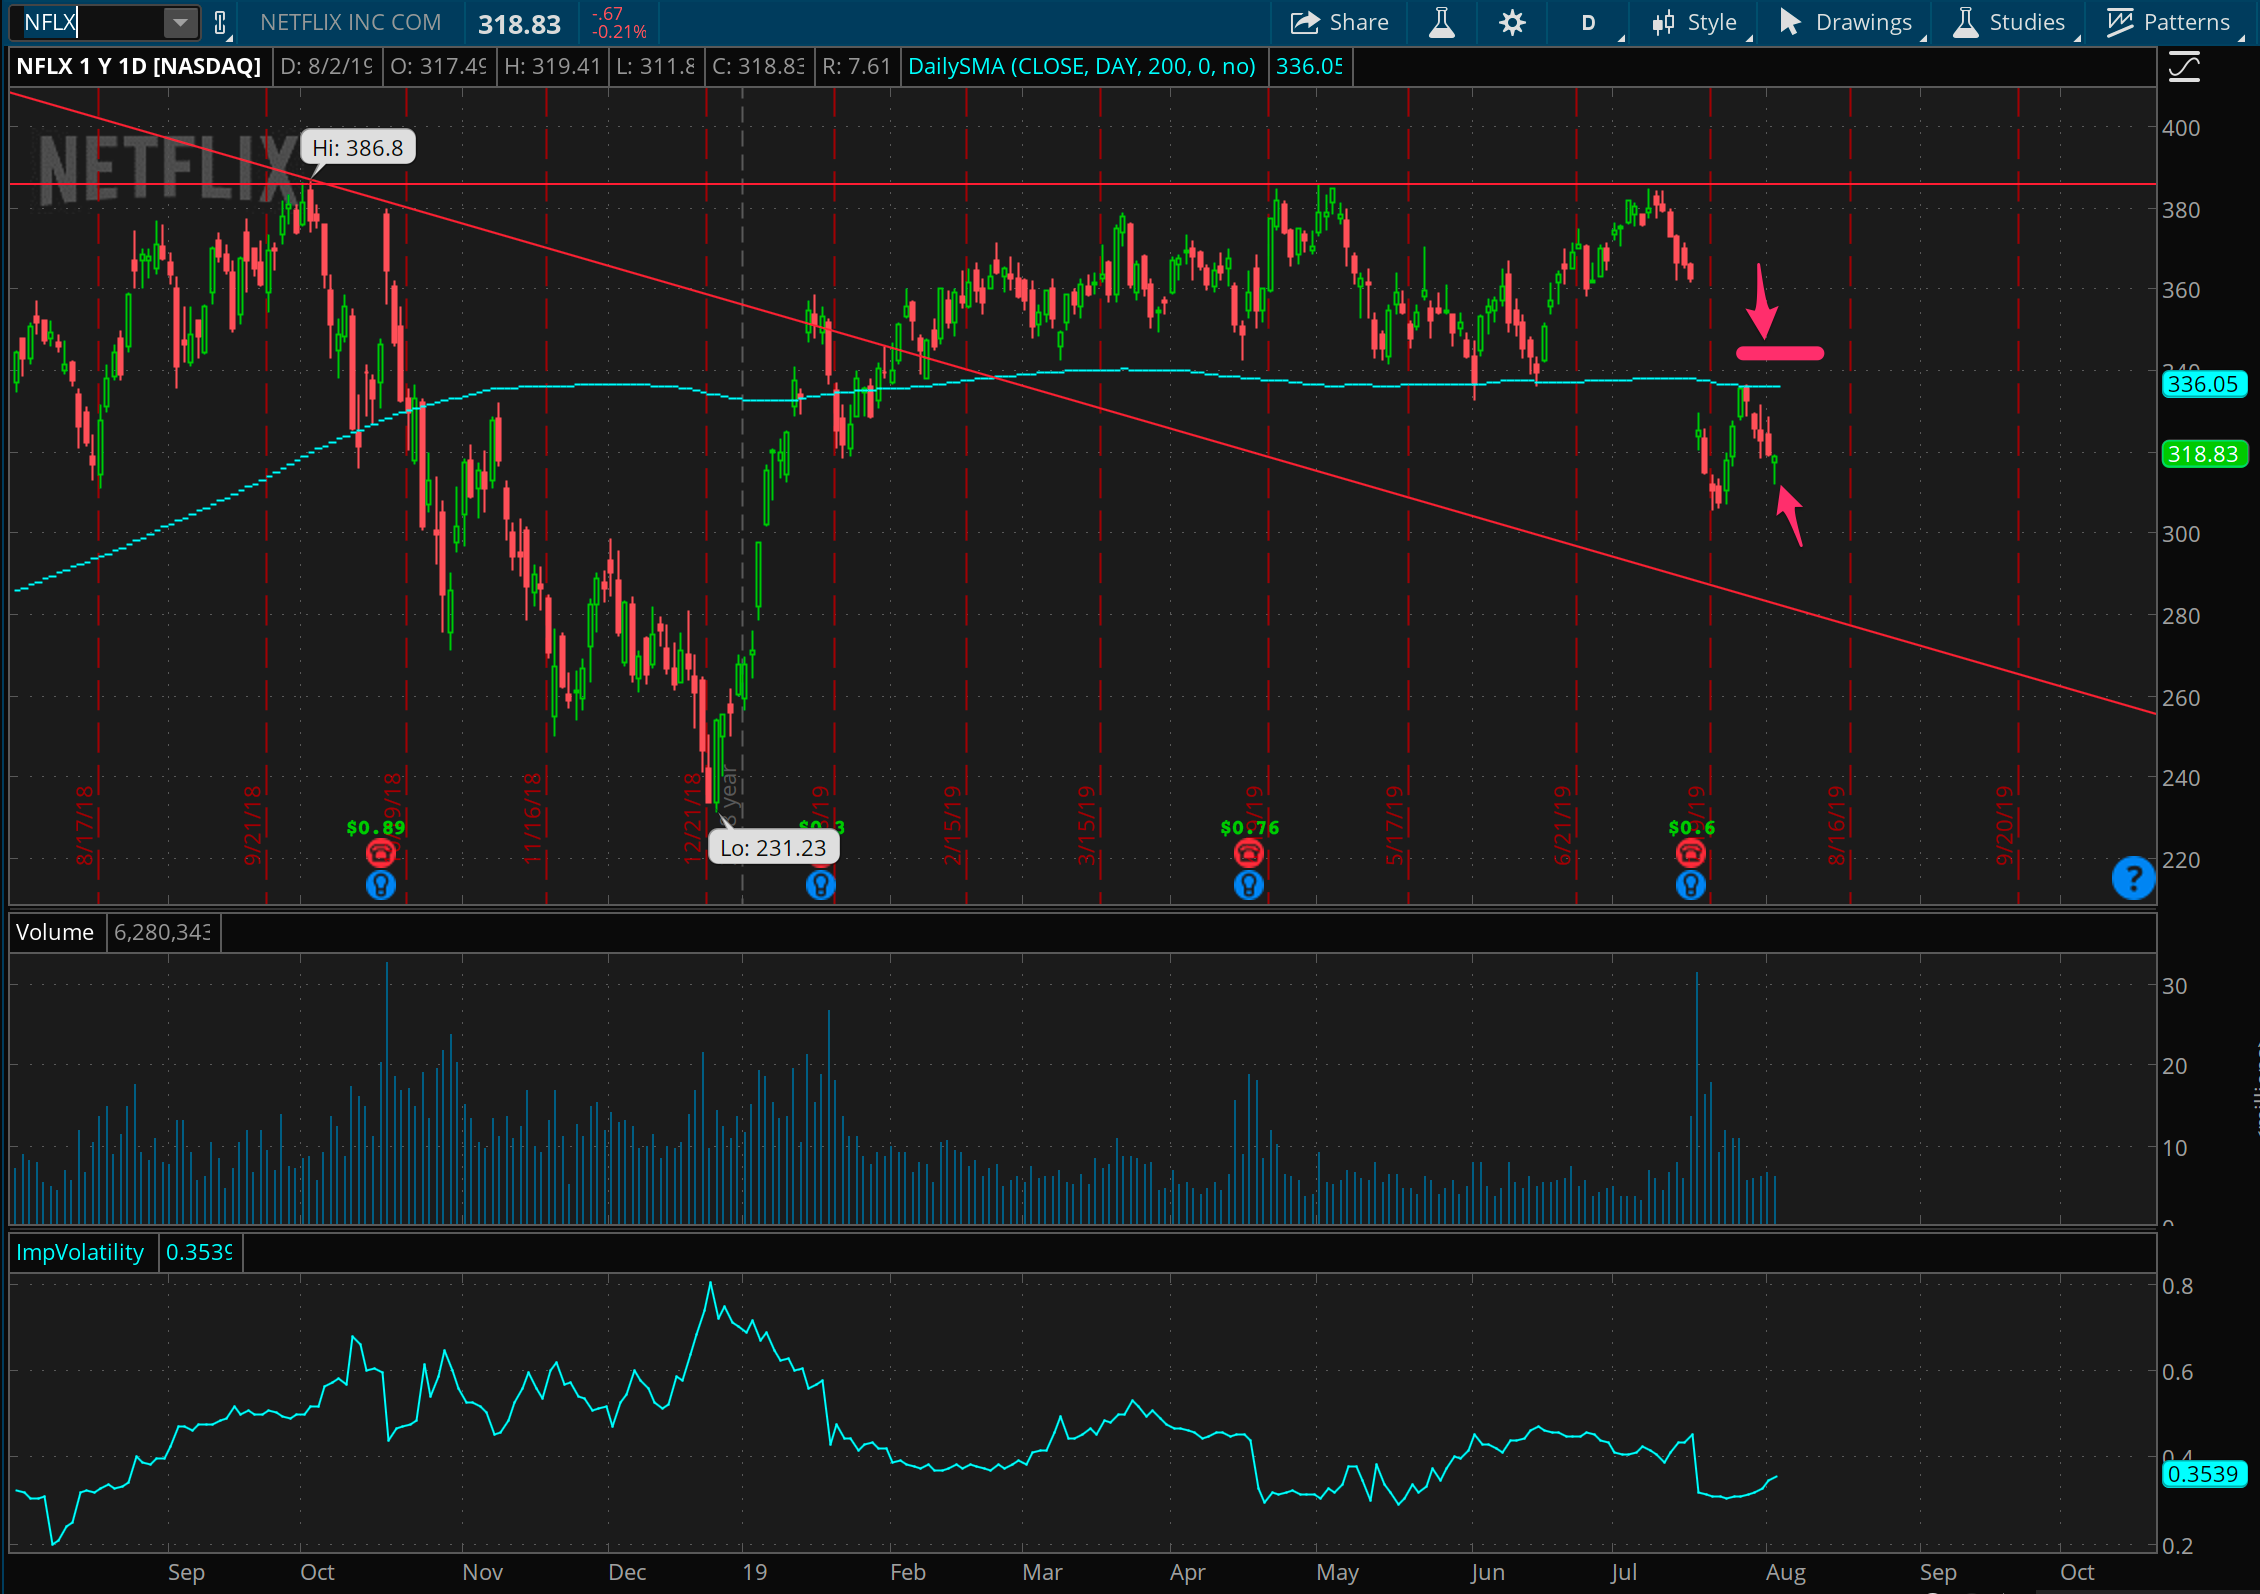
Netflix is on a pretty wild rollercoaster right now. After watching and playing the range in NFLX for weeks and weeks, it got knocked cleanly out of it with a recent earnings miss, resulting in a nice win a few weeks ago. Now, as it wanders around looking for a new level investors feel good about, it’s struggling against prior range lows at 340 (along with the 200 day moving average there). As it got to this level and bounced off, it felt like a good place to put on a relatively safe call spread at 345. A move down over the next two days turned this into a quick win. The new range here could very well be 300 to 340, but we need to give it some time to sort out.
Square laid bare
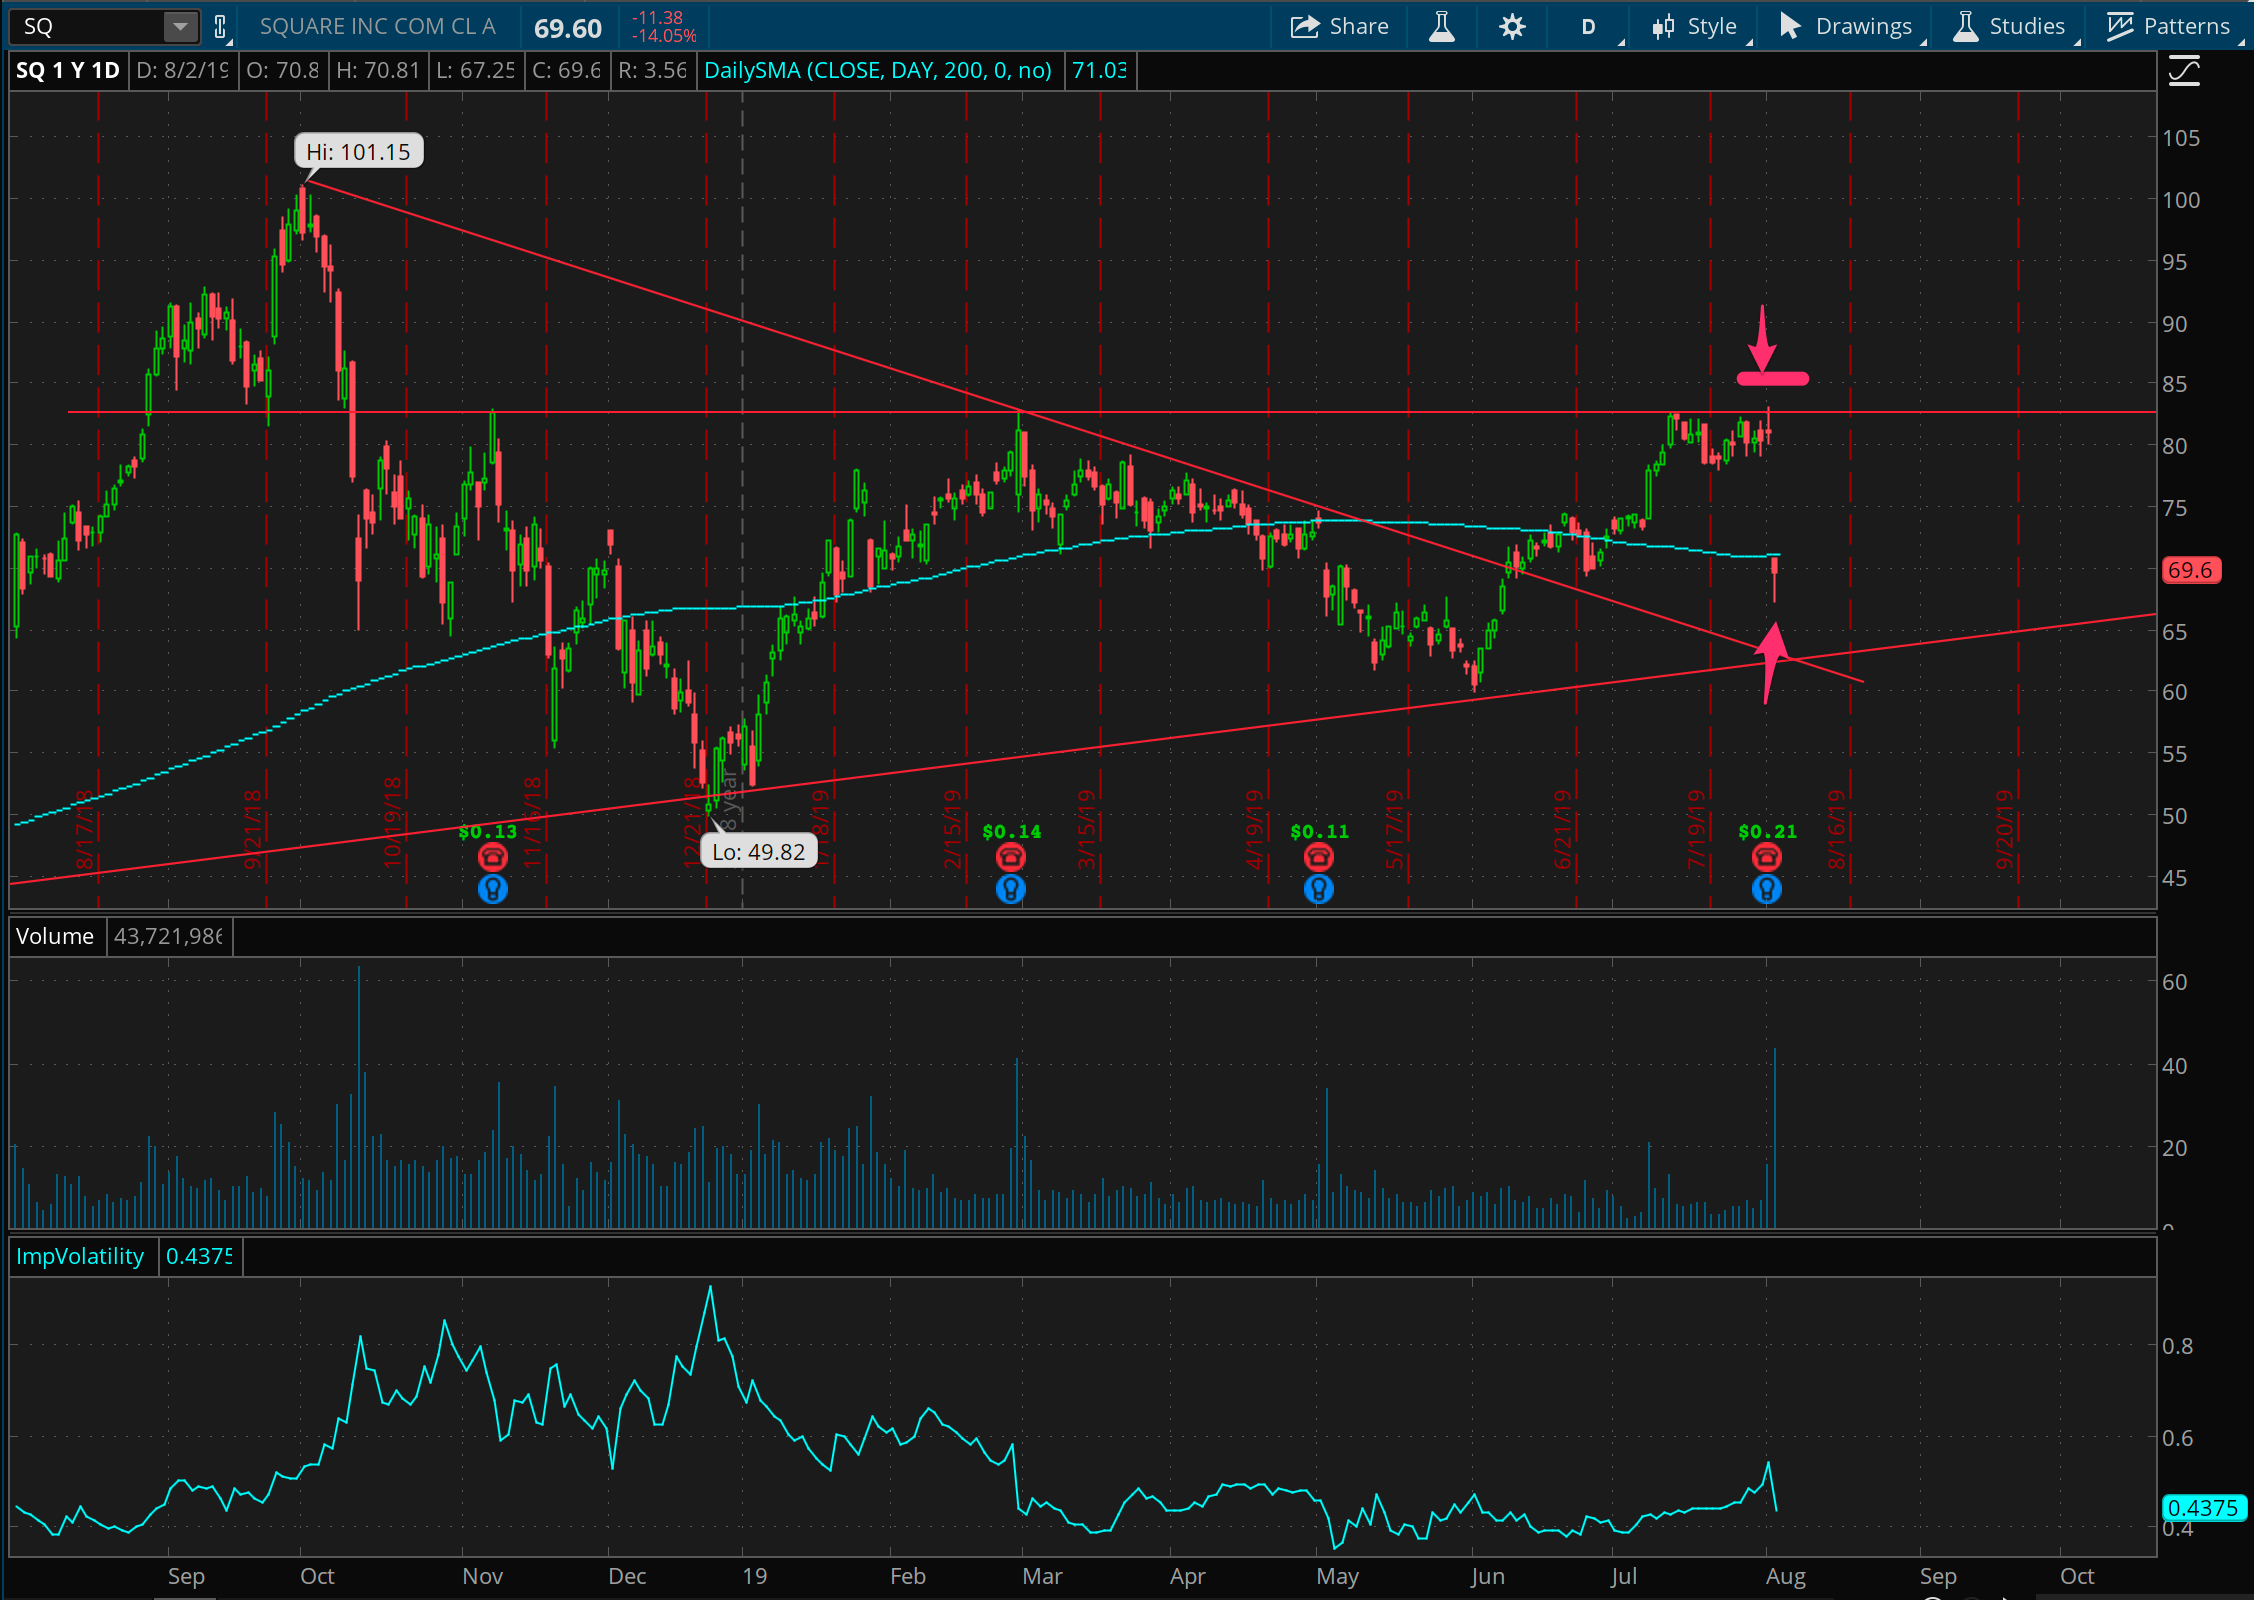
In other price-not-overcoming-prior-resistance-levels-might-be-telling-you-something news, check out Square here. Like NFLX, this battled against a resistance level for quite some time, right around 82. The last time we rounded up, back in mid July, I had just put on a trade betting this resistance would hold. That trade worked out since then, and, seeing that resistance hold, I put on another similar trade just before earnings. And lo, perhaps the prices were signaling to us that Square might not hold up to the high expectations on it. If we see it move lower down to 65, it could turn into a possible long play next.
Another CAT short
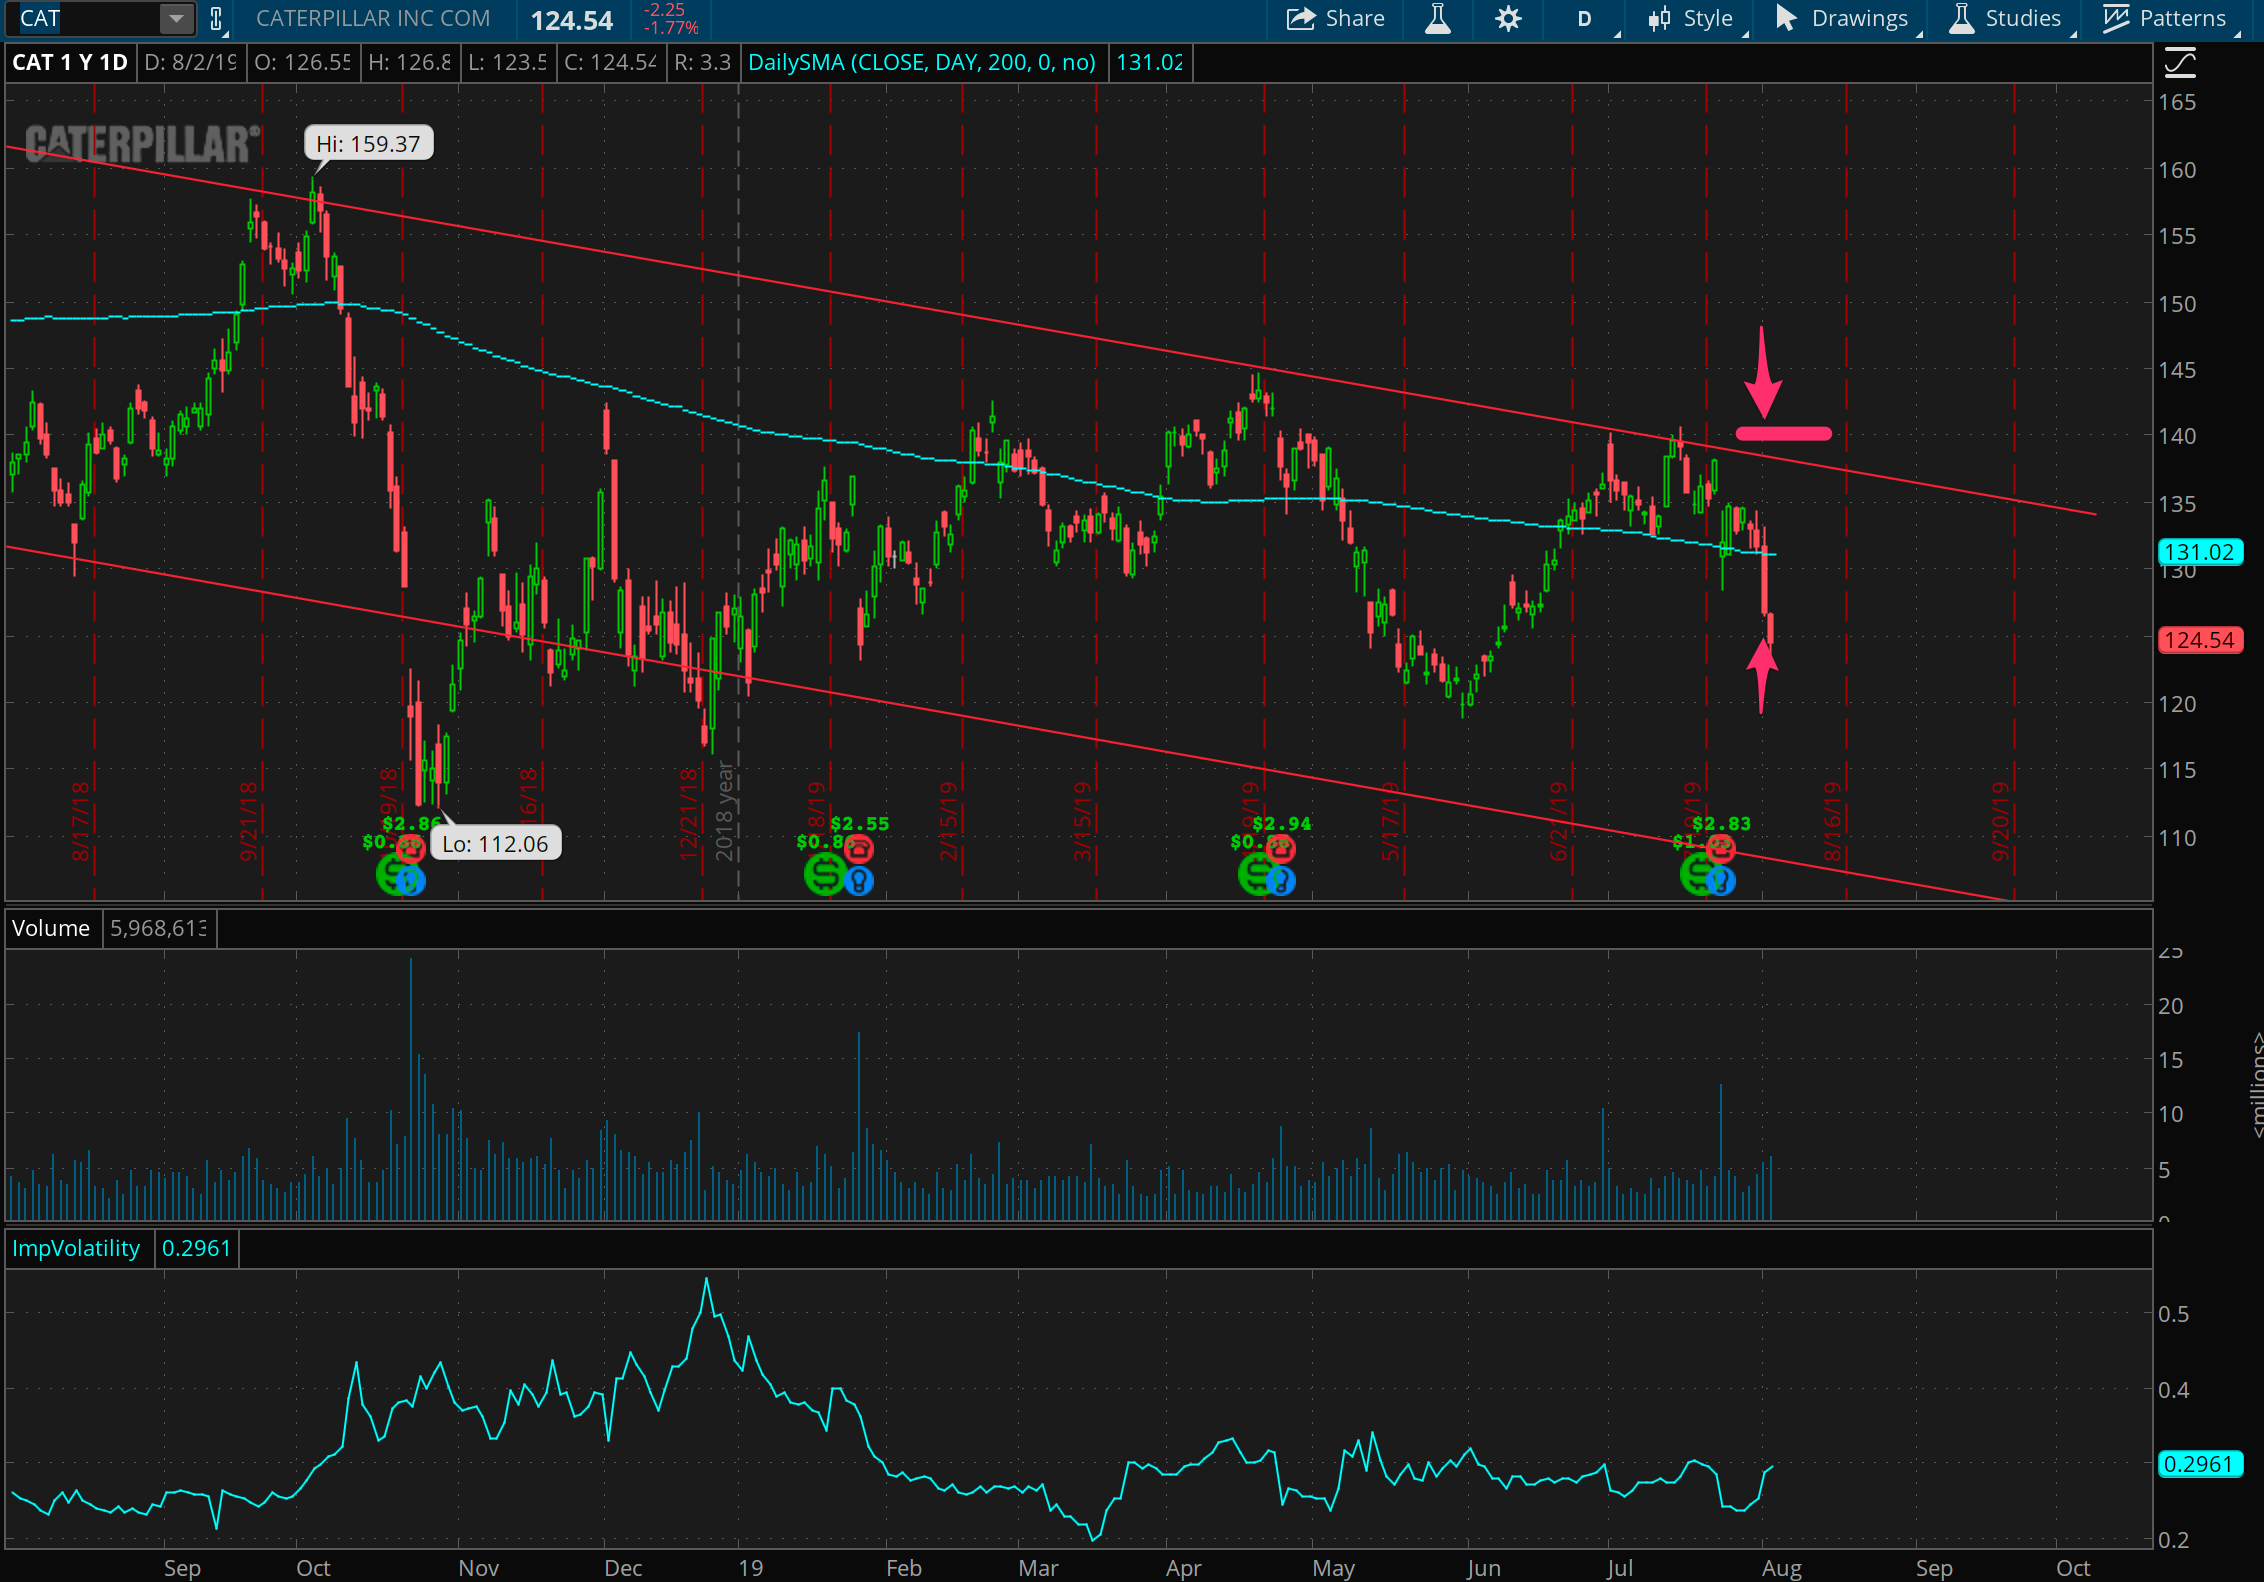
When we last rounded up, I had added to a short CAT position which looked pretty clean. I held it through earnings and got out for a nice profit when it dropped. This week was one for a lot of activity, and I did a quick additional two day play in here over this week, shorting call spreads at 140 as it again approached that level. It fell hard with the broad market pullback, and this turned into a solid little quick win.
Finally, taking off the shorts (Hey, calm down now)
I’m going to just show you three charts in a row here, all being short positions that I sat on for far too long, all from early or mid June. These all played out very similarly, in that they all approached overhead resistance, rose through it, and then stayed there for weeks. Frankly I should have been out of these in June when they didn’t work out, but the downturn in the market gave me a chance to get out of each of these trades at a small loss.
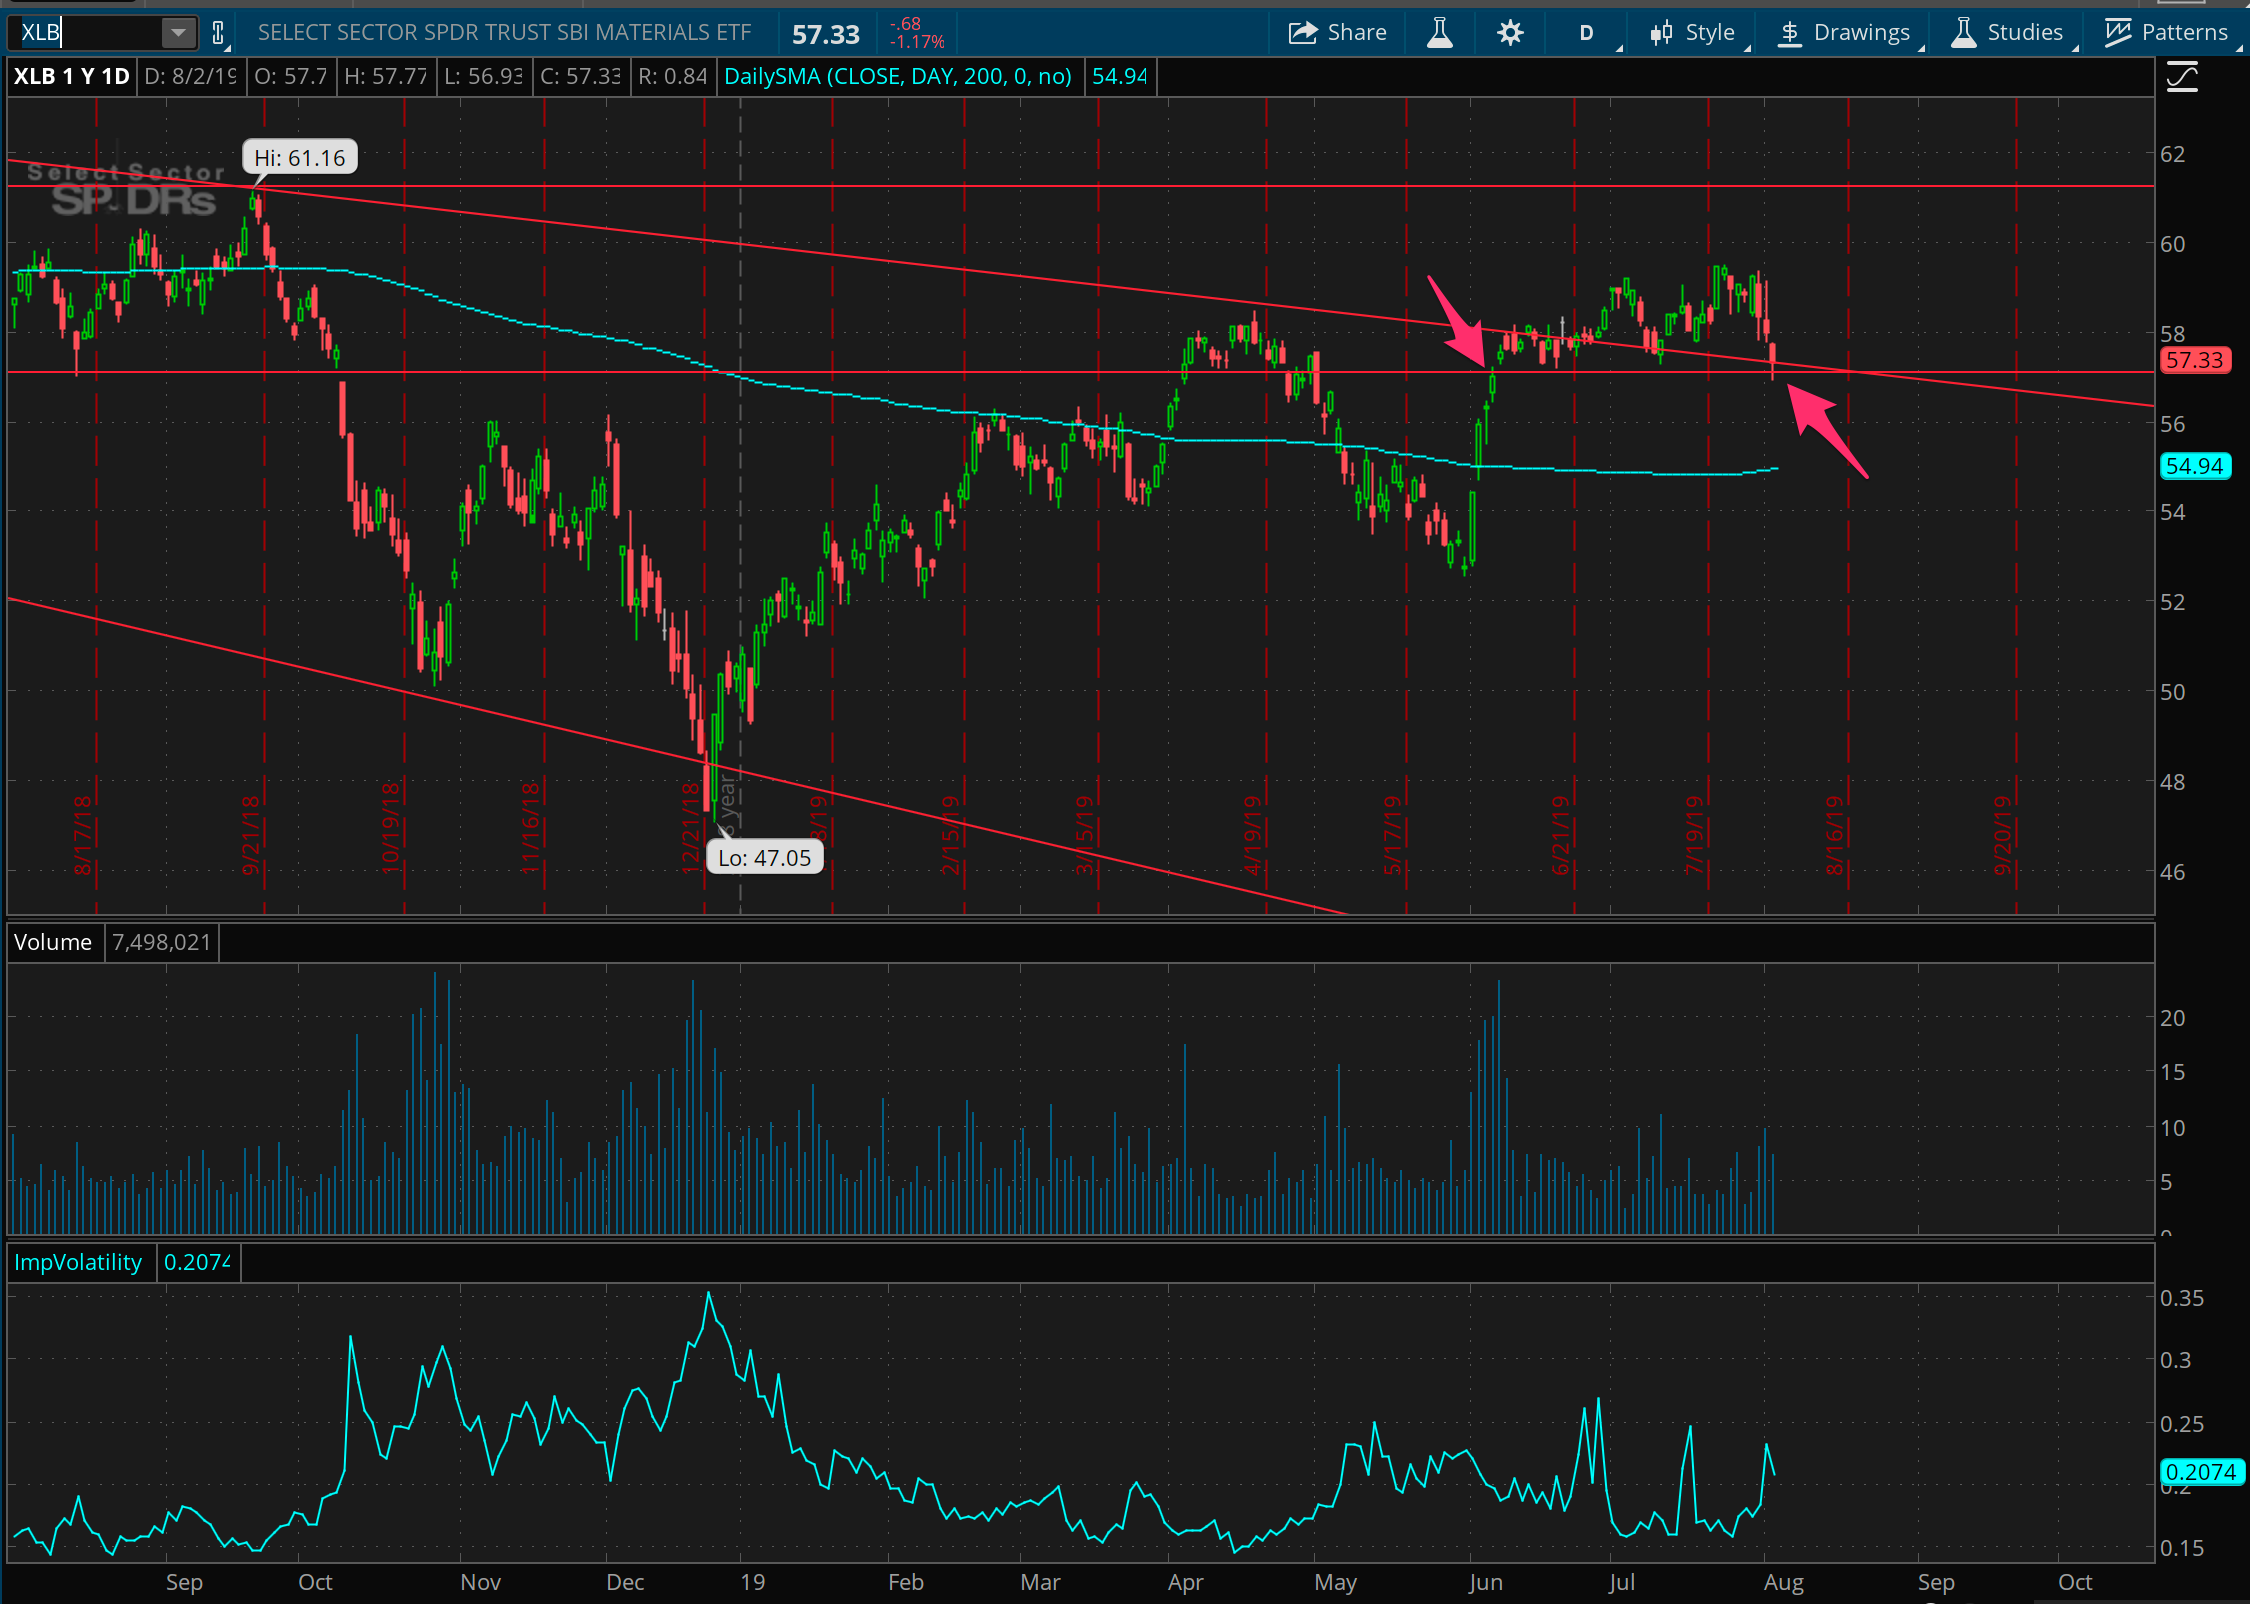
Die, SPDR materials ETF. Is this because I kept mistaking you for the SPDR builders ETF?
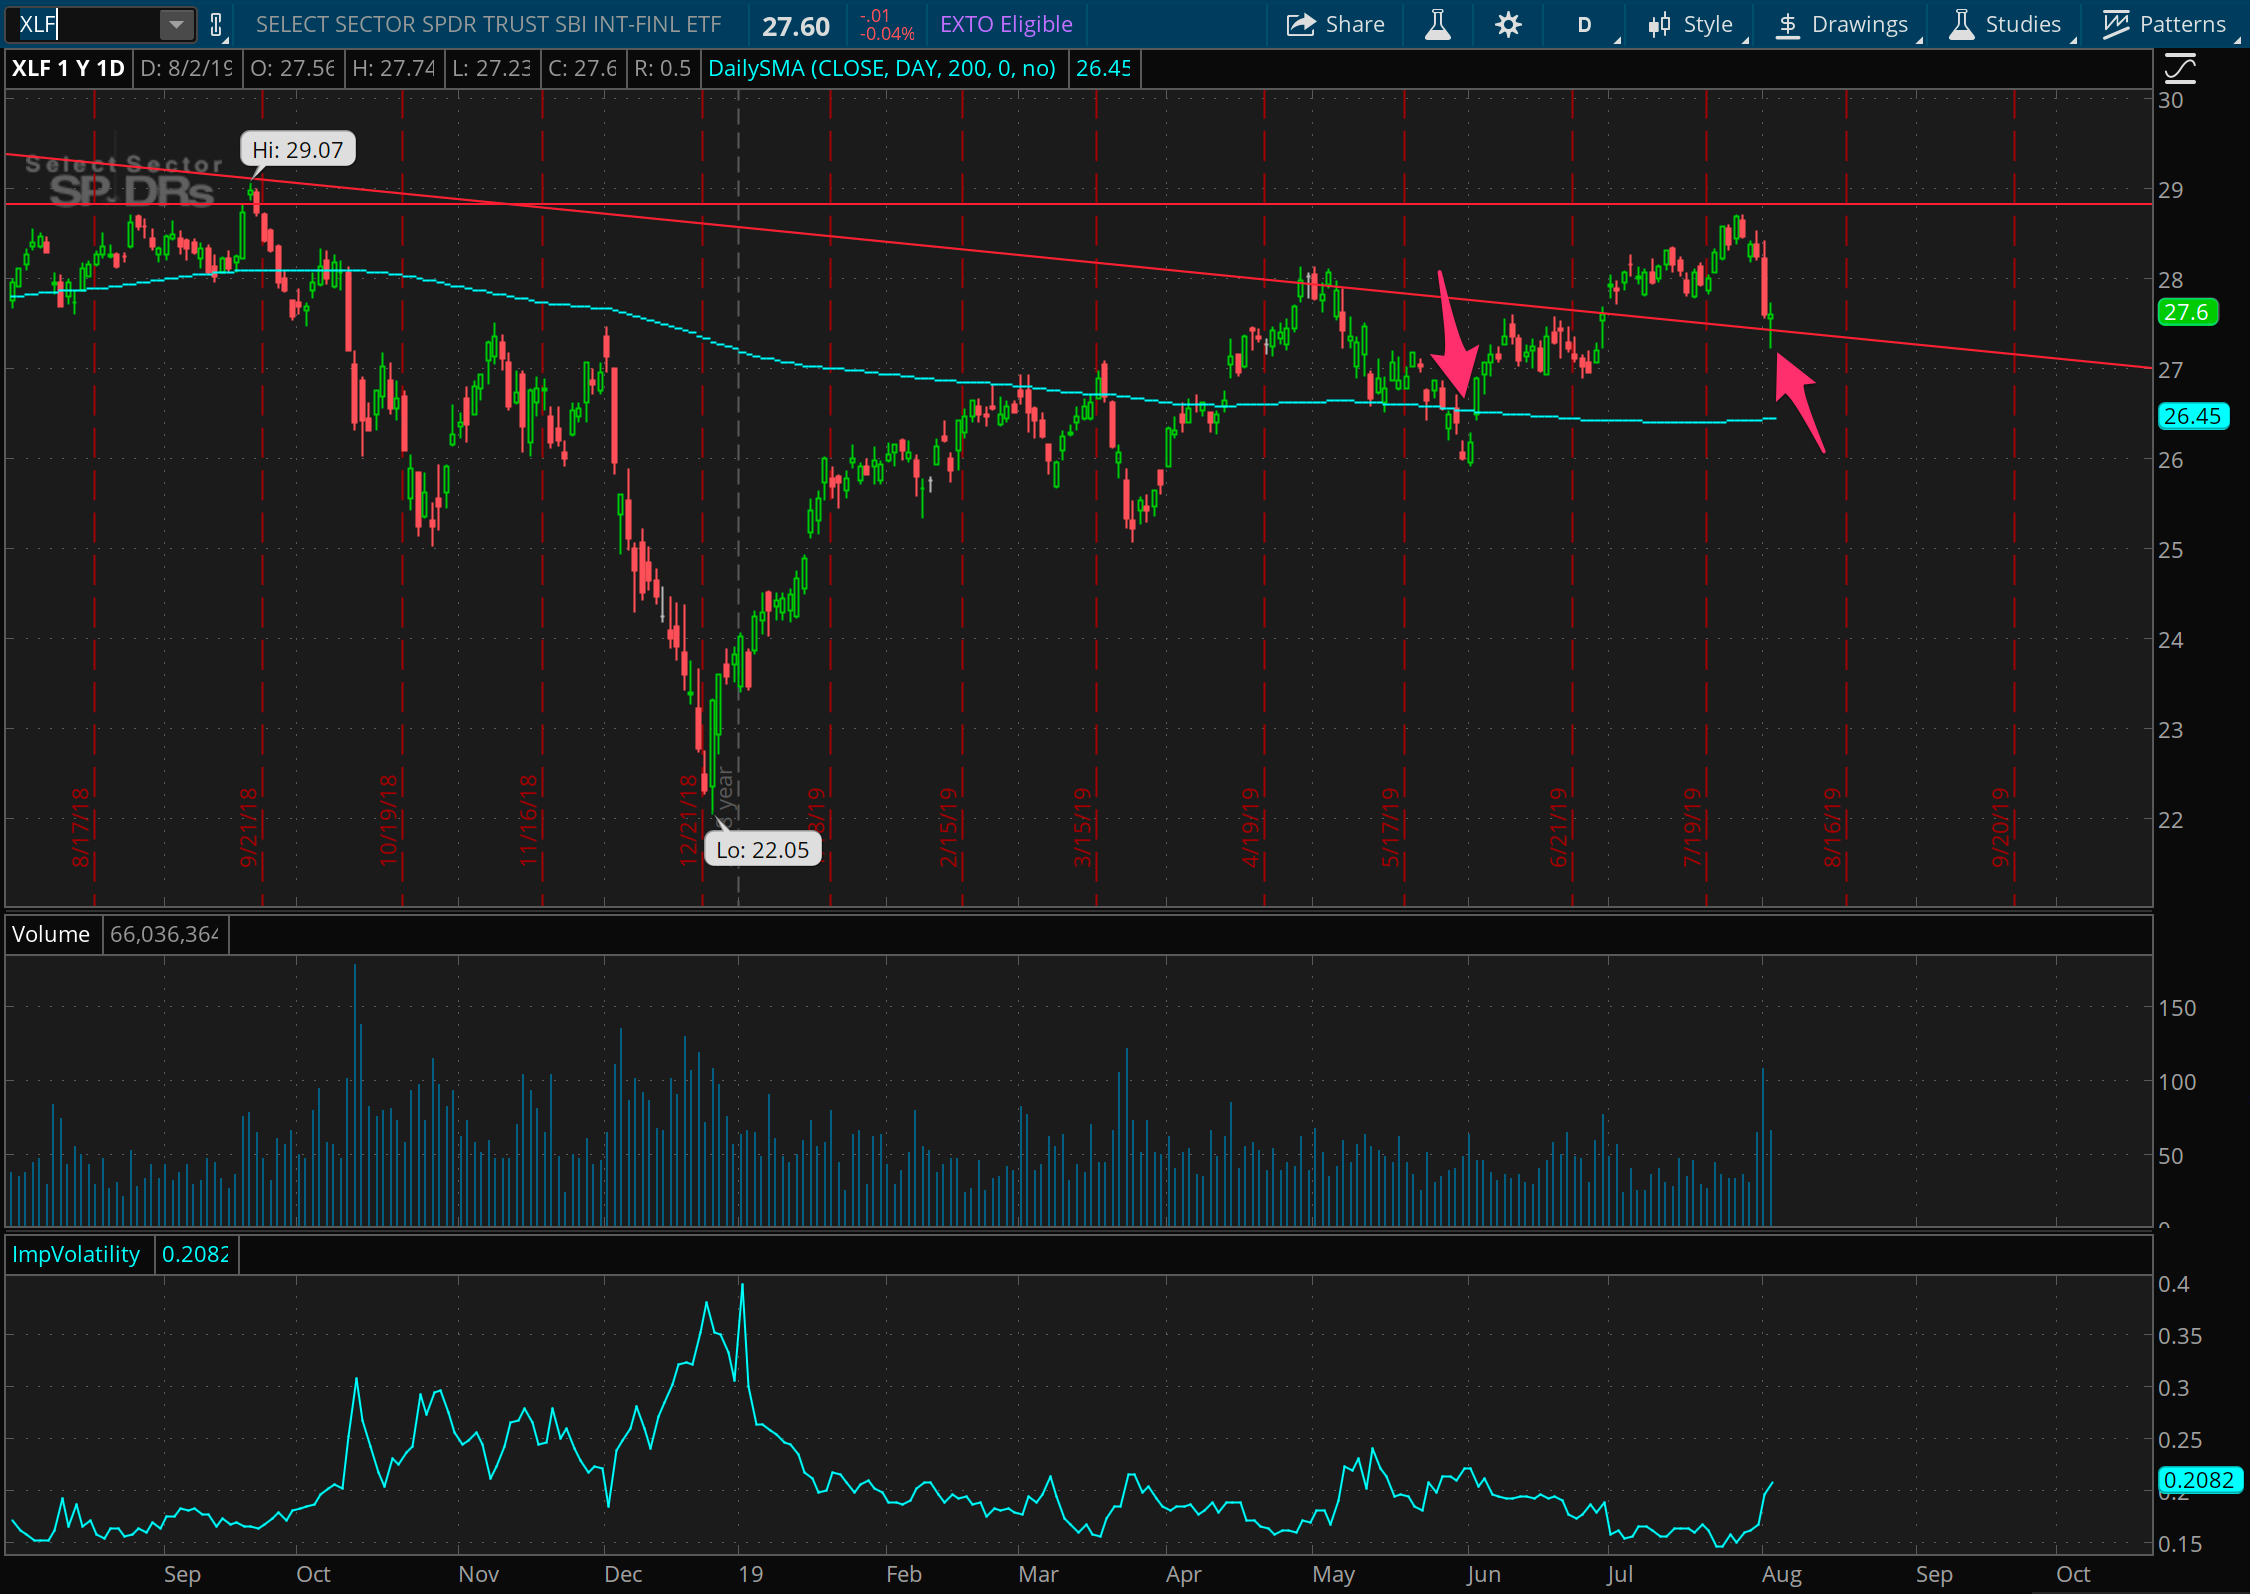
Of the three, XLF looked most obviously like a bad trade to hold onto. Getting out at a small loss here was lucky.
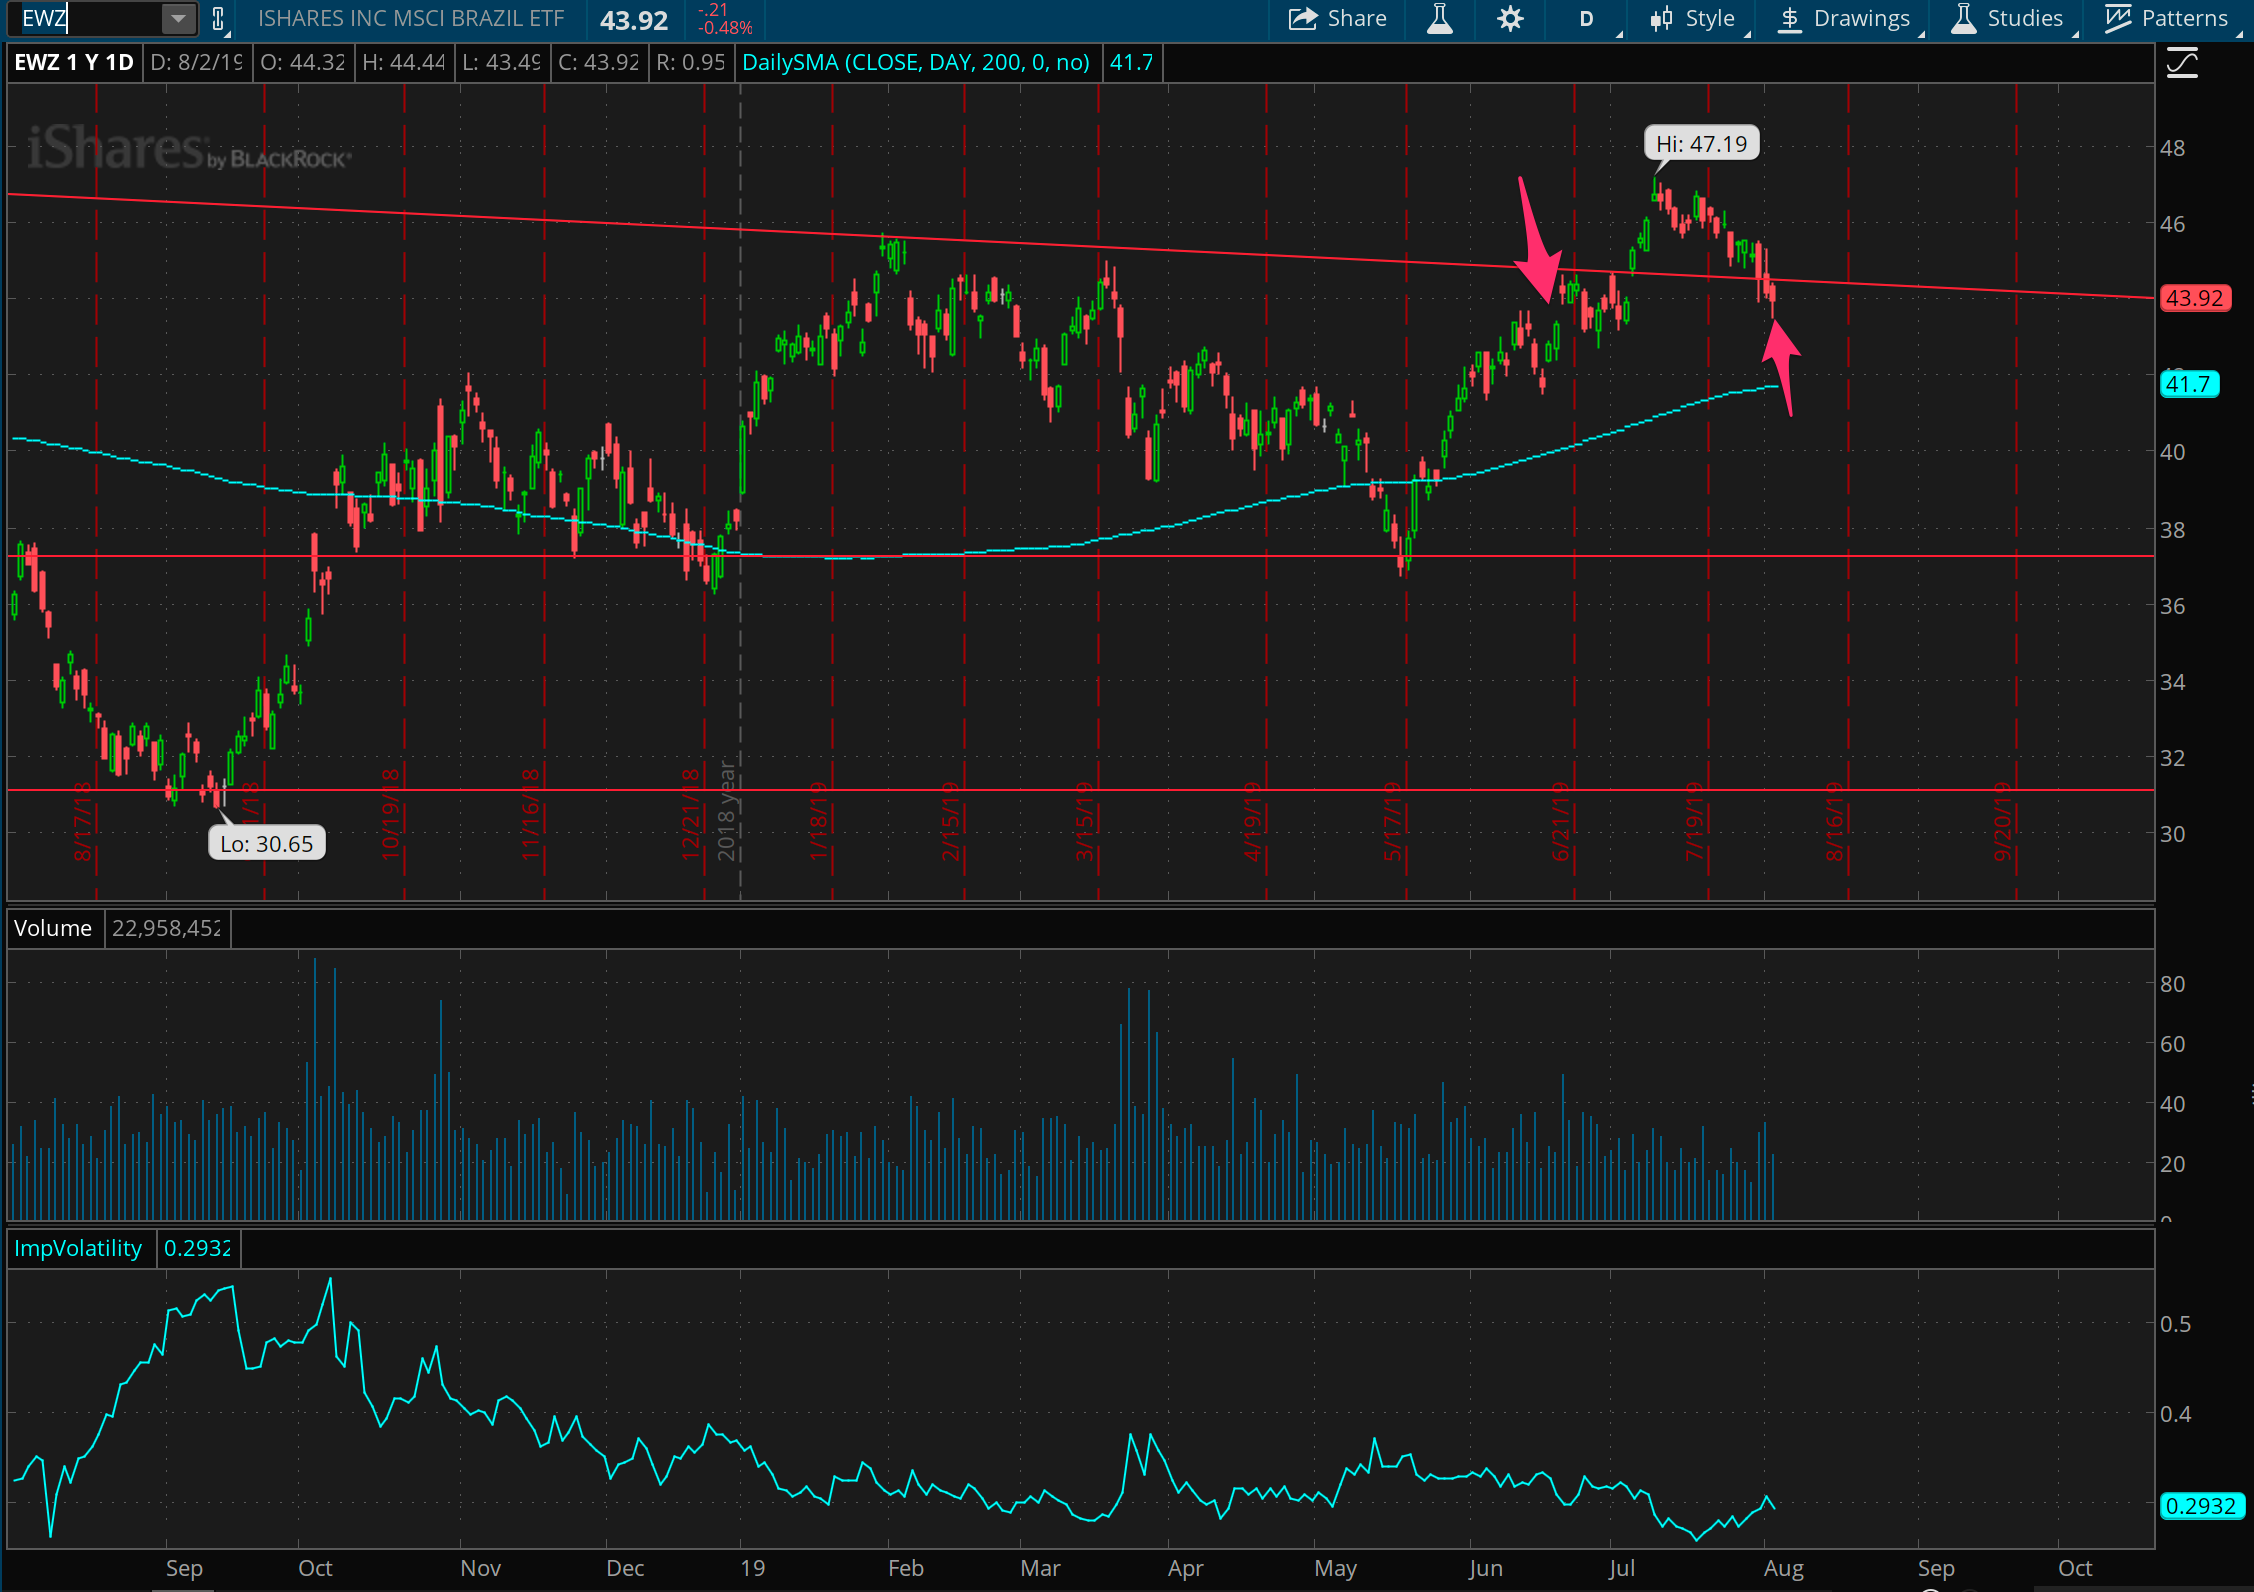
And finally, the Brazil ETF. To be fair, this particular exit was part of the plan considered back a few weeks ago.
And then there were longs. Like Exxon
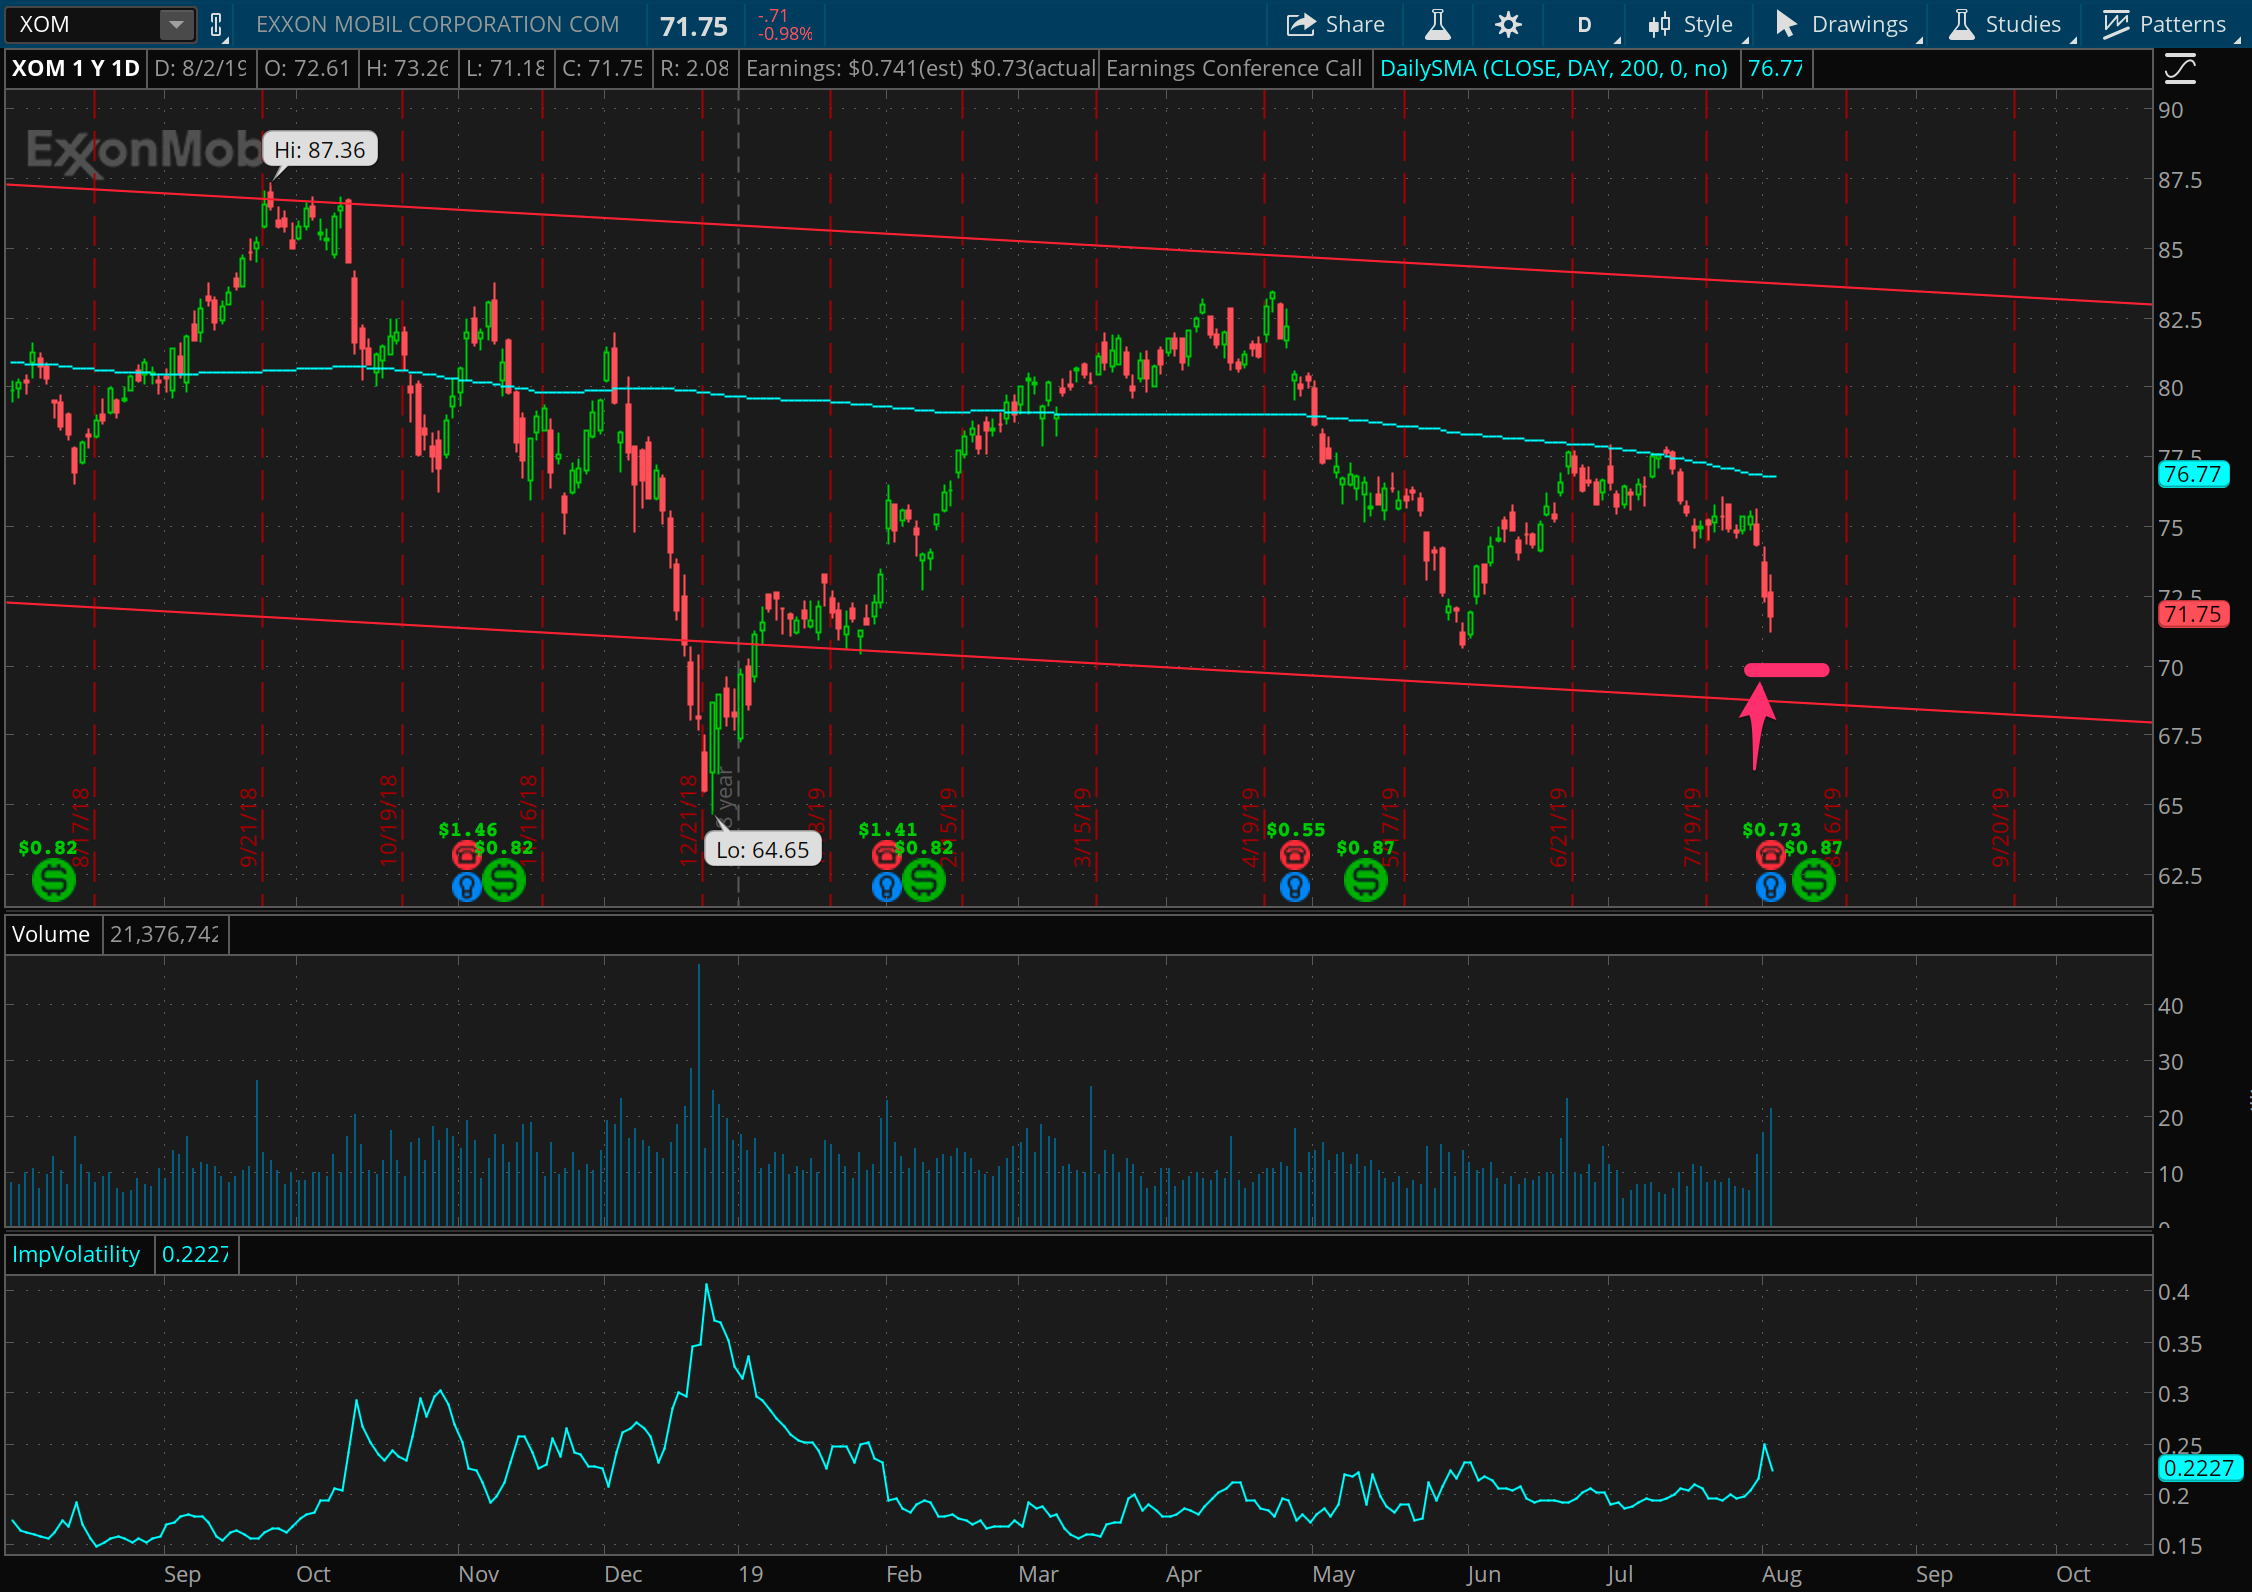
Note the name of the site is “Paid to Fade”. That counts in both directions. Mostly I’ve had a ton of short positions on because of the market in general grinding higher and building downside pressure. But now, with some downward movement, a couple long positions are opening up. Here’s Exxon Mobile, which had earnings this week. As part of earnings, and afterwards, I put on some short puts at 70 betting that the stock is supported at these levels. Now it’s time to hold steady and see prices rebound, or volatility shrink, or ideally both.
A trade not made of steel
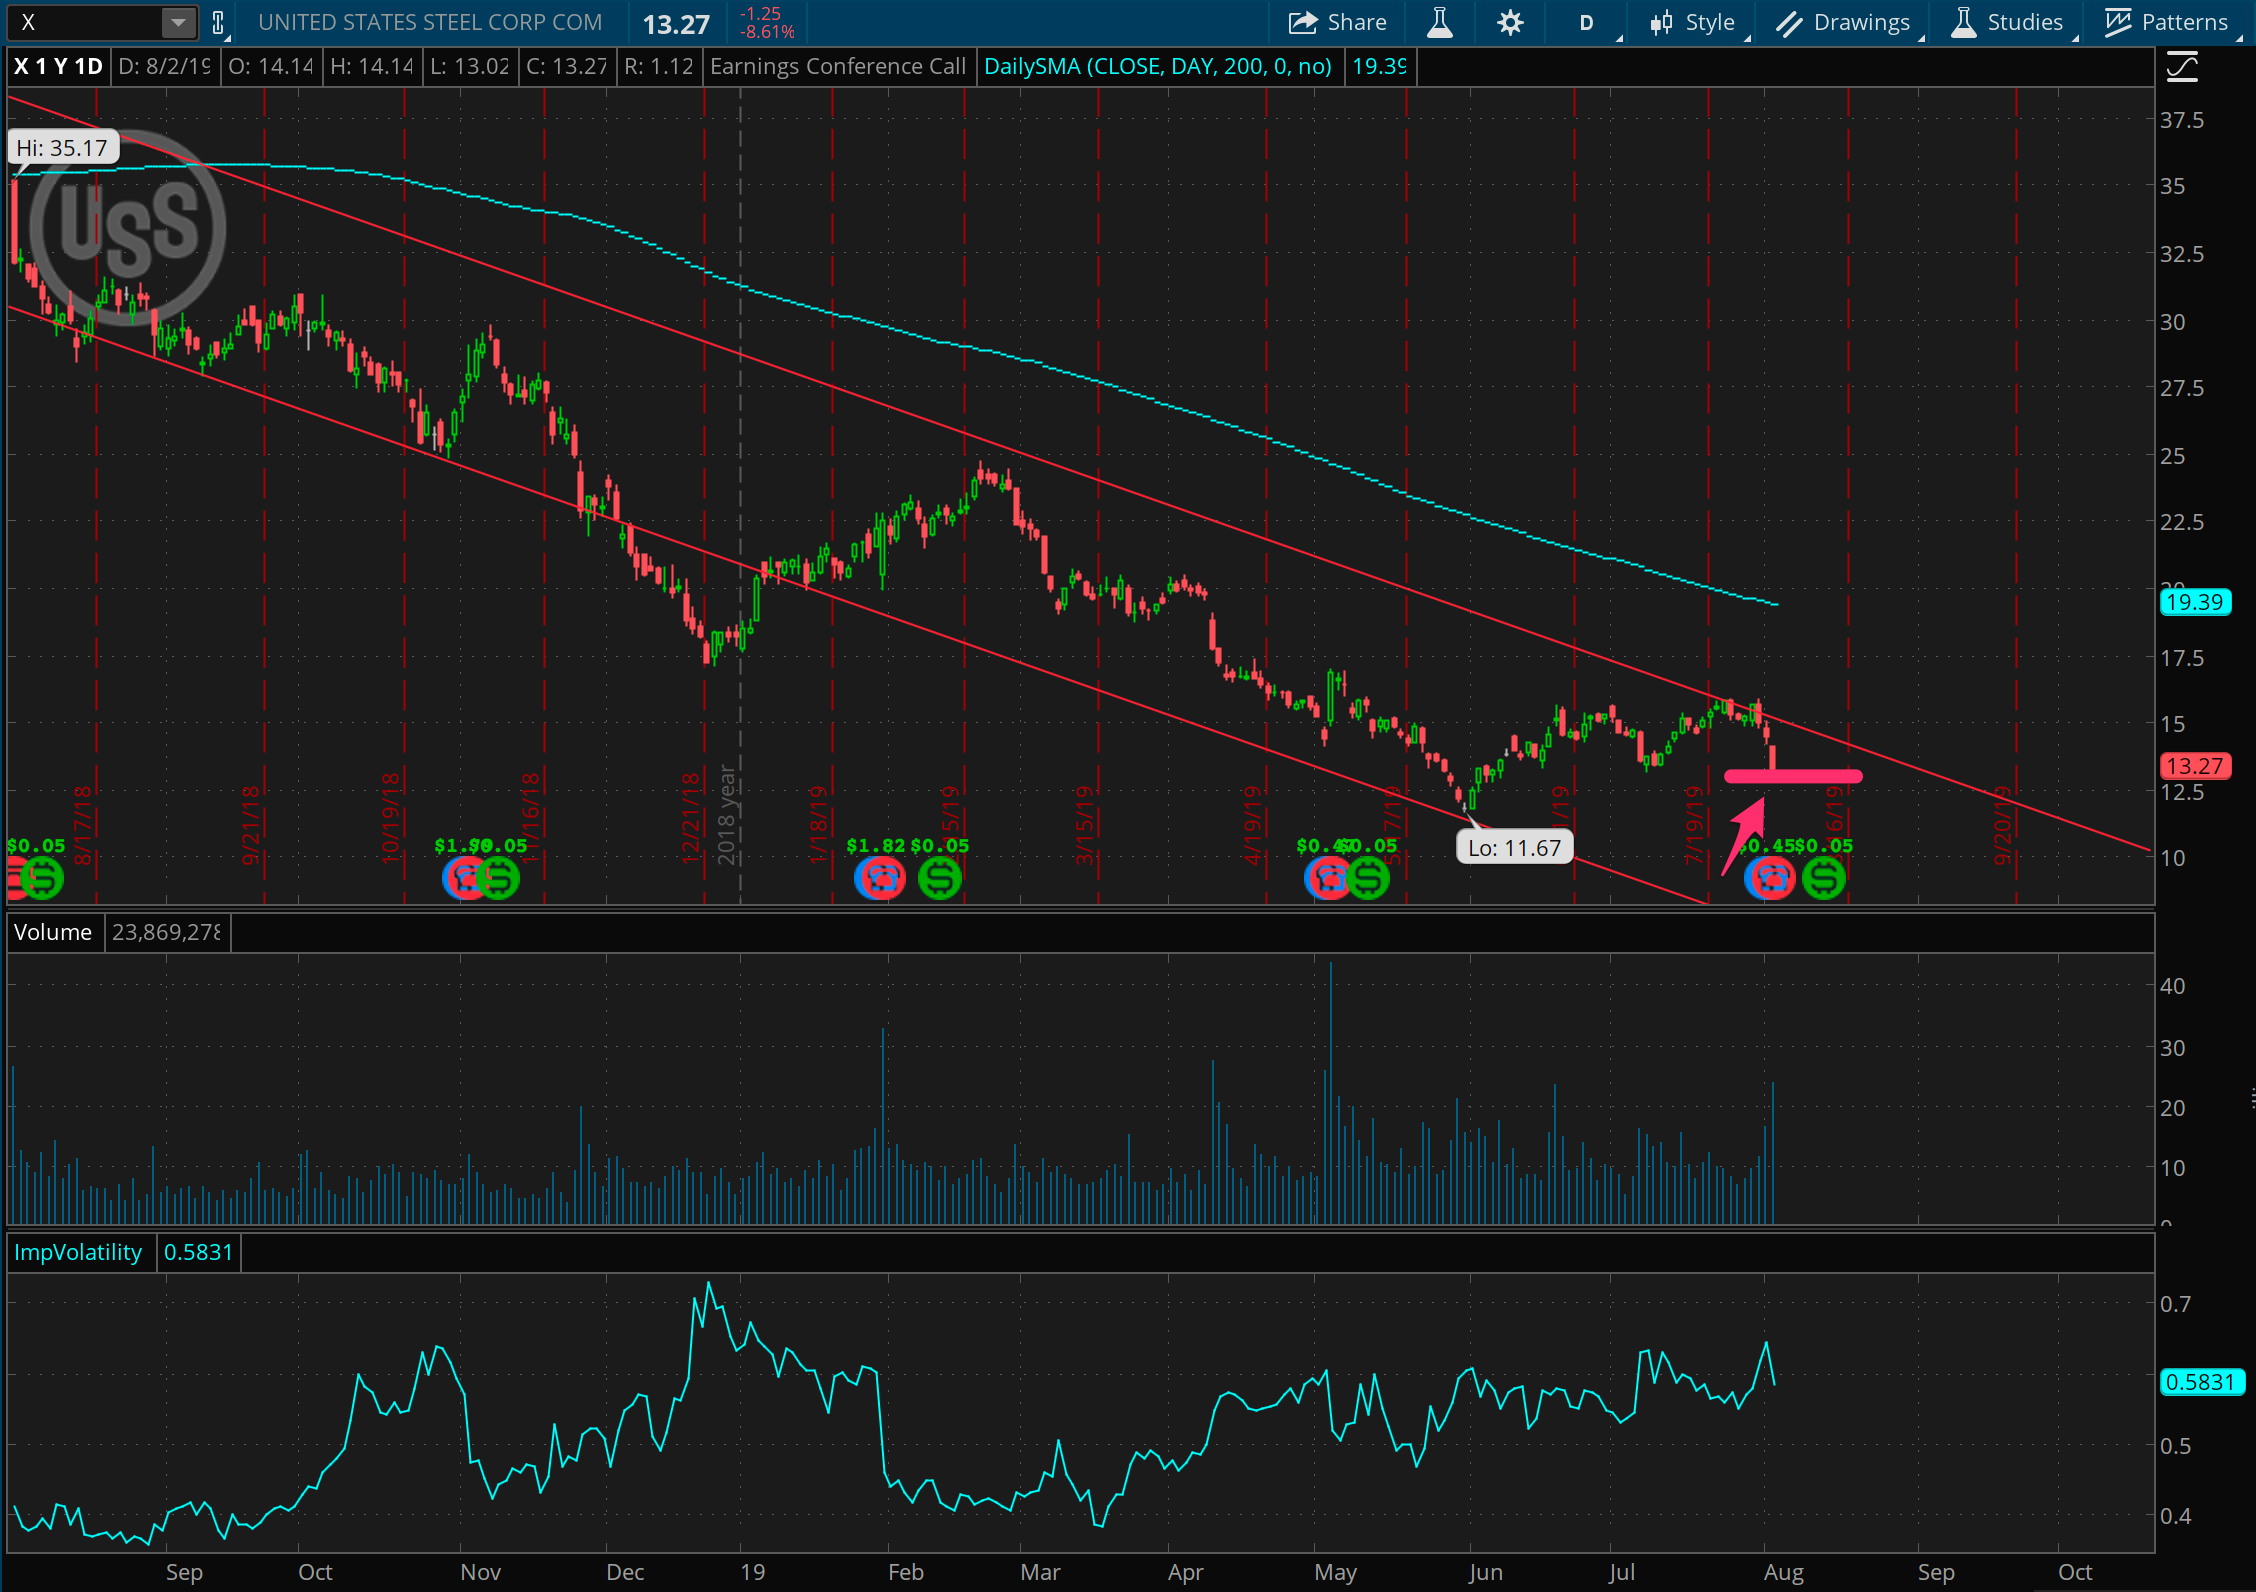
Here’s a trade I already don’t like. I stepped into this as an earnings play this week on the long side, with U.S. Steel reporting and having a pretty high implied volatility. Alas, it’s had a high volatility for months, and based on my read of the trend, betting on support here (as I’m doing) feels like a losing bet. The fact that it had an earnings beat and still dropped might be an indicator that the trend is in control. At any rate, whether I add calls to neutralize or not, I’m hoping to exit this trade sooner rather than later.