Lull, lift, lull, lift
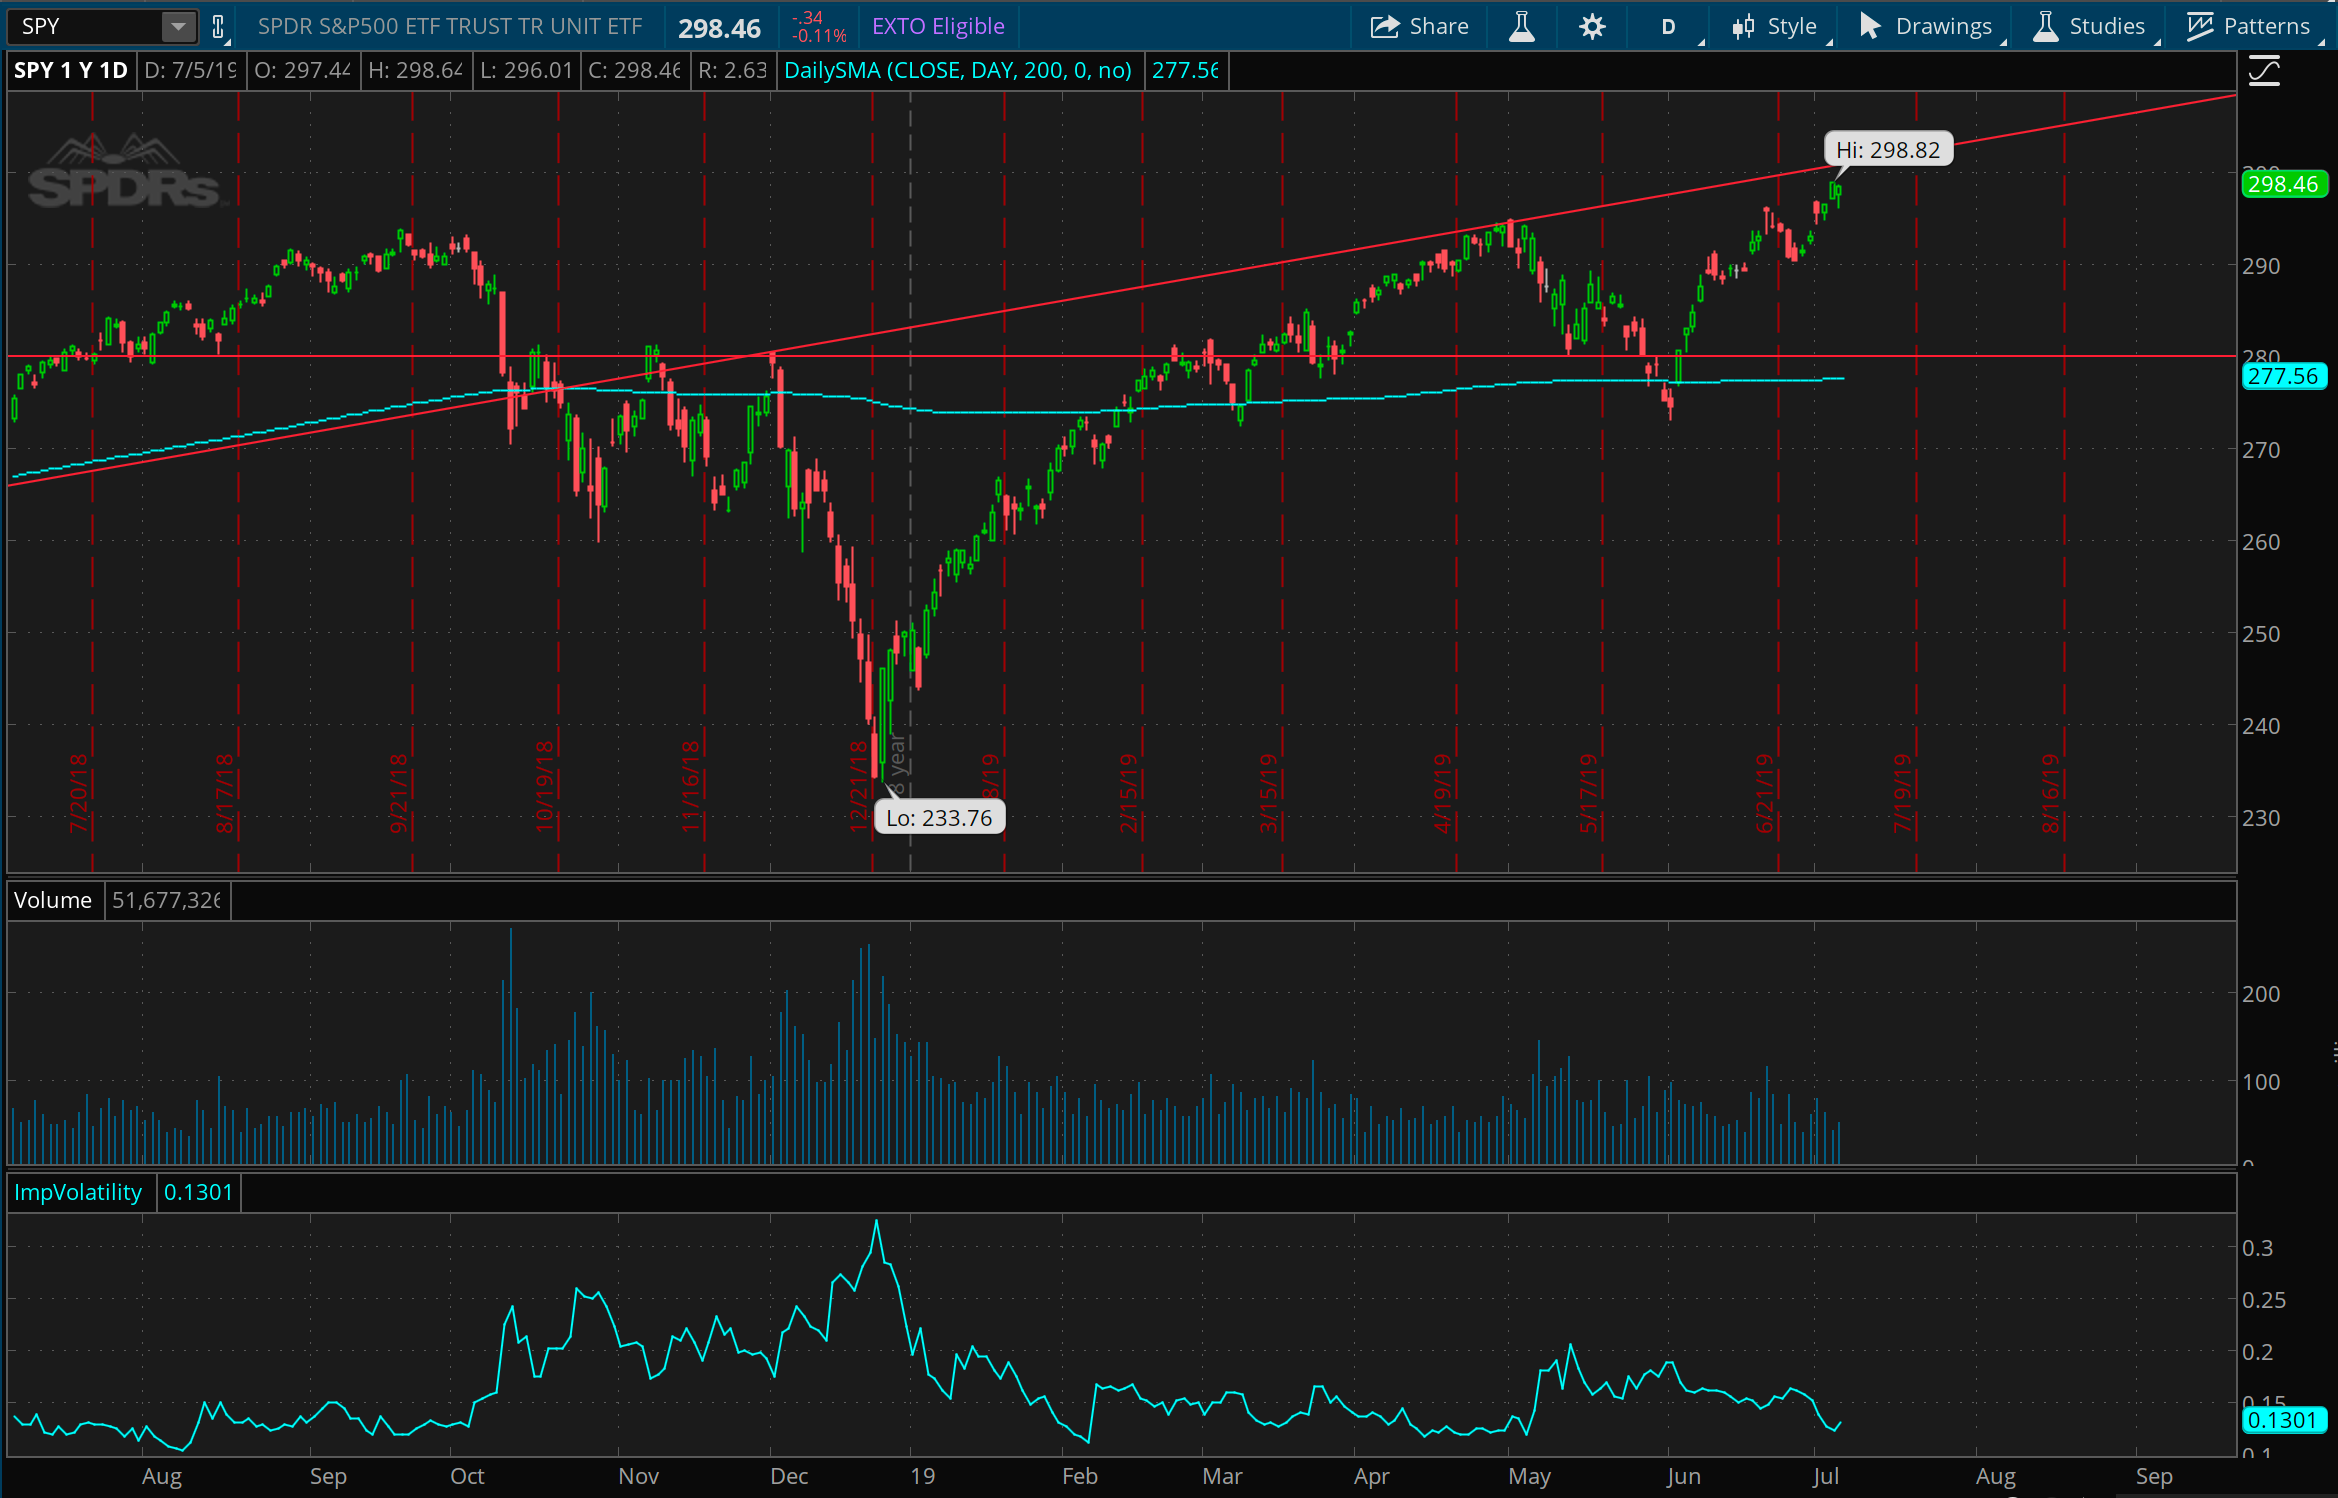
It’s lift week. We’ve watched a steady pattern over the past 5 weeks of rally, sideways, rally, sideways, rally. Or rather, what I’m calling it: lift, lull, lift, lull, lift. Hard to know what to make of this holiday week of low volume, steady rising price action, really. If you’ve accumulated some short positions (like I have), I think mostly you just want time right now. This steady rise hasn’t completely outpaced itself, and could continue this gentle rise for a while, but it seems far more likely than not, given the volatility that’s continued in the market from last year, that we could see 280 in SPY again over the next couple months, if not weeks.
AAPL, turn over!
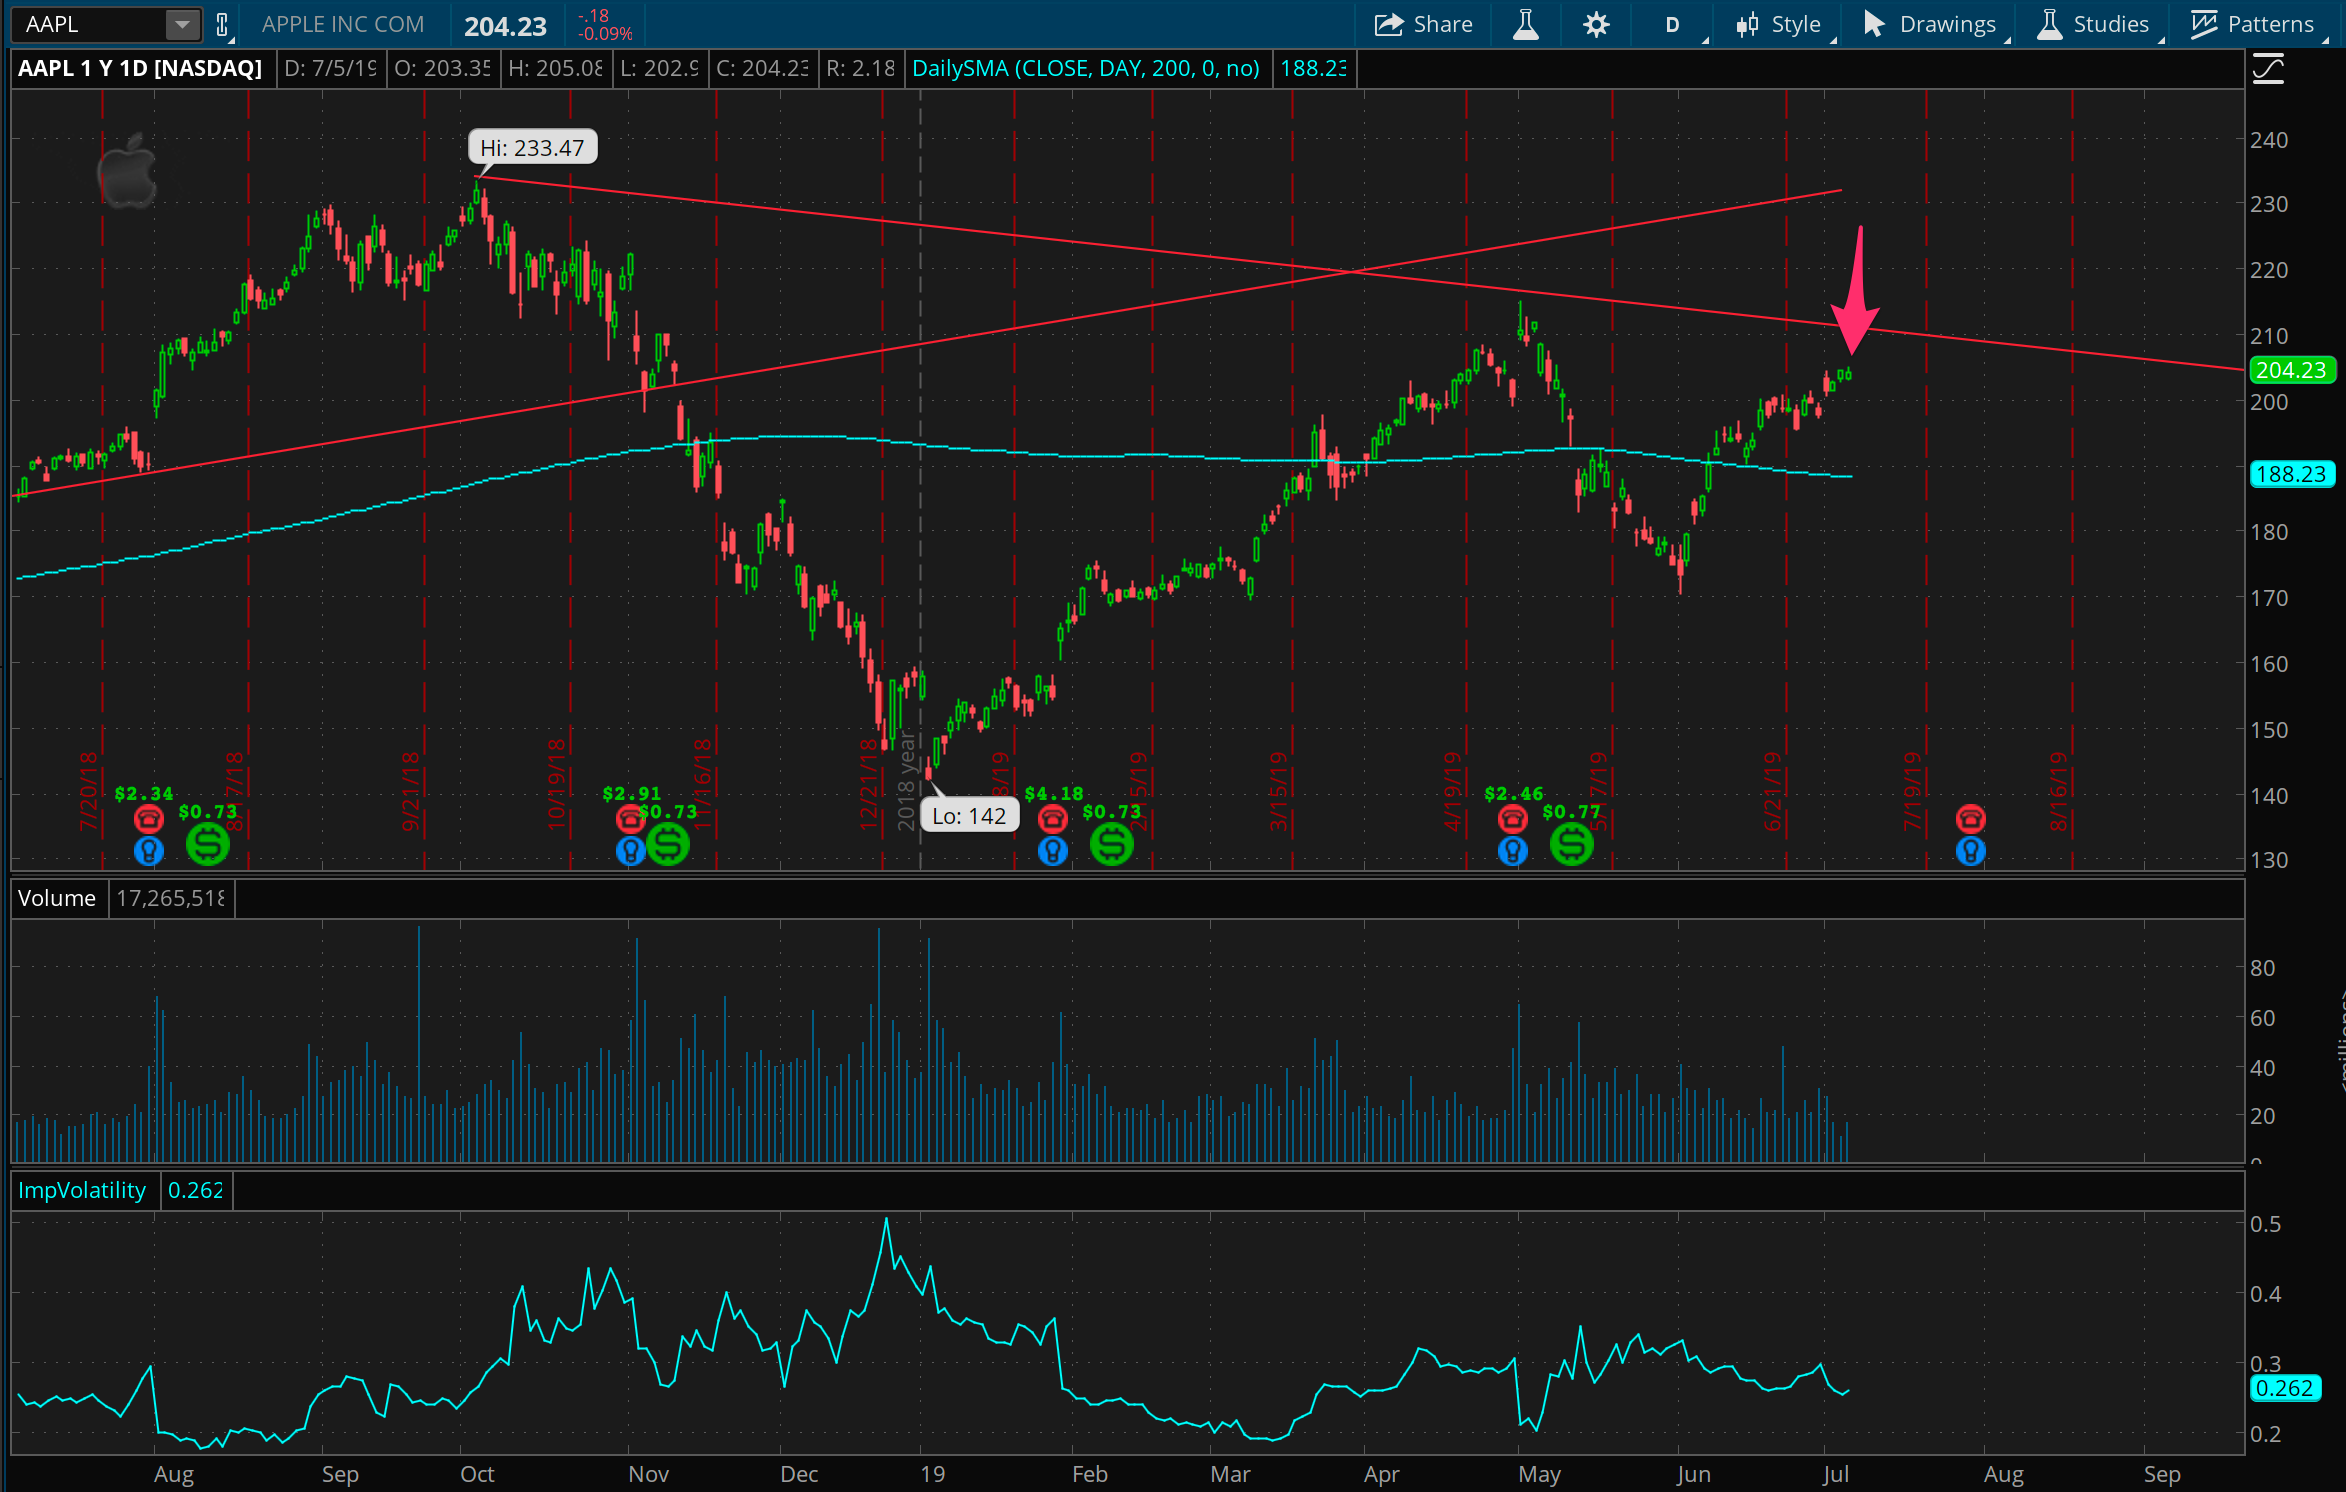
After a second quick trade in AAPL last week, I am back yet again for a hopefully quick AAPL short. It’s feeling a bit like a ride at Disney without any lines, where you get off, and get right back on. Here’s hoping I don’t get sick one of these times. But AAPL continues to feel like it’s got more resistance than support at these levels, and a call spread at 210 feels like a good place to pick a fight.
Brazil breakout?
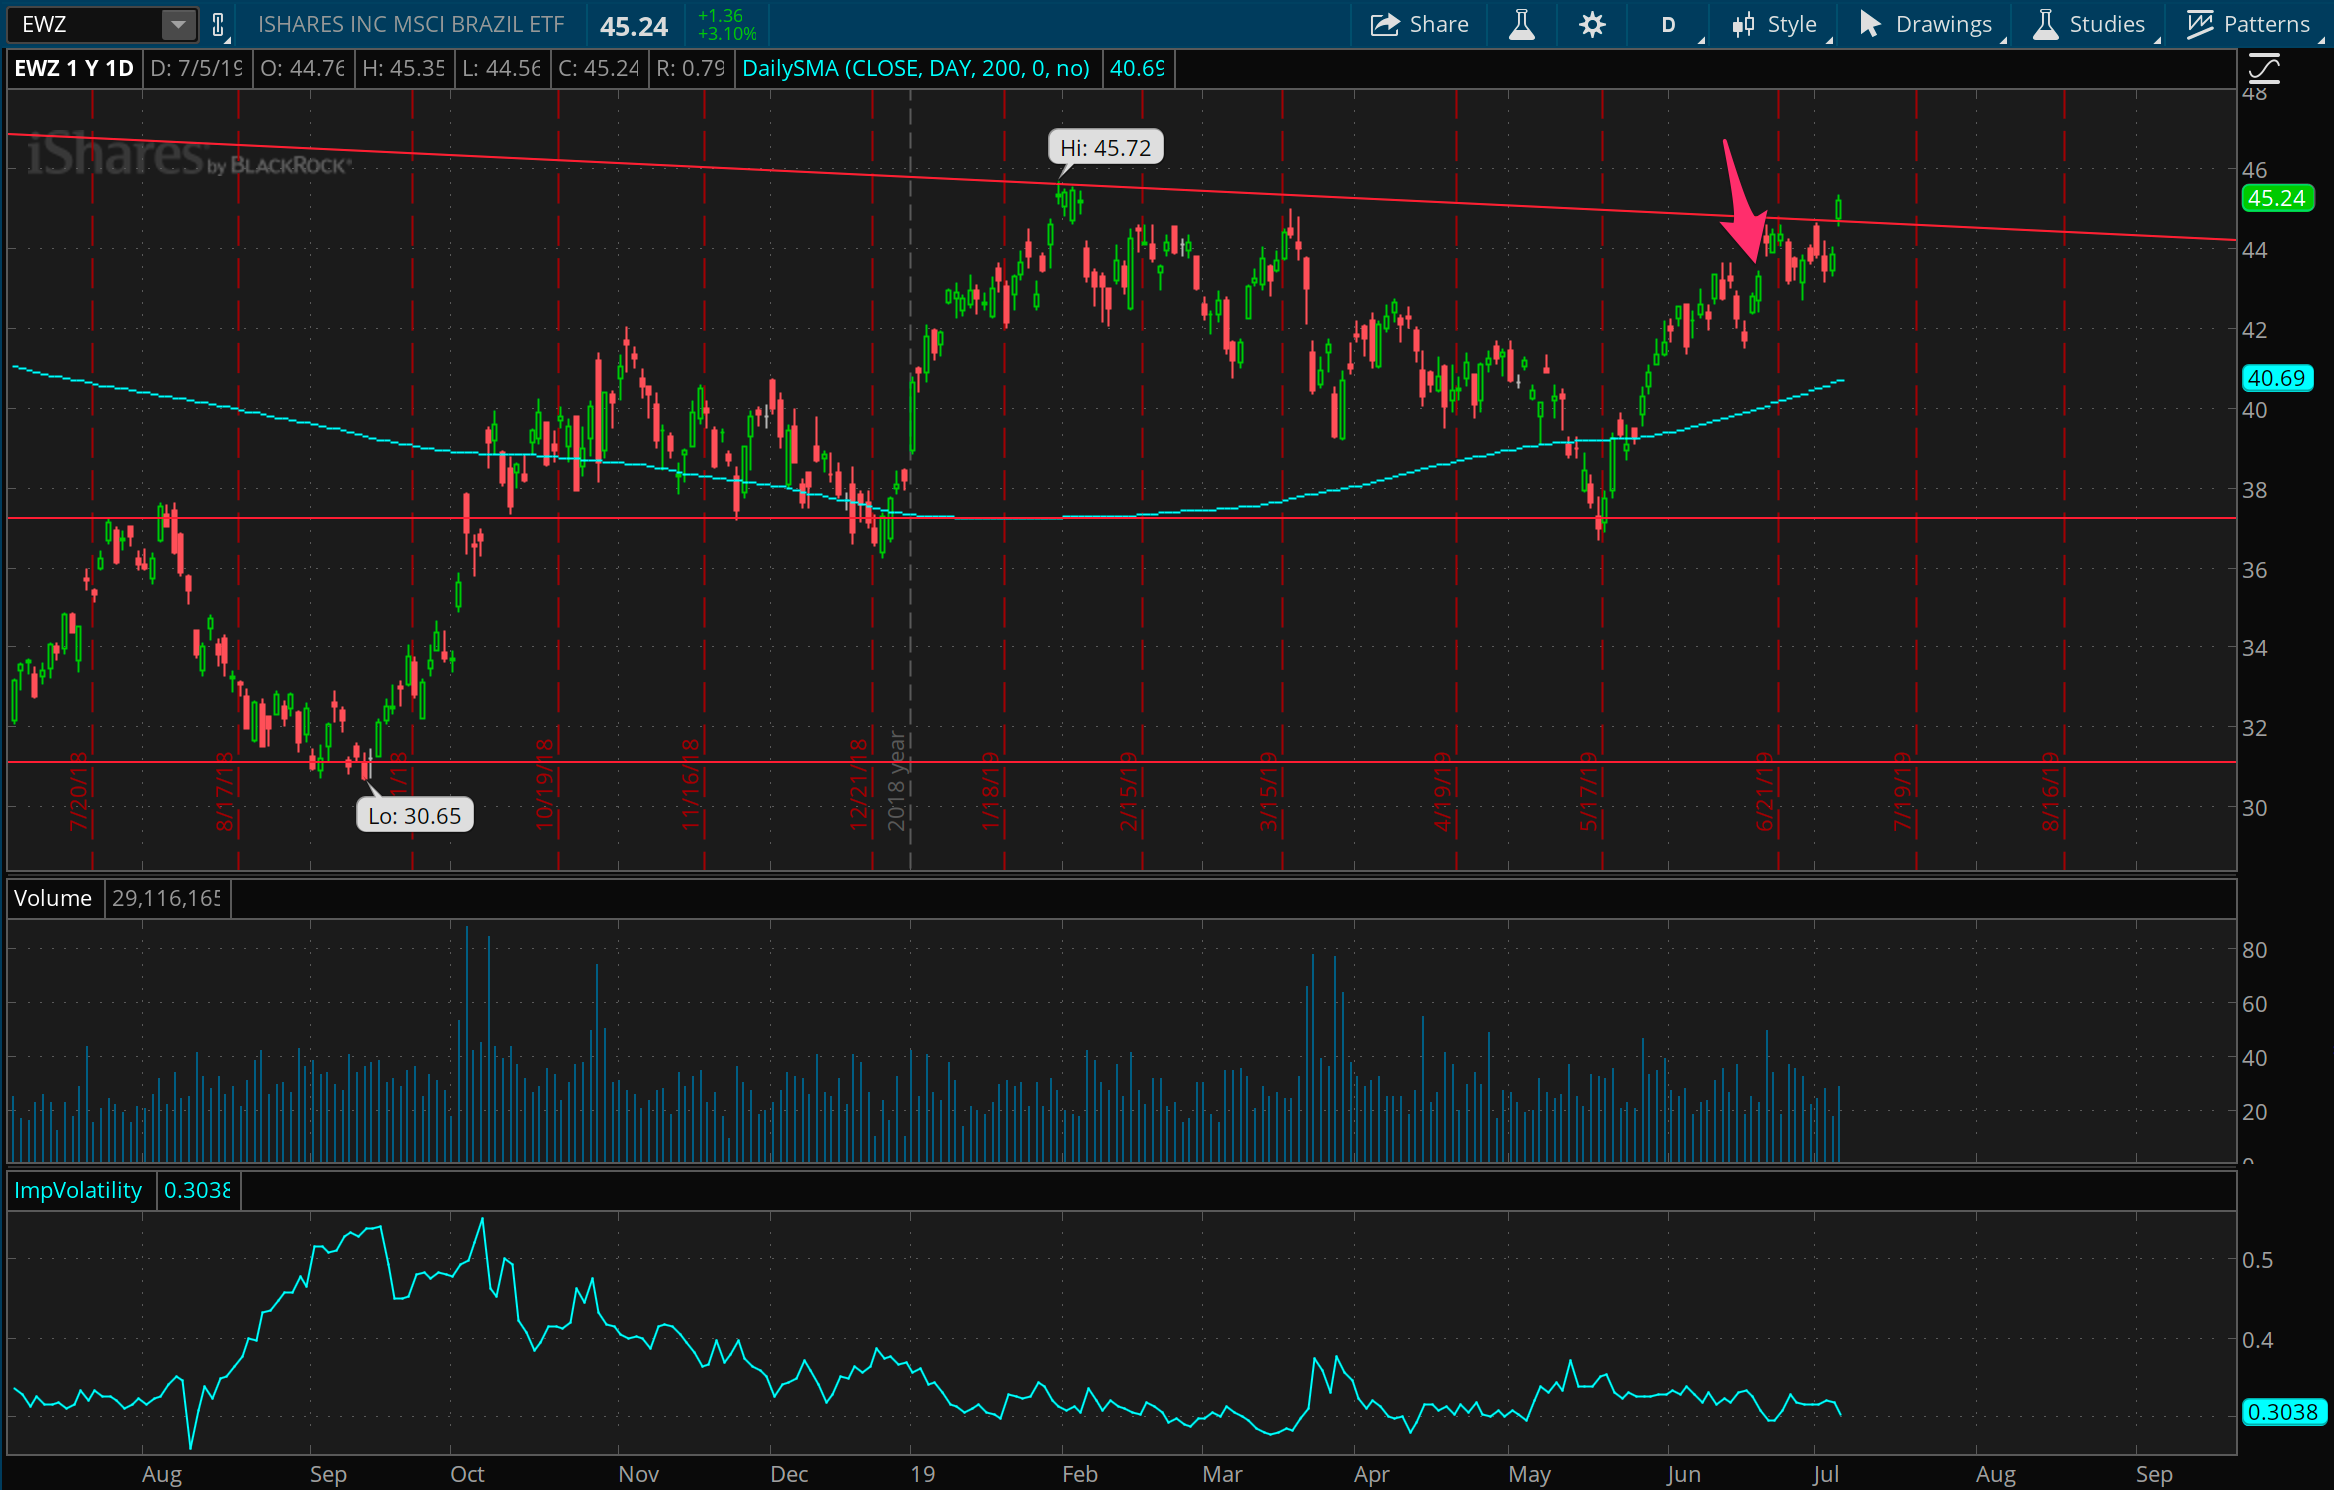
There’s a general theme to the updates this week, which is me starting to question a number of short positions I’ve put on over the past week or two. Case in point is a resistance trade I put on in the Brazilian ETF, EWZ, two weeks ago. The general confidence presented by the downward trendline got a bit smashed at the end of this week, as EWZ had a pretty hefty gap up to a level just short of it’s 52 week high at 45.72. Rising further above 46 could mean trouble on this trade, but the general price pattern over the past year has been big rallies followed by slow declines, so we may see that play out again.
Crossing paths with a CAT
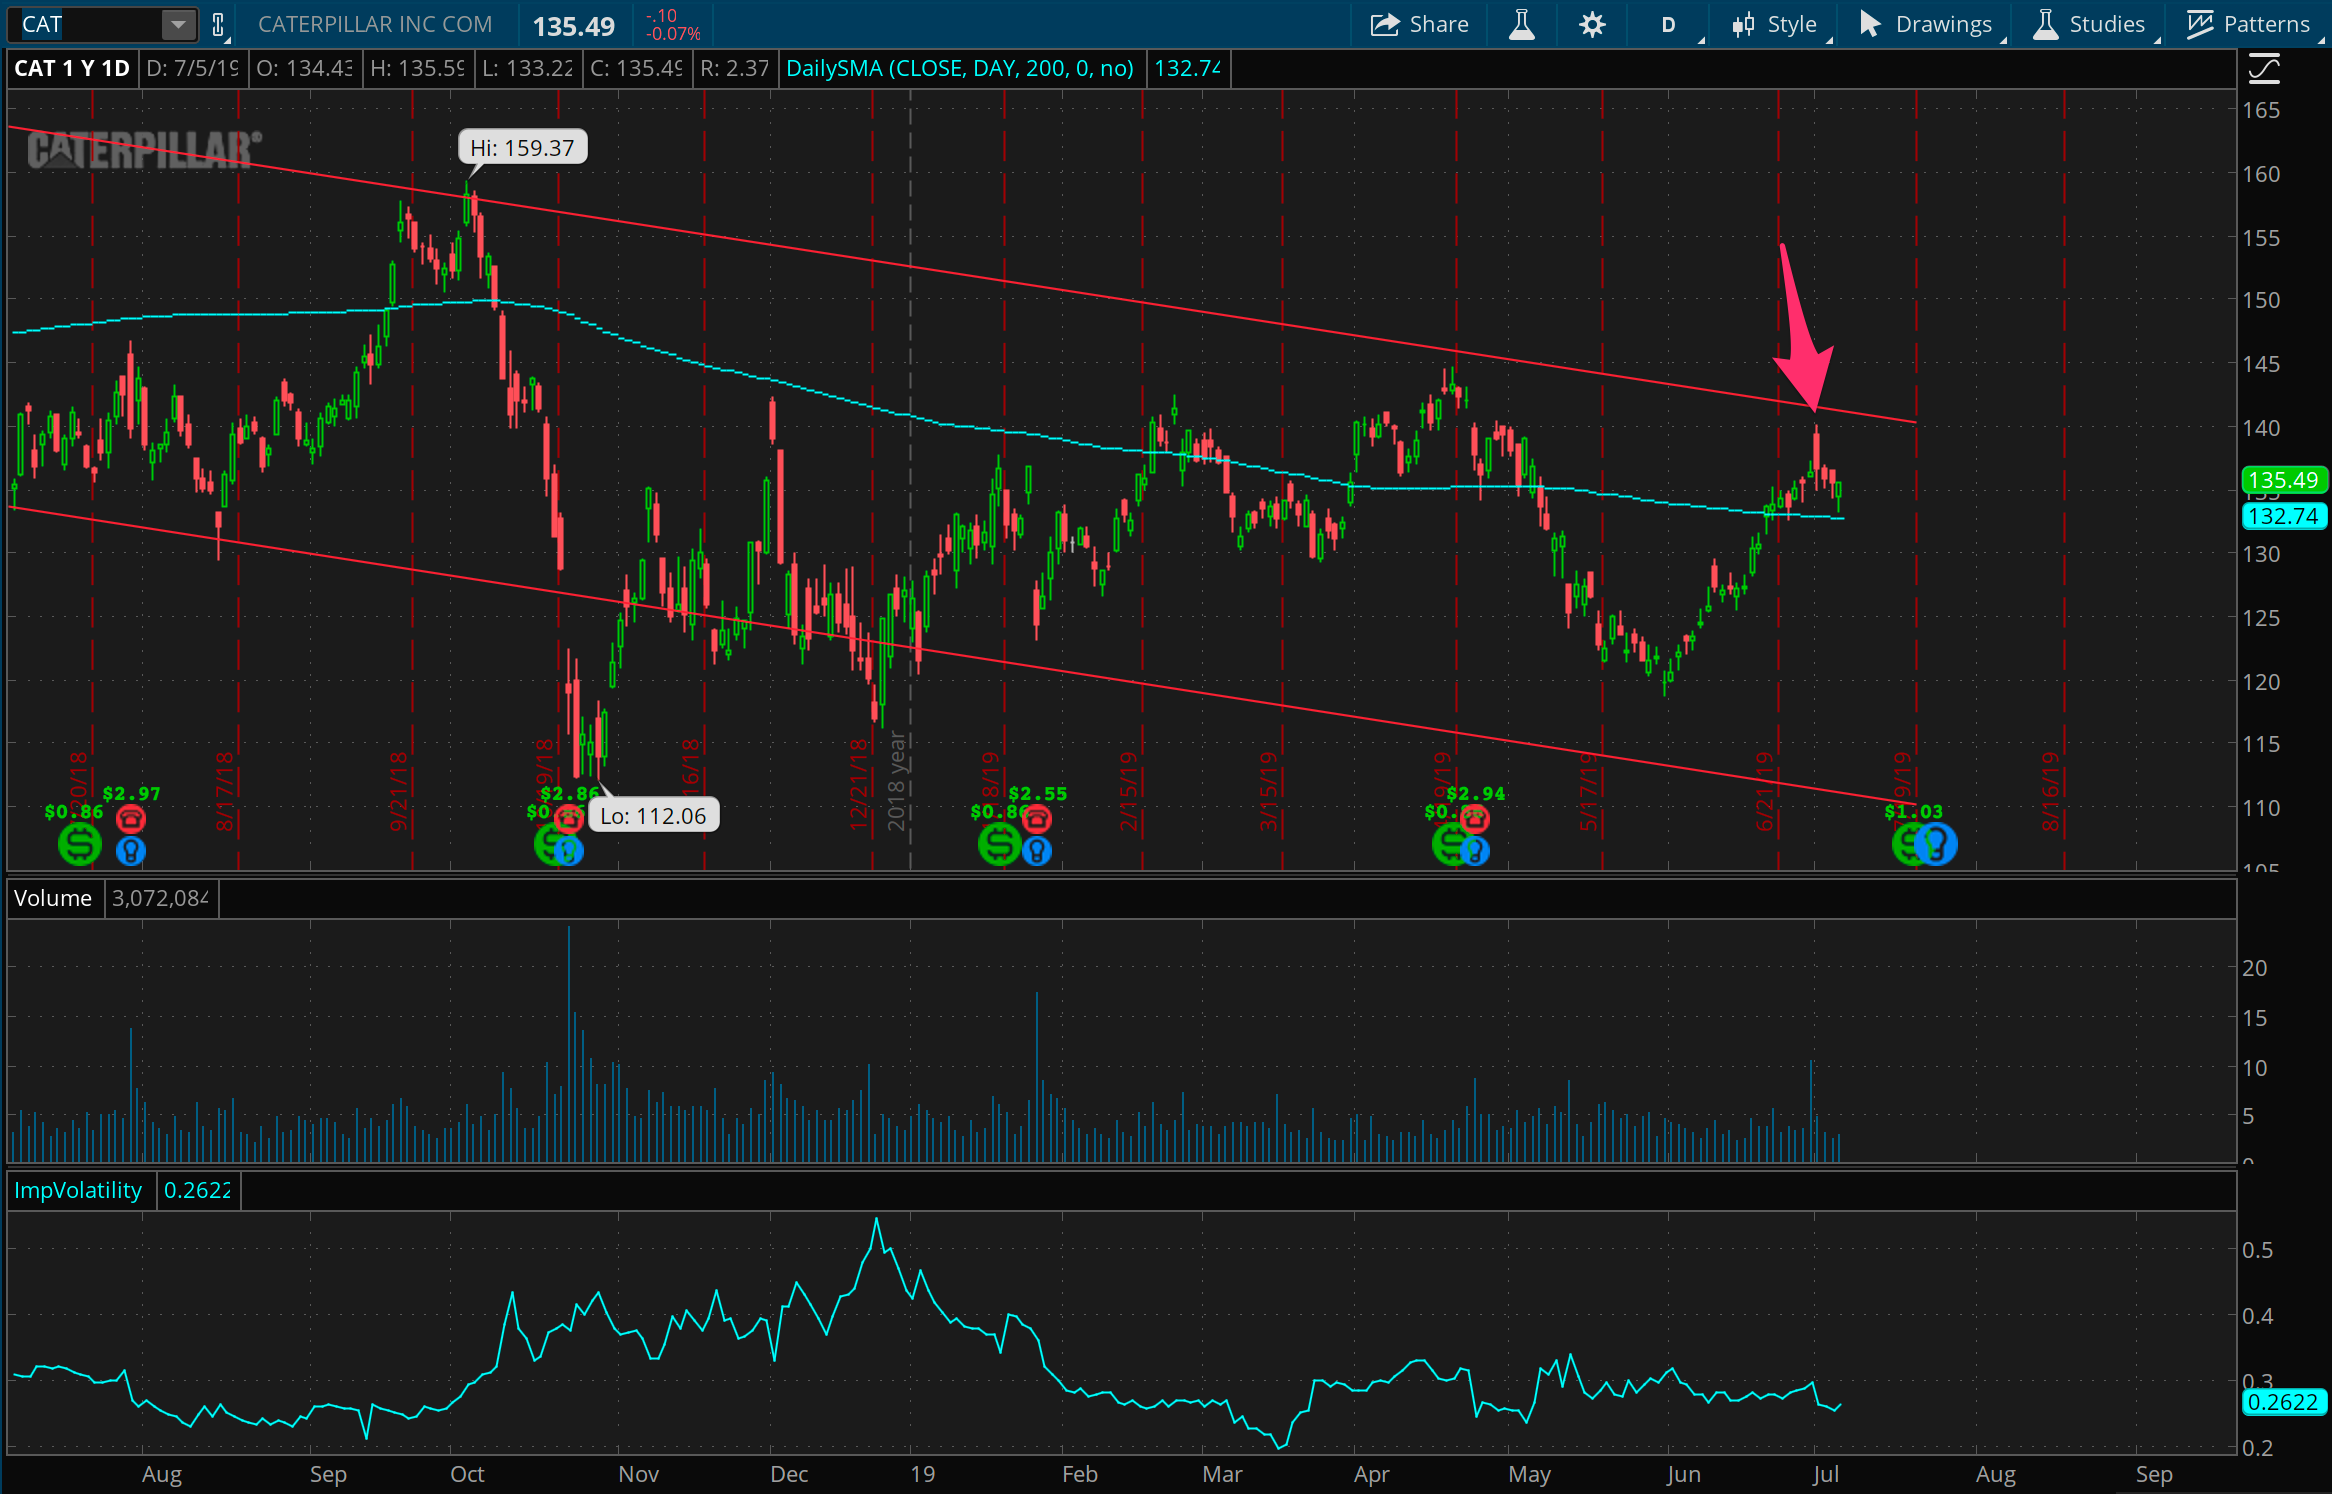
After watching CAT for a few weeks, we’ve finally seen it reach up to the top end of a downward price channel it’s been in for around 2 years. So early this week I put on trade betting on resistance at the 140 level. CAT is struggling to keep up with the broad market, and there’s a ton of room to the downside for this one given prior falls, though it could take several weeks before it plays out.
Testing the top in NFLX
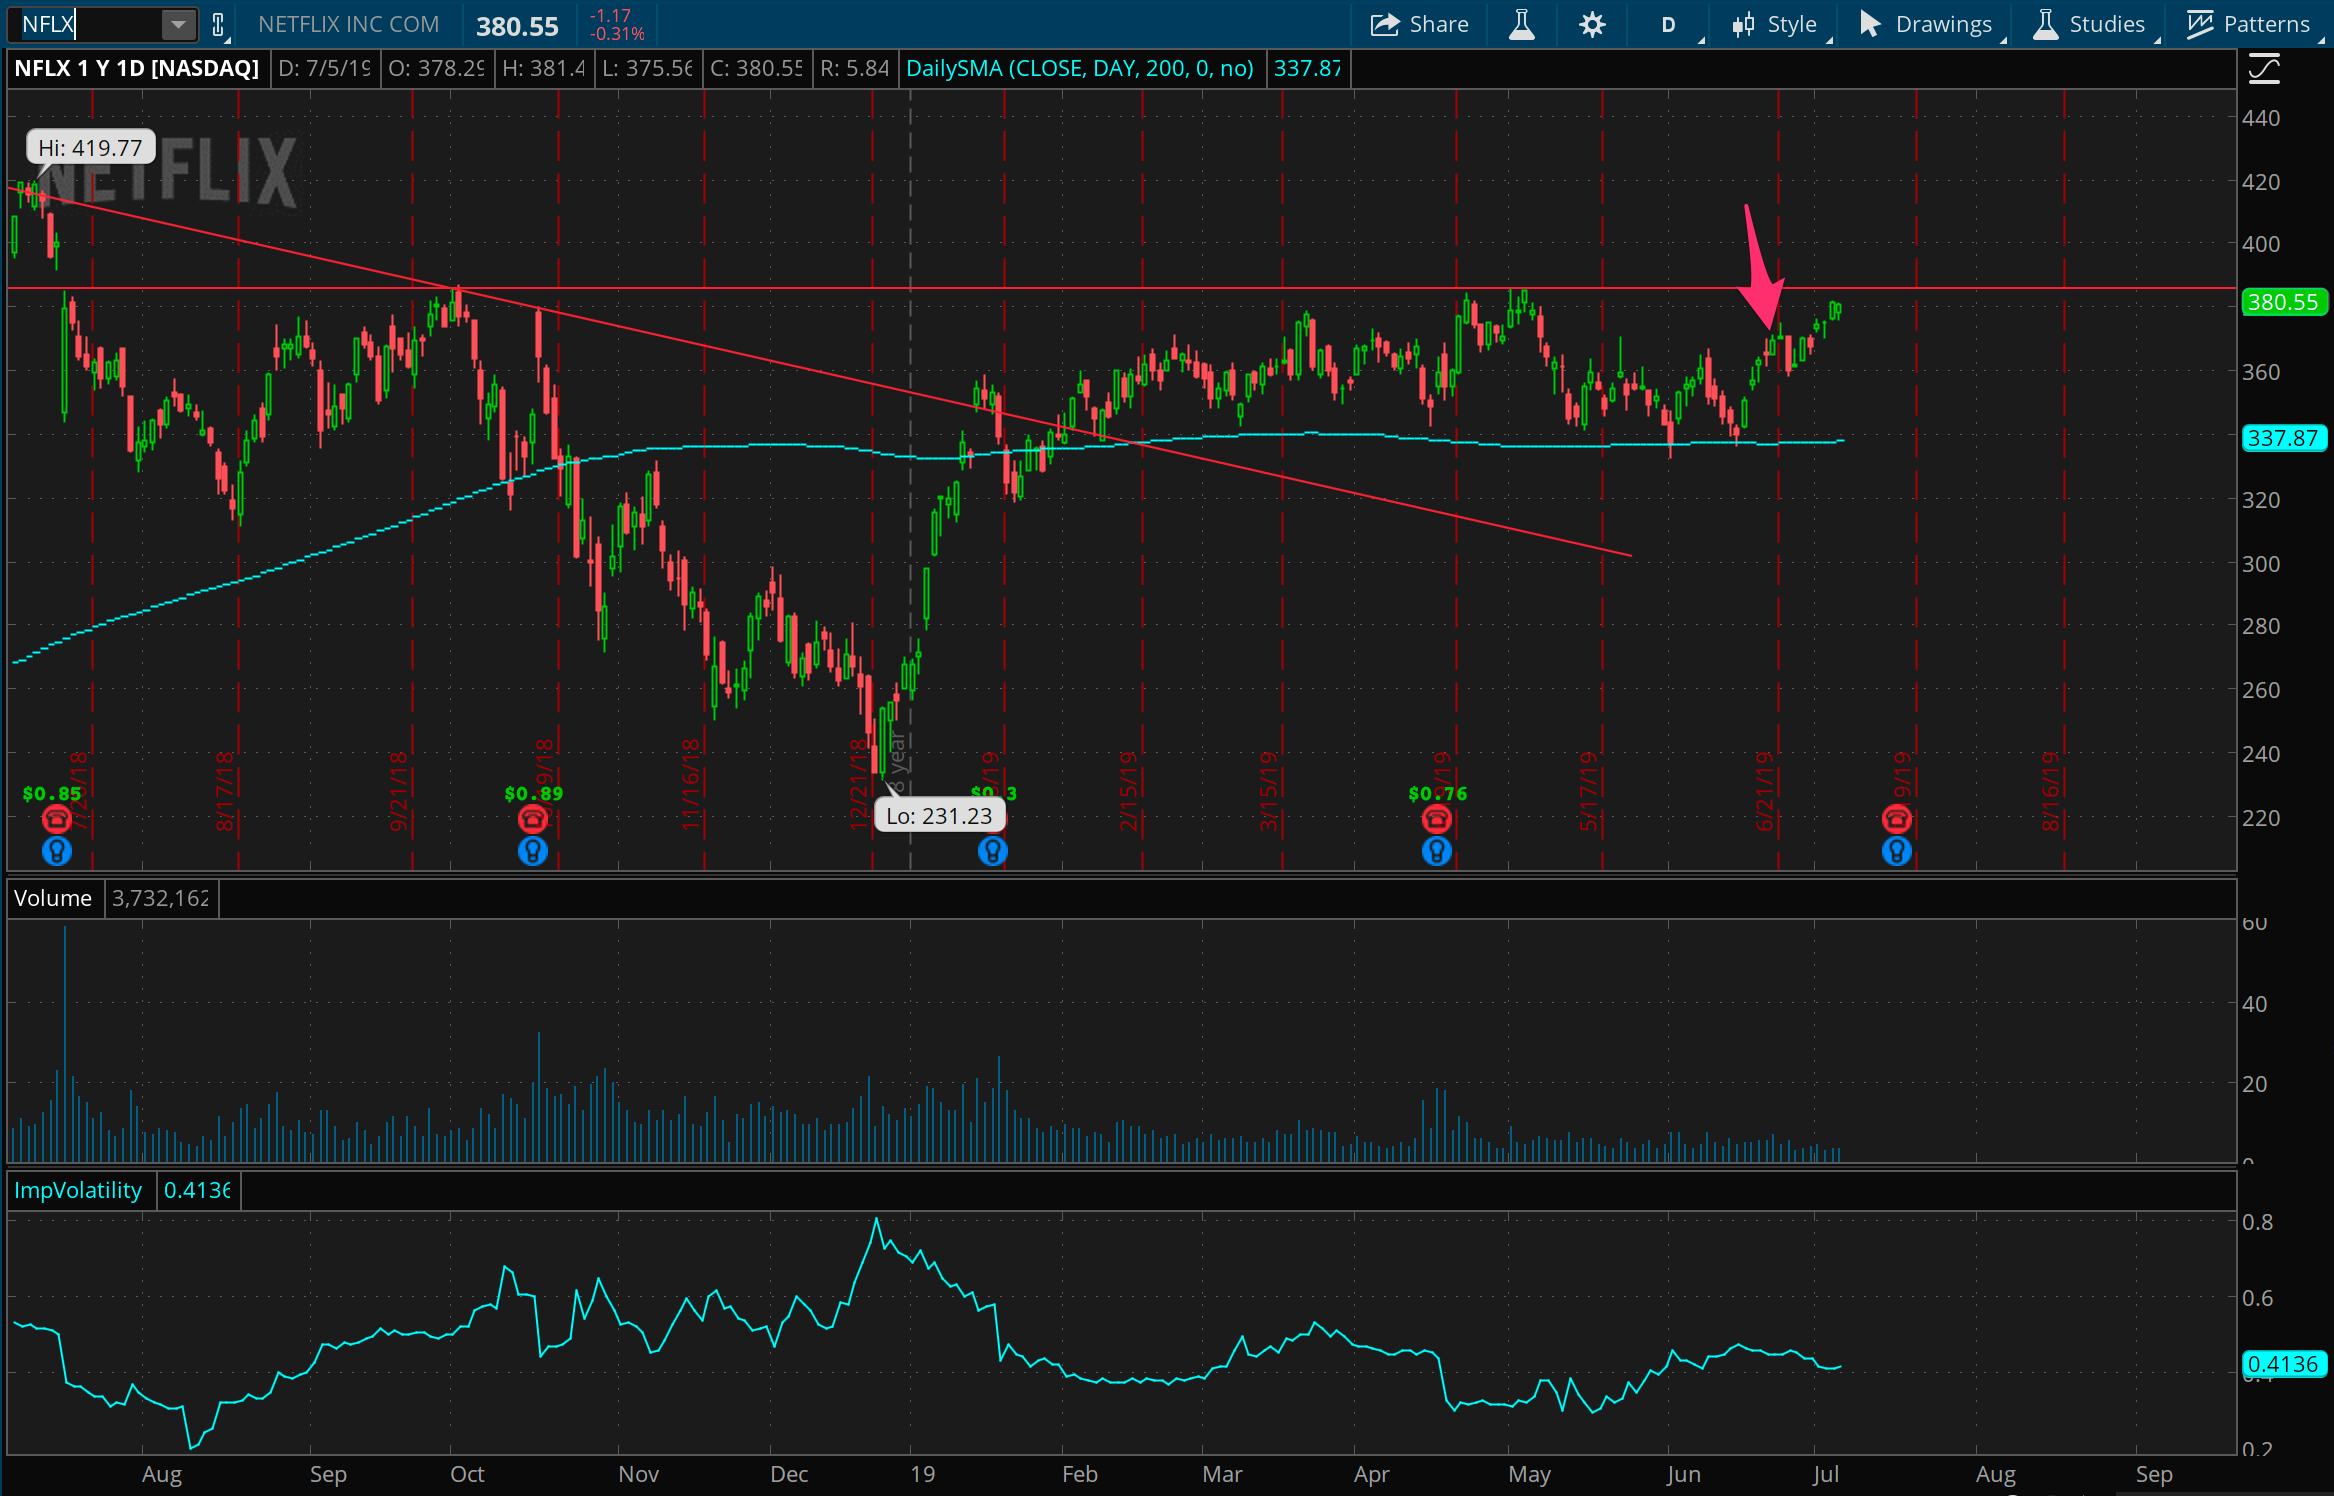
Another short trade from two weeks ago that’s looking a bit long in the tooth, though staying roughly in tact versus the others. Netflix has reached right up to the top of this range it’s been in for months, between 380 and 340. My 380 call spread was indeed a bit early, though this area represents a great place to put another on, which I may look to do in the coming week. Netflix does have earnings coming up which could be the event to push it out of this range, but it’s quite possible we see it move down towards the bottom of it before earnings.
And a builder breakout?
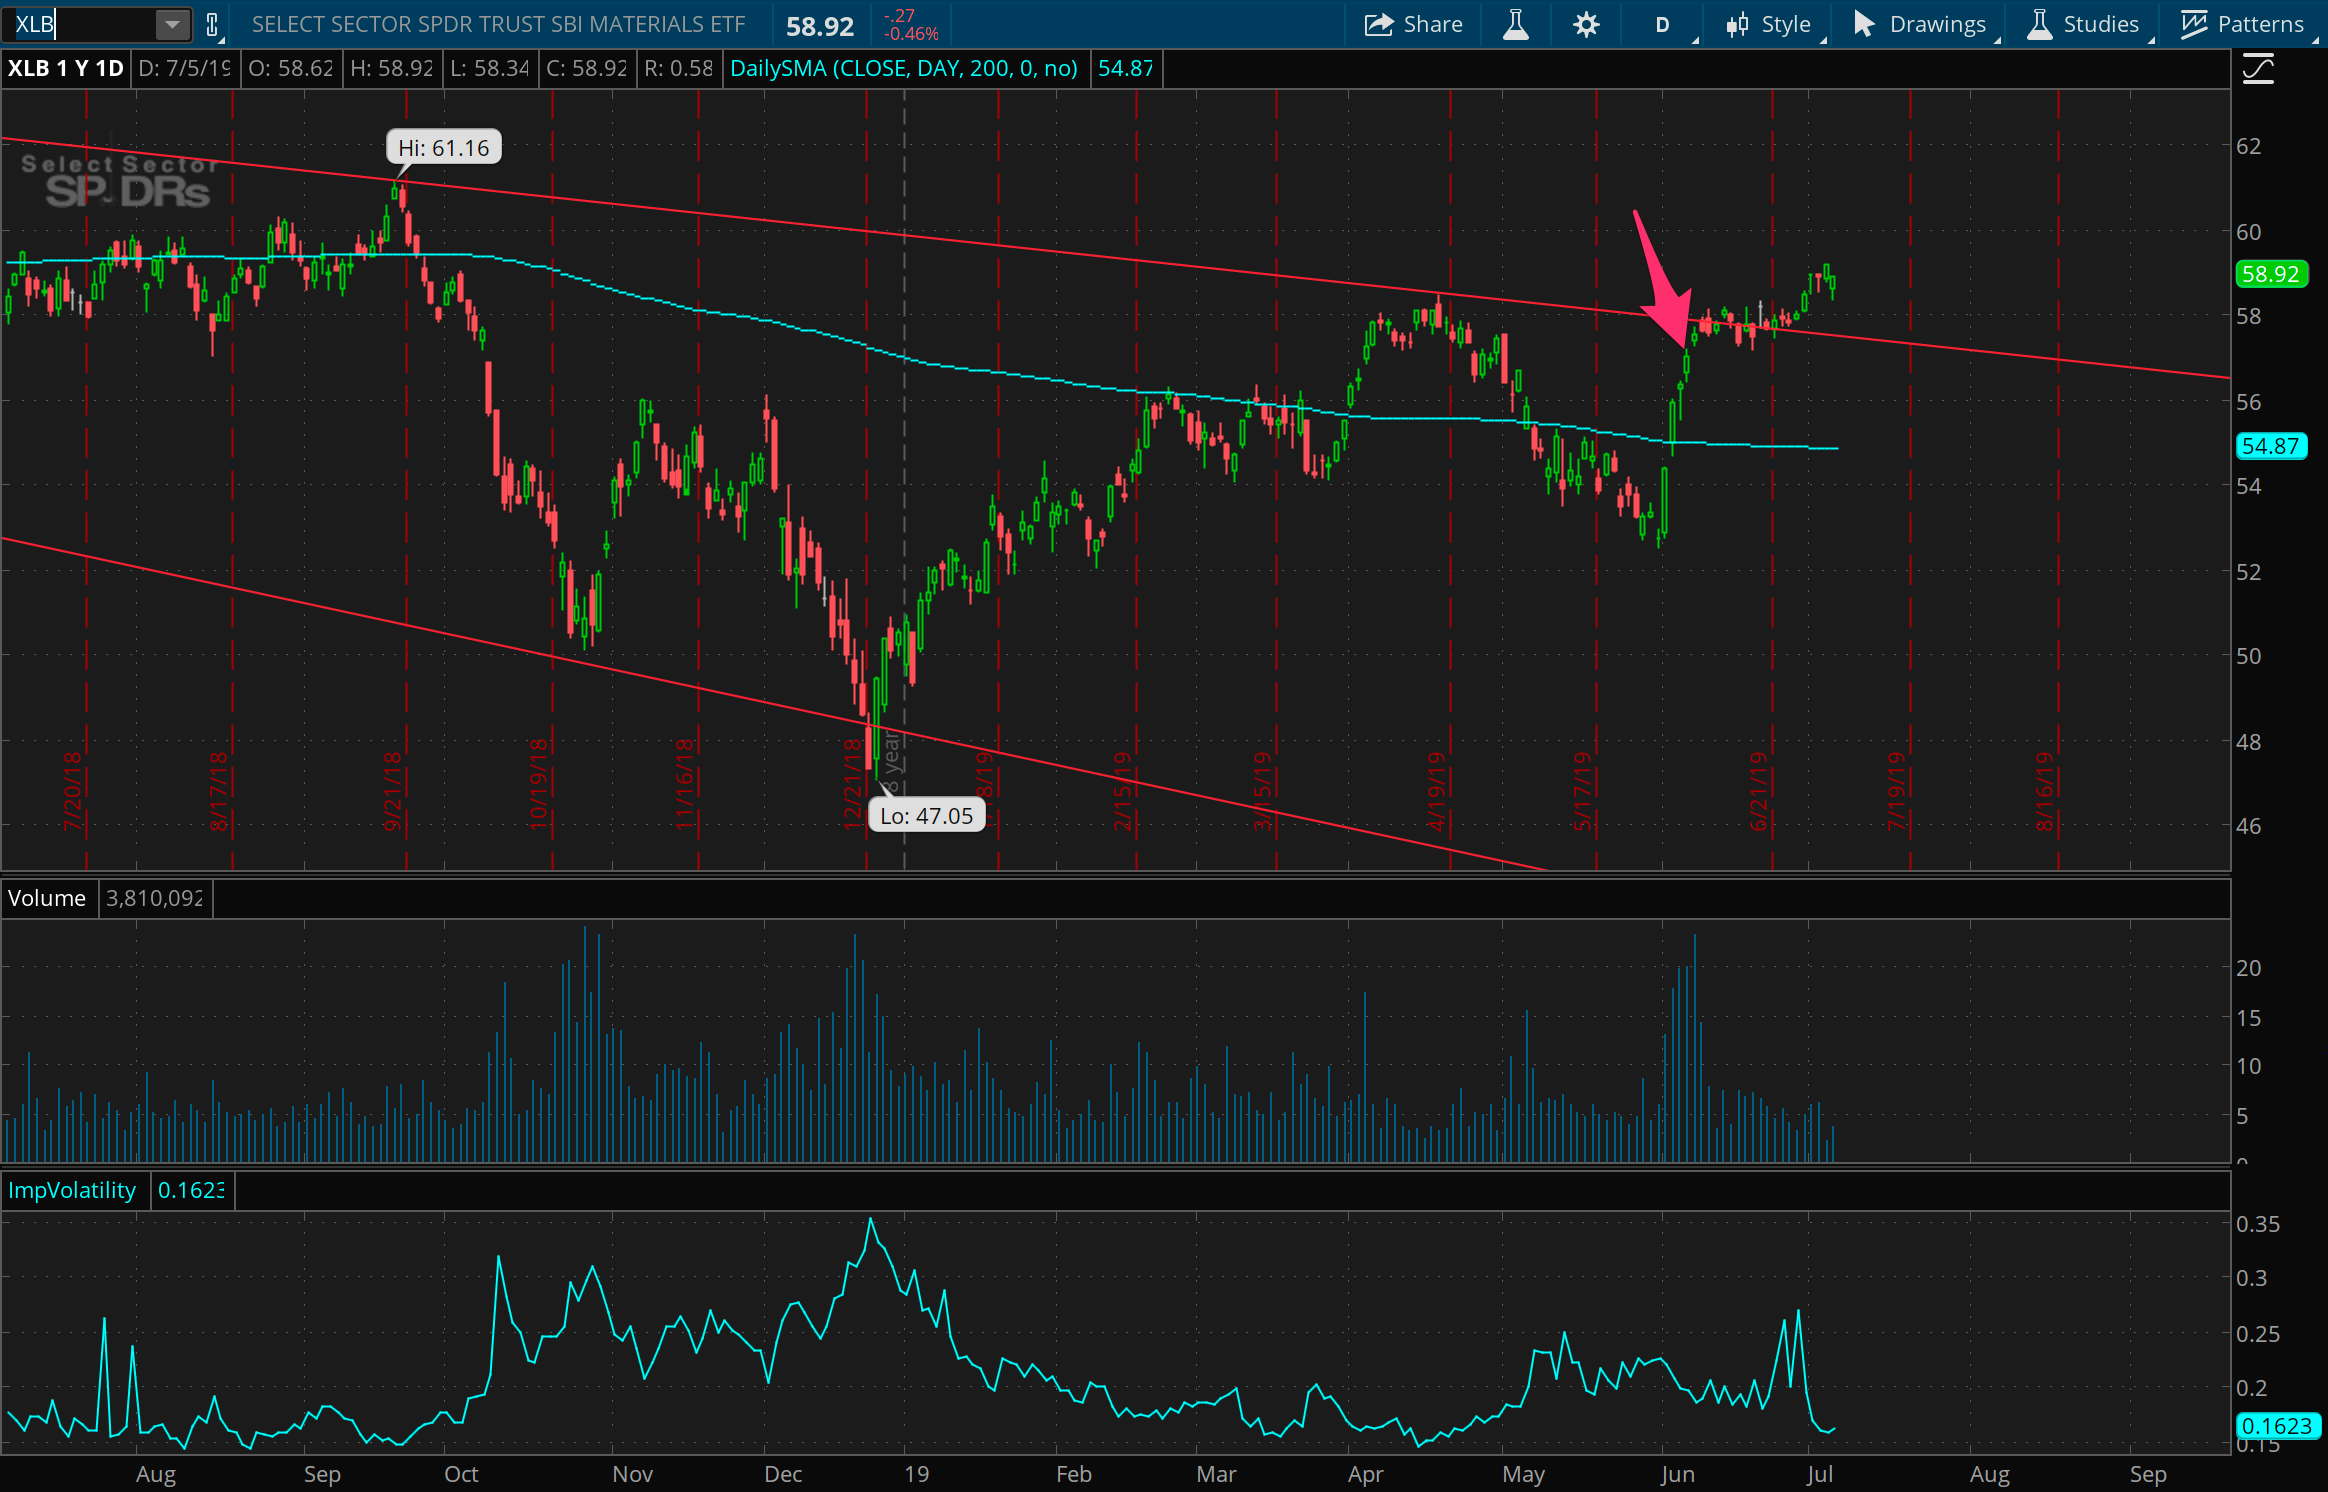
One of the most difficult things in trading is knowing when to consider a trade failed. It’s important to set that parameter when you enter the trade. For me, the trade I put on in XLB now four weeks ago will be considered a fail at 60. This break above the overhead resistance might be suggesting some new strength for this sector. But, for now, it still looks over-stretched, and could find itself back into the 54 - 56 area in a hurry if the overall market shows some weakness.
Et tu, XLF?
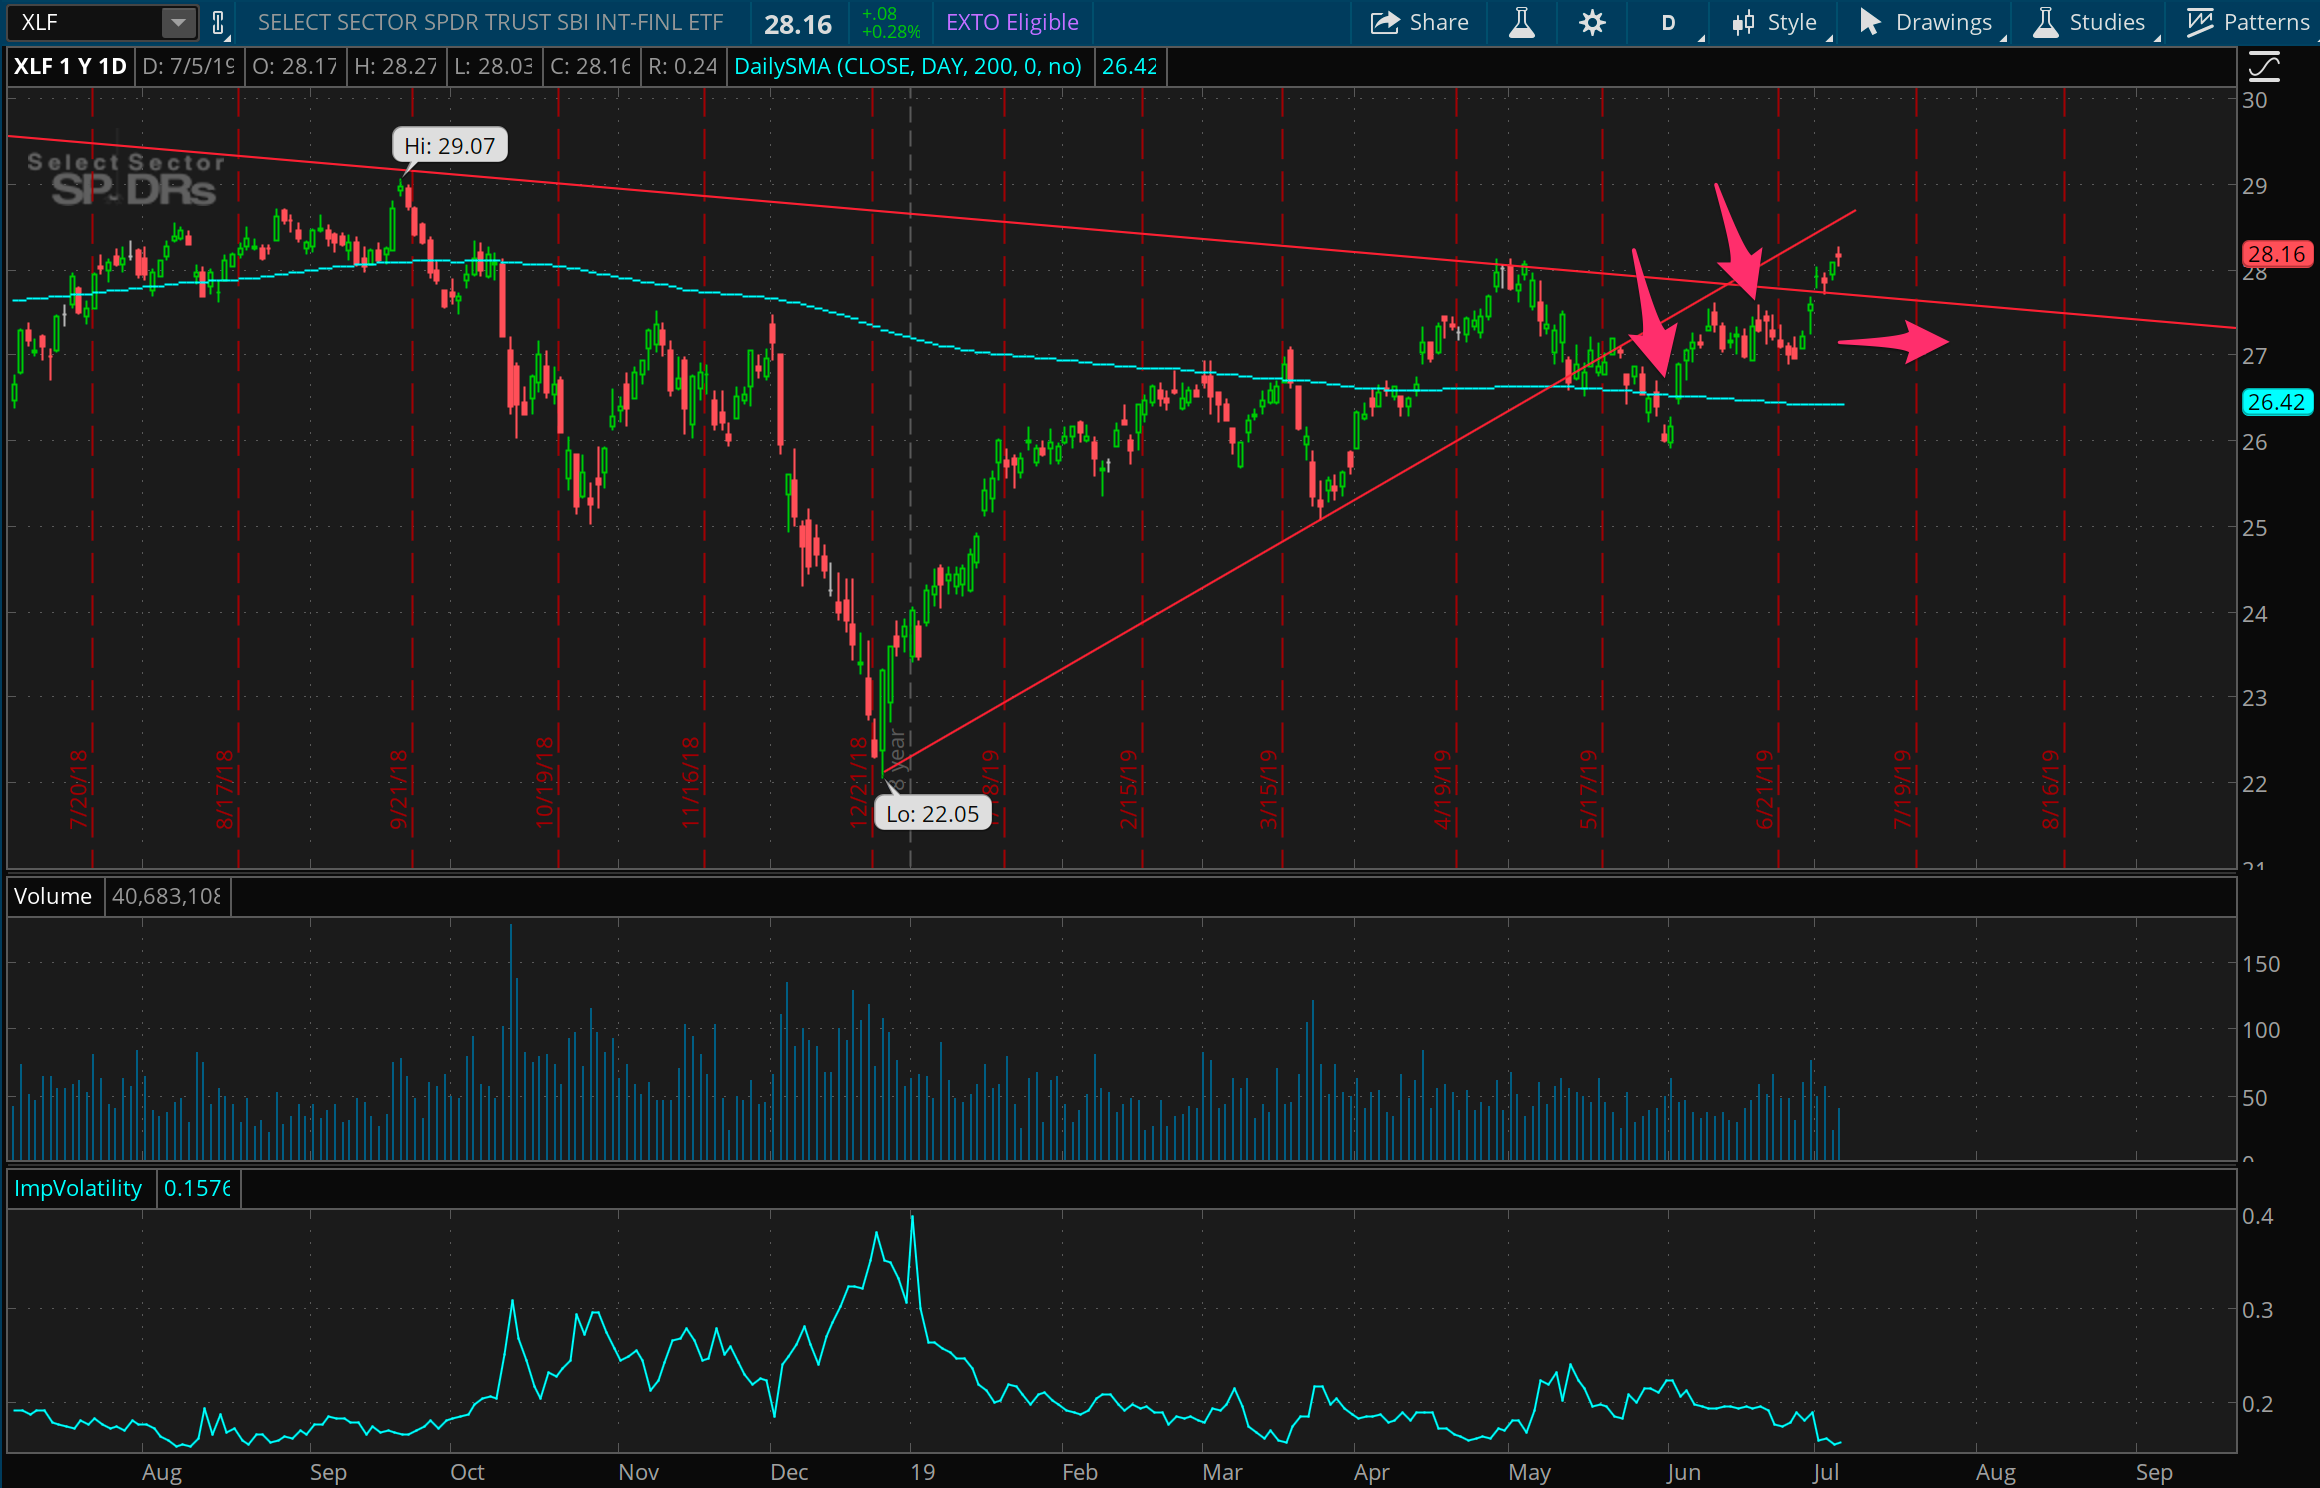
And finally, to end with another strong example of this week’s theme, here’s one more short trade that’s waiting to work out against the market strength. We ended last week with this trade more fully in tact, as prices stayed below the downward trend line that formed this trade’s thesis. However, like XLB, prices are moving above this area and breaking down the rationale. But prices here are quite overstretch away from their moving average, and past price action suggests a fairly bumpy road ahead that could send prices back towards that average around 26 - 27.