The nearly nothing week
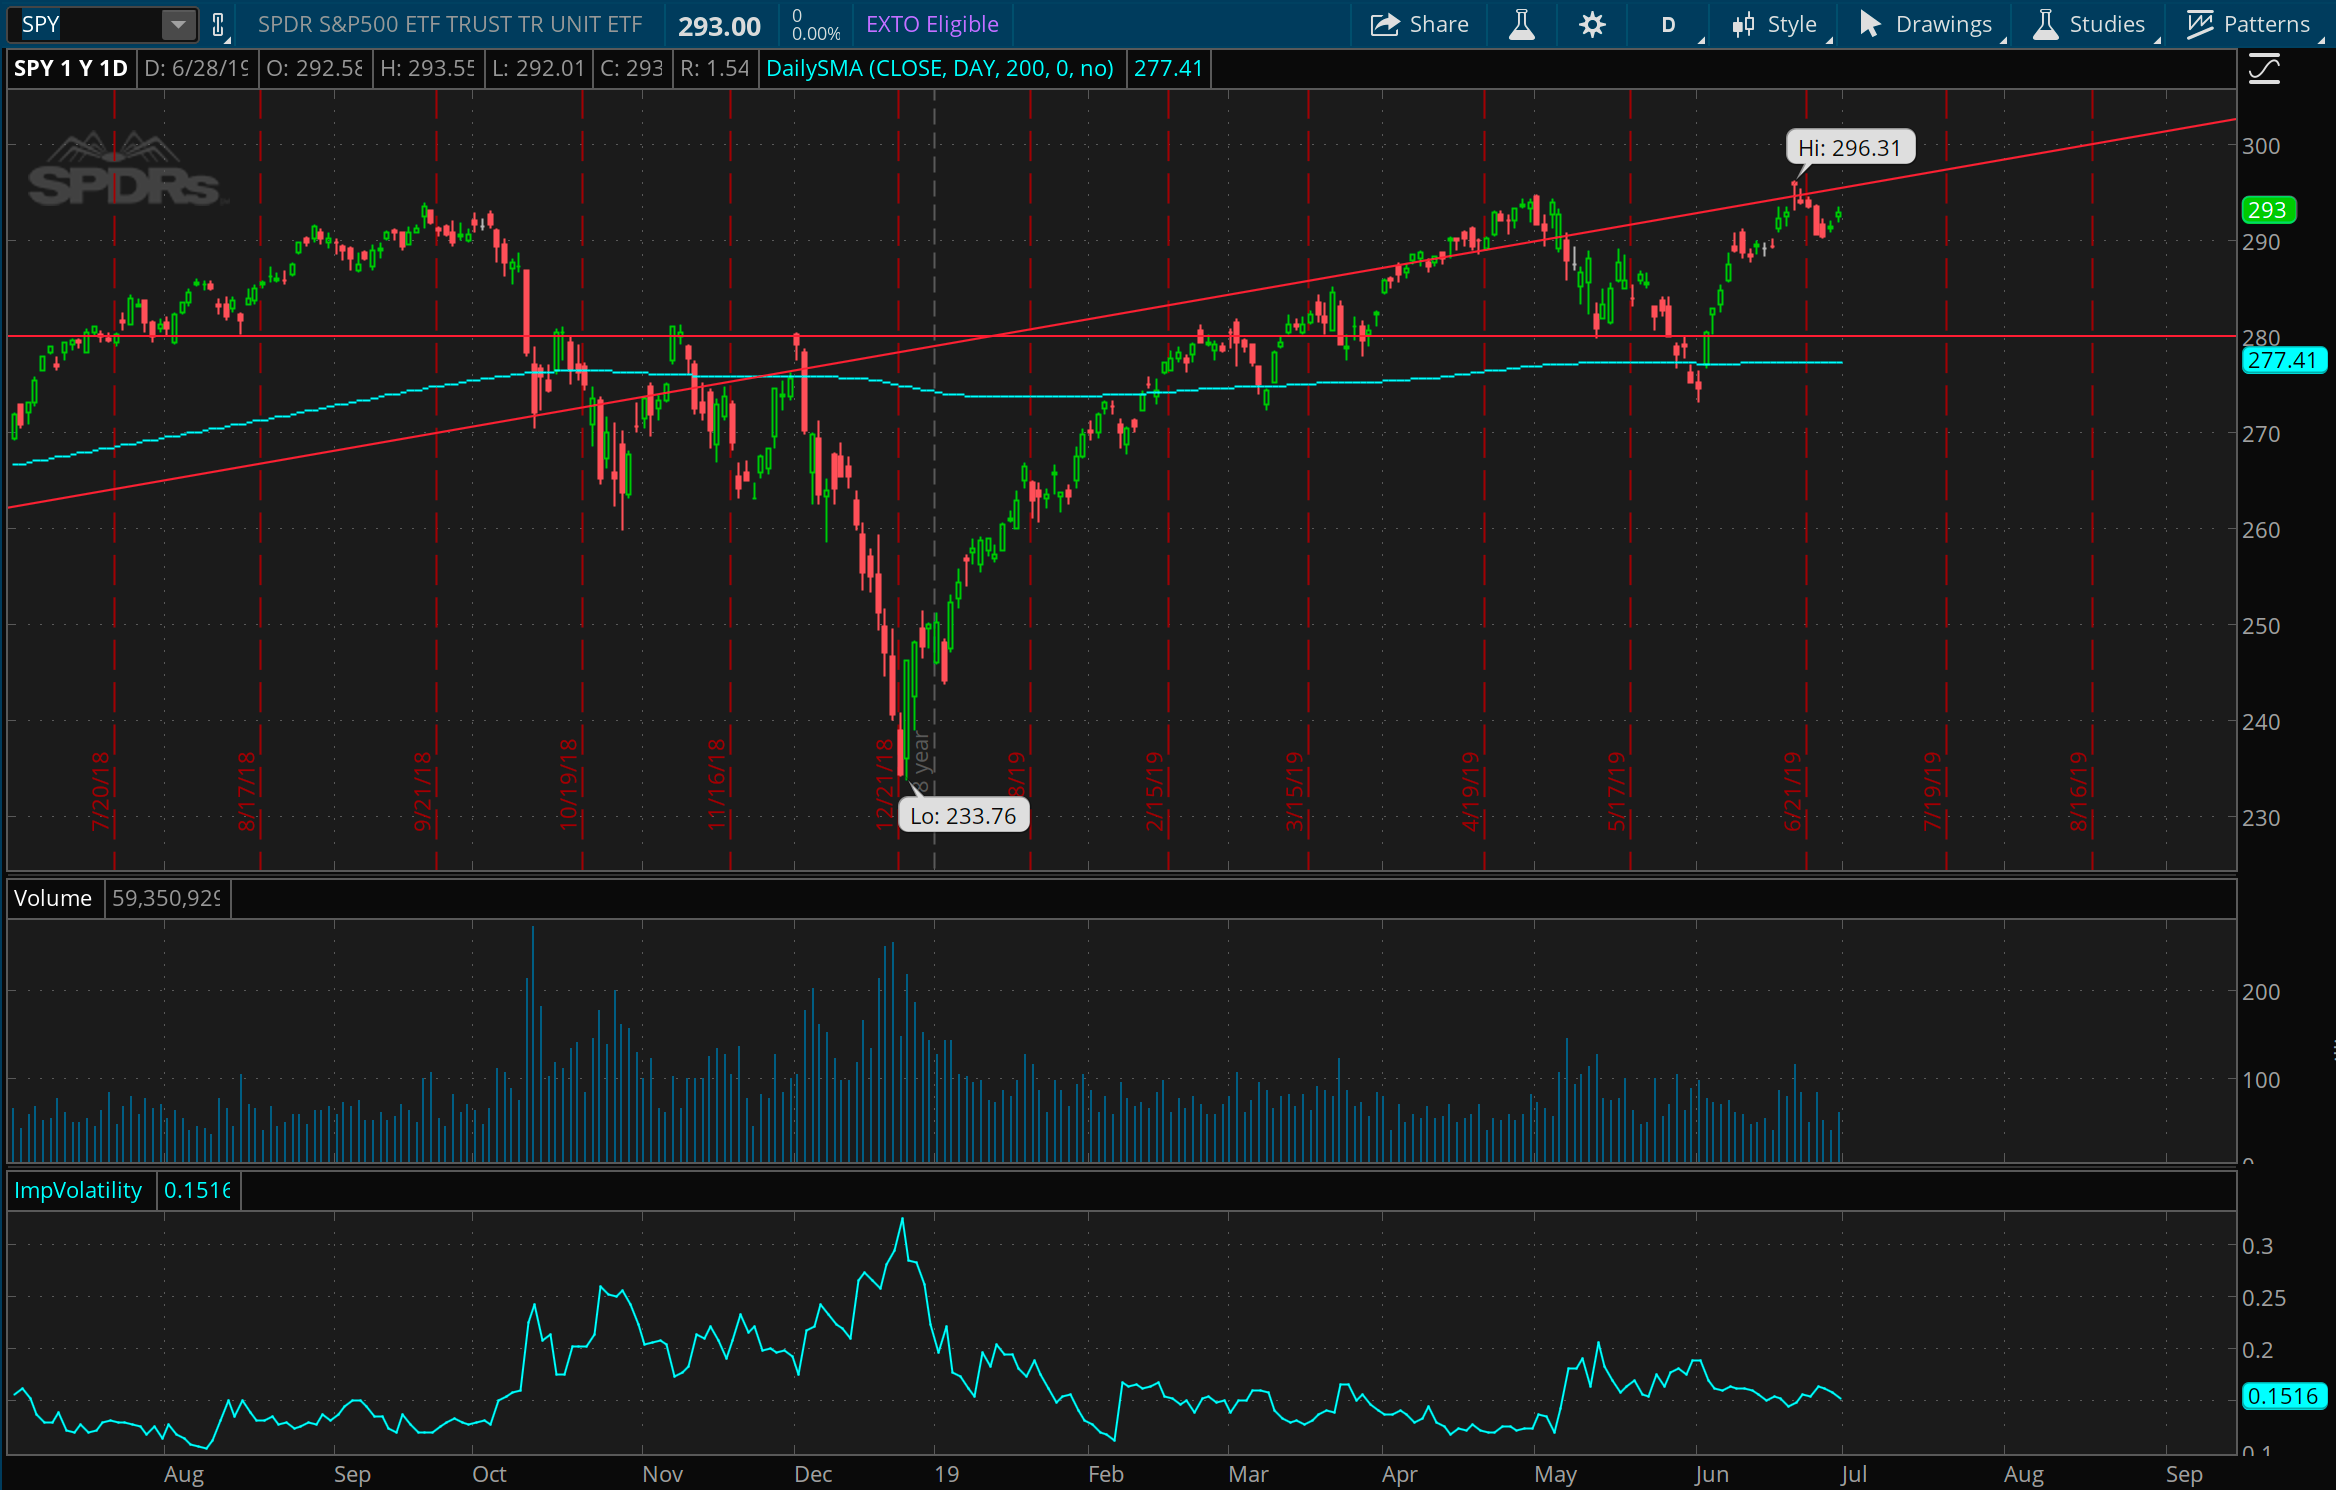
Another climb, another lull. The lift from last week led us this week into another grind sideways, though it started off with a compelling downside move early in the week. It does feel like the market is staying within its bounds and not overstretching itself. But generally, it feels much more likely to see downside over the next few weeks.
A quick AAPL grapple
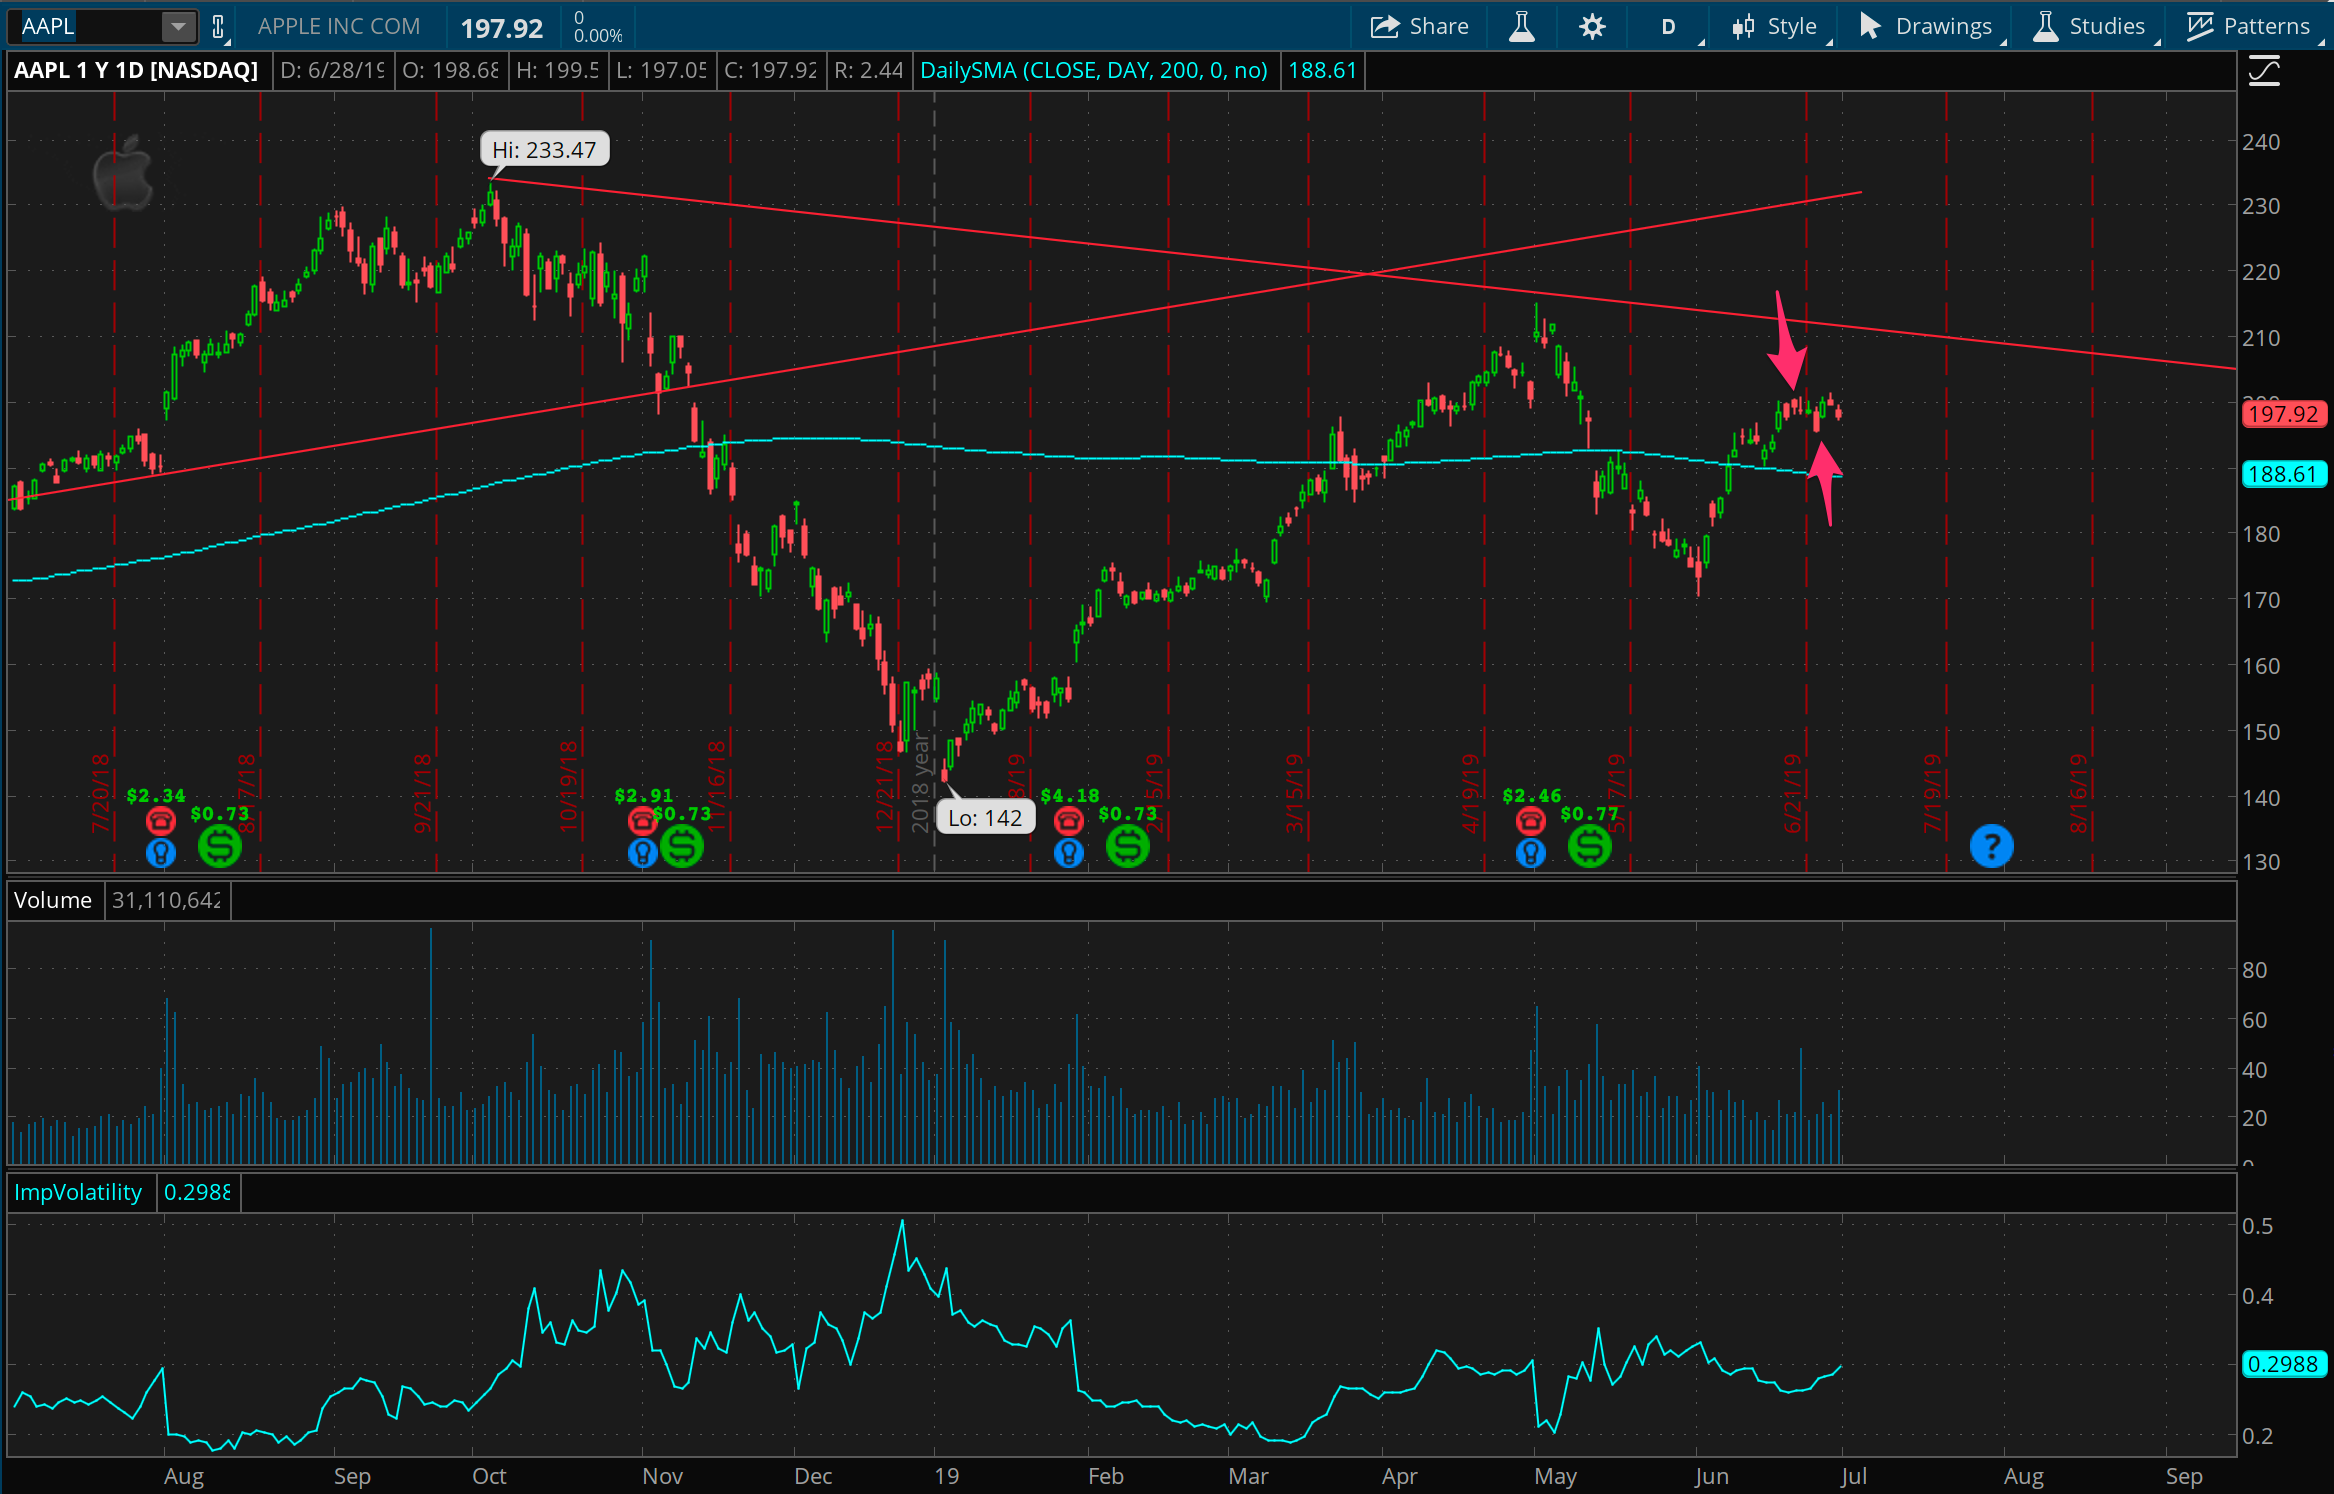
After a quick trade in AAPL back in May, I went back to the well at the end of last week, with another short trade using a call spread at 210, and got a clean win out of it within a couple days, as noted in the red arrows. I think there’s more of this trade left, and I’ll be revisiting further as we flirt with this 200 / 210 level.
Netflix and trade
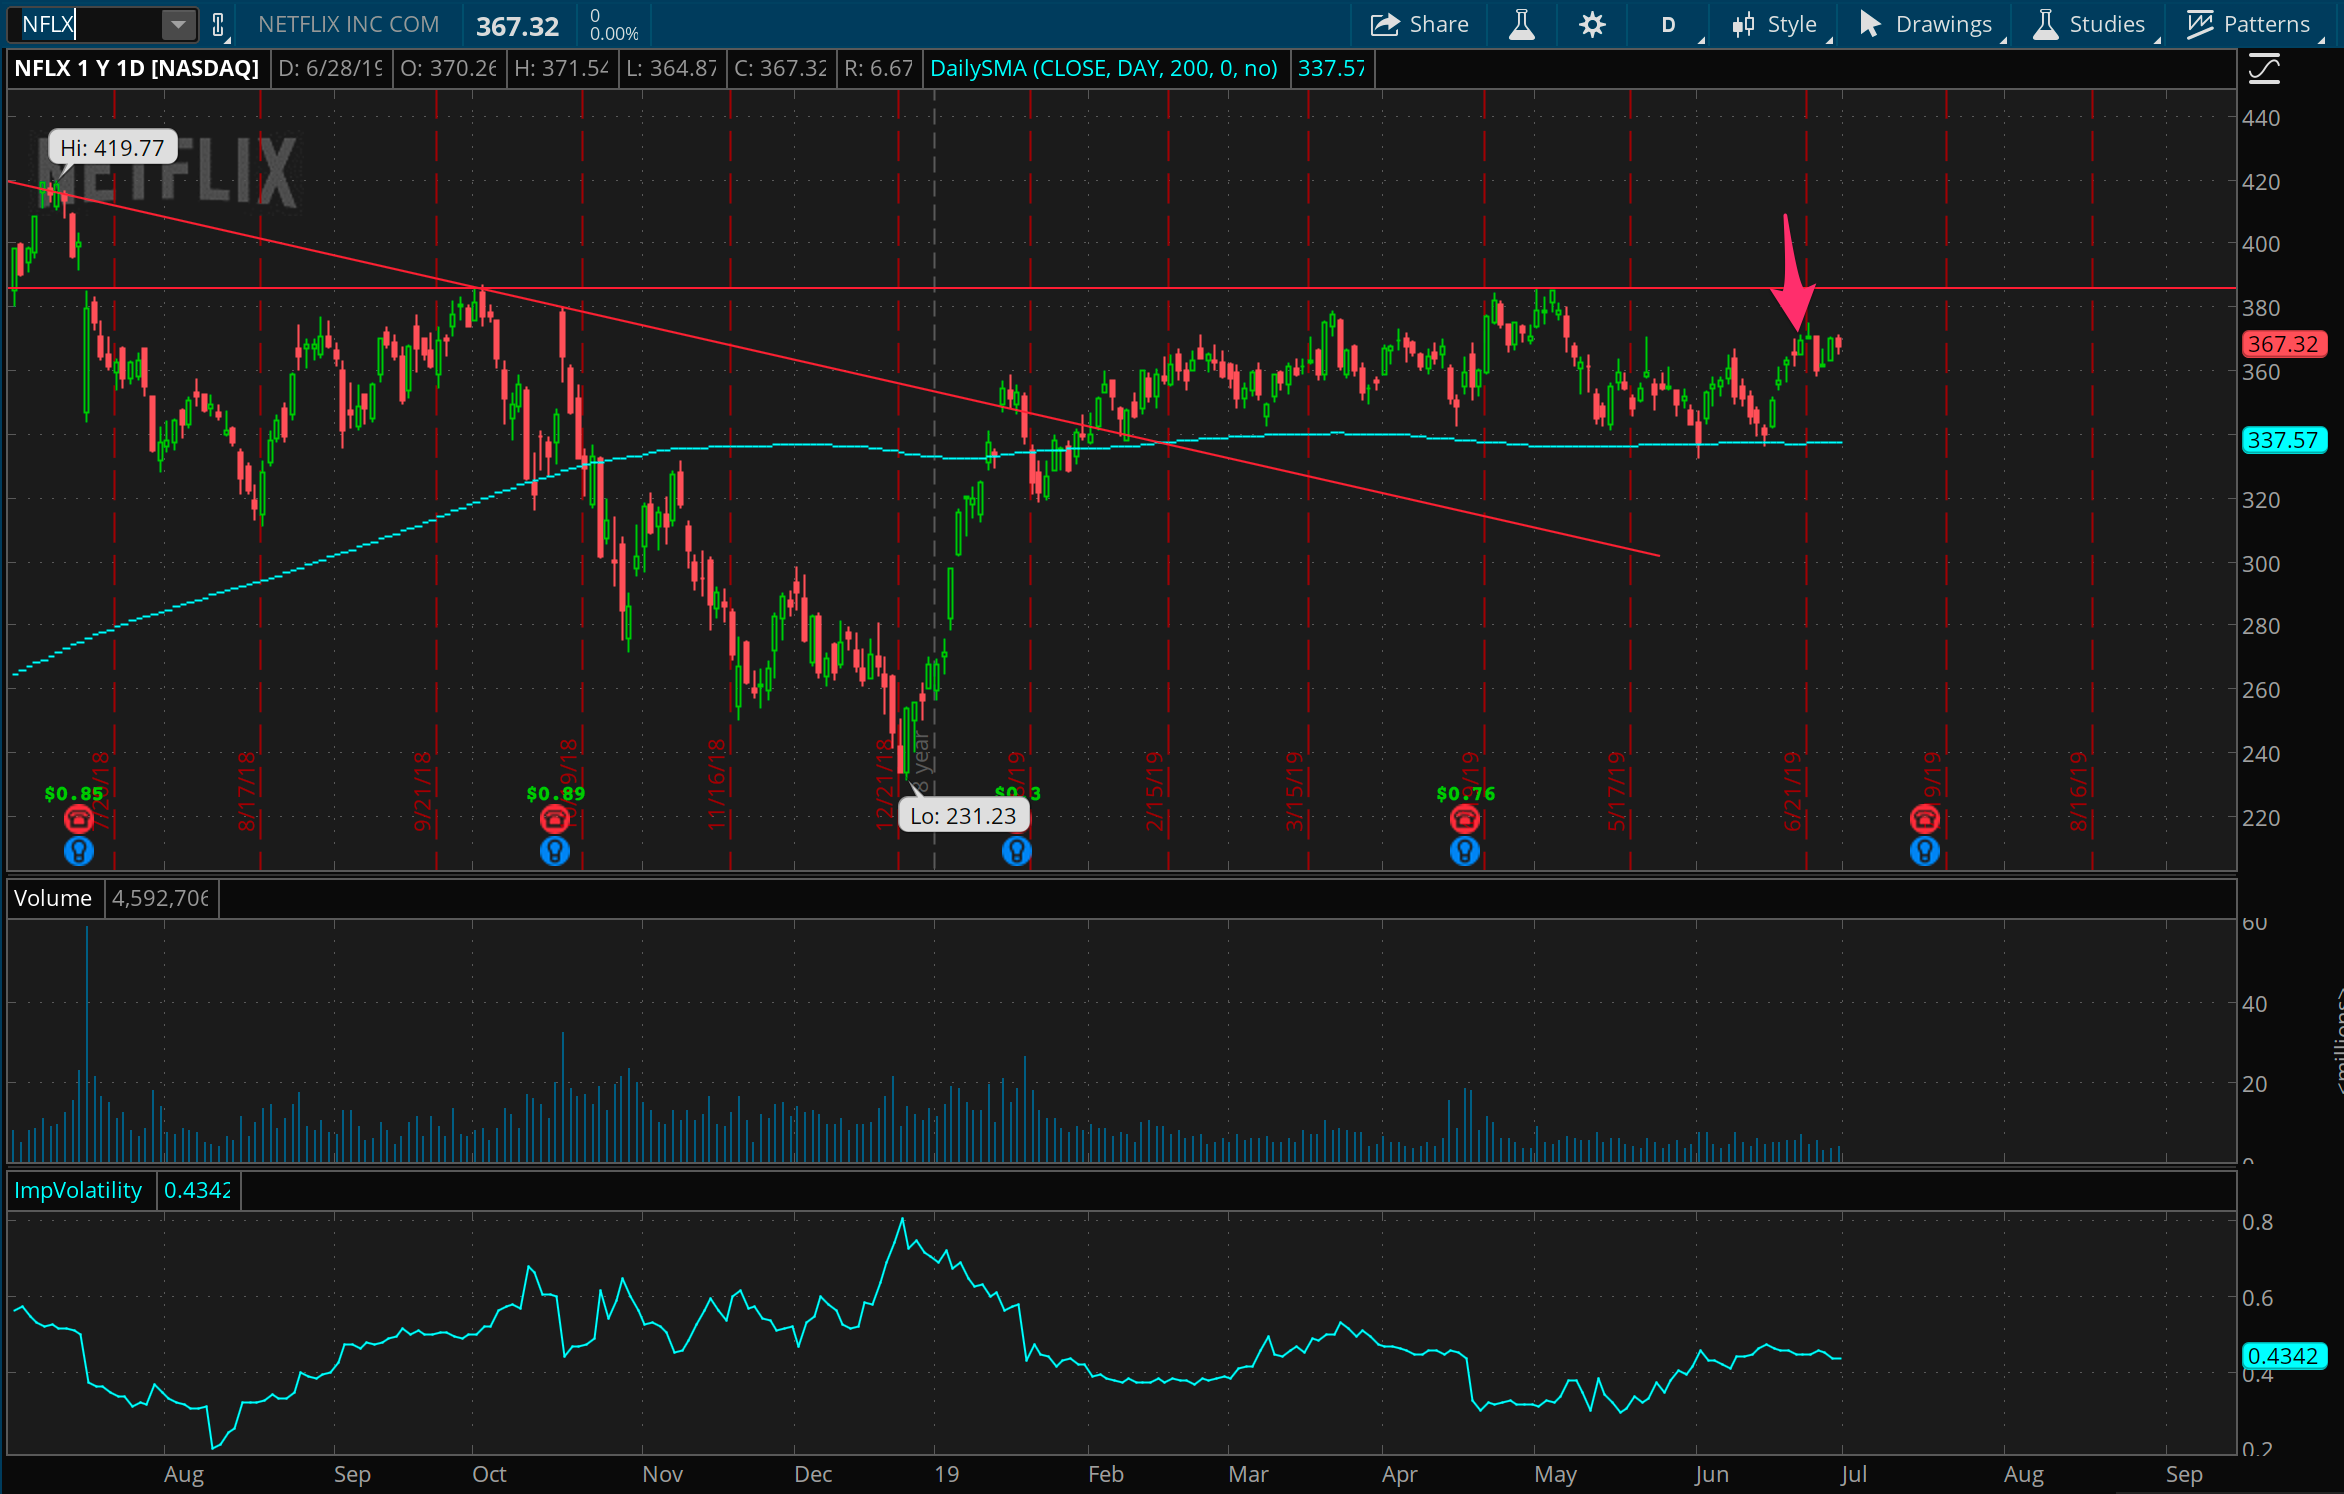
Not too much to say on the NFLX short trade I put on at the end of last week. Prices in NFLX ended just where they had started this week, so generally there’s not much going on with this trade and I’ll continue waiting for a move down within this range that it’s held for weeks and weeks.
The builder bane
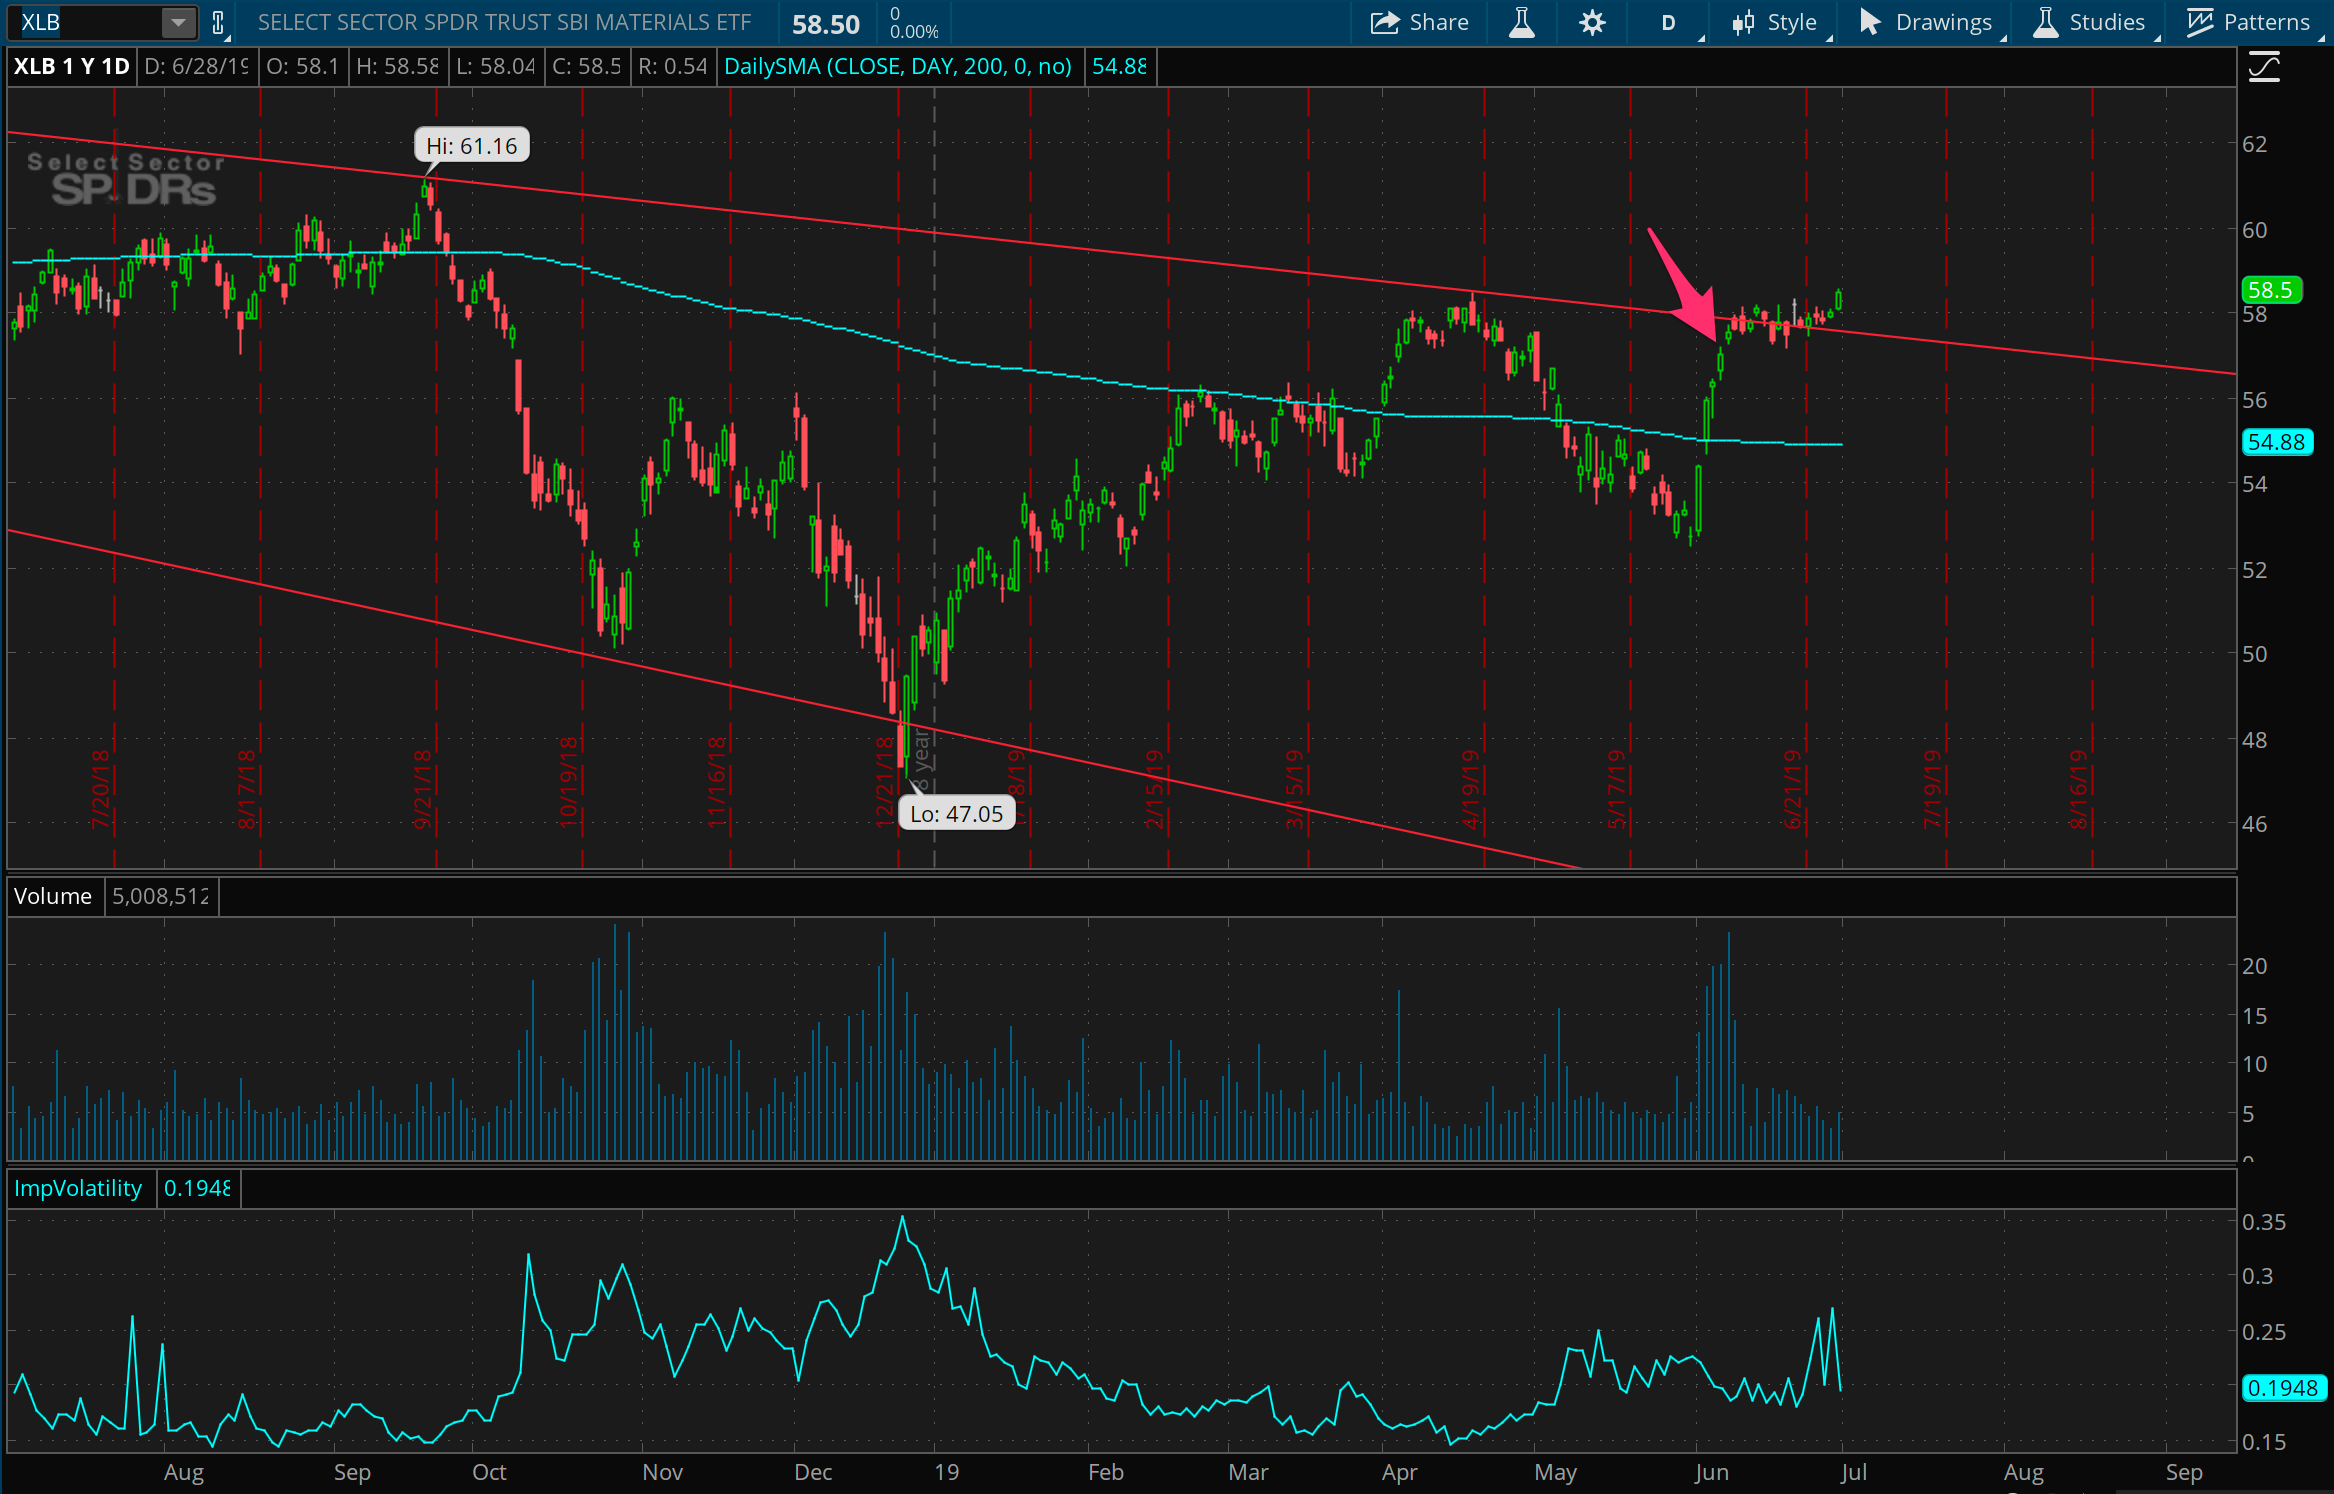
The SPDR builders sector ETF, XLB, seems to have broken out of a downward trend line that I spotted as resistance a couple weeks ago, and I’m beginning to think the thesis of this short trade is disappearing now. But, that said, it feels stretched a bit far upward in a downward trend, and the trade is risk capped around 60, so I think it’s worth continuing with for a while longer.
And then the financials
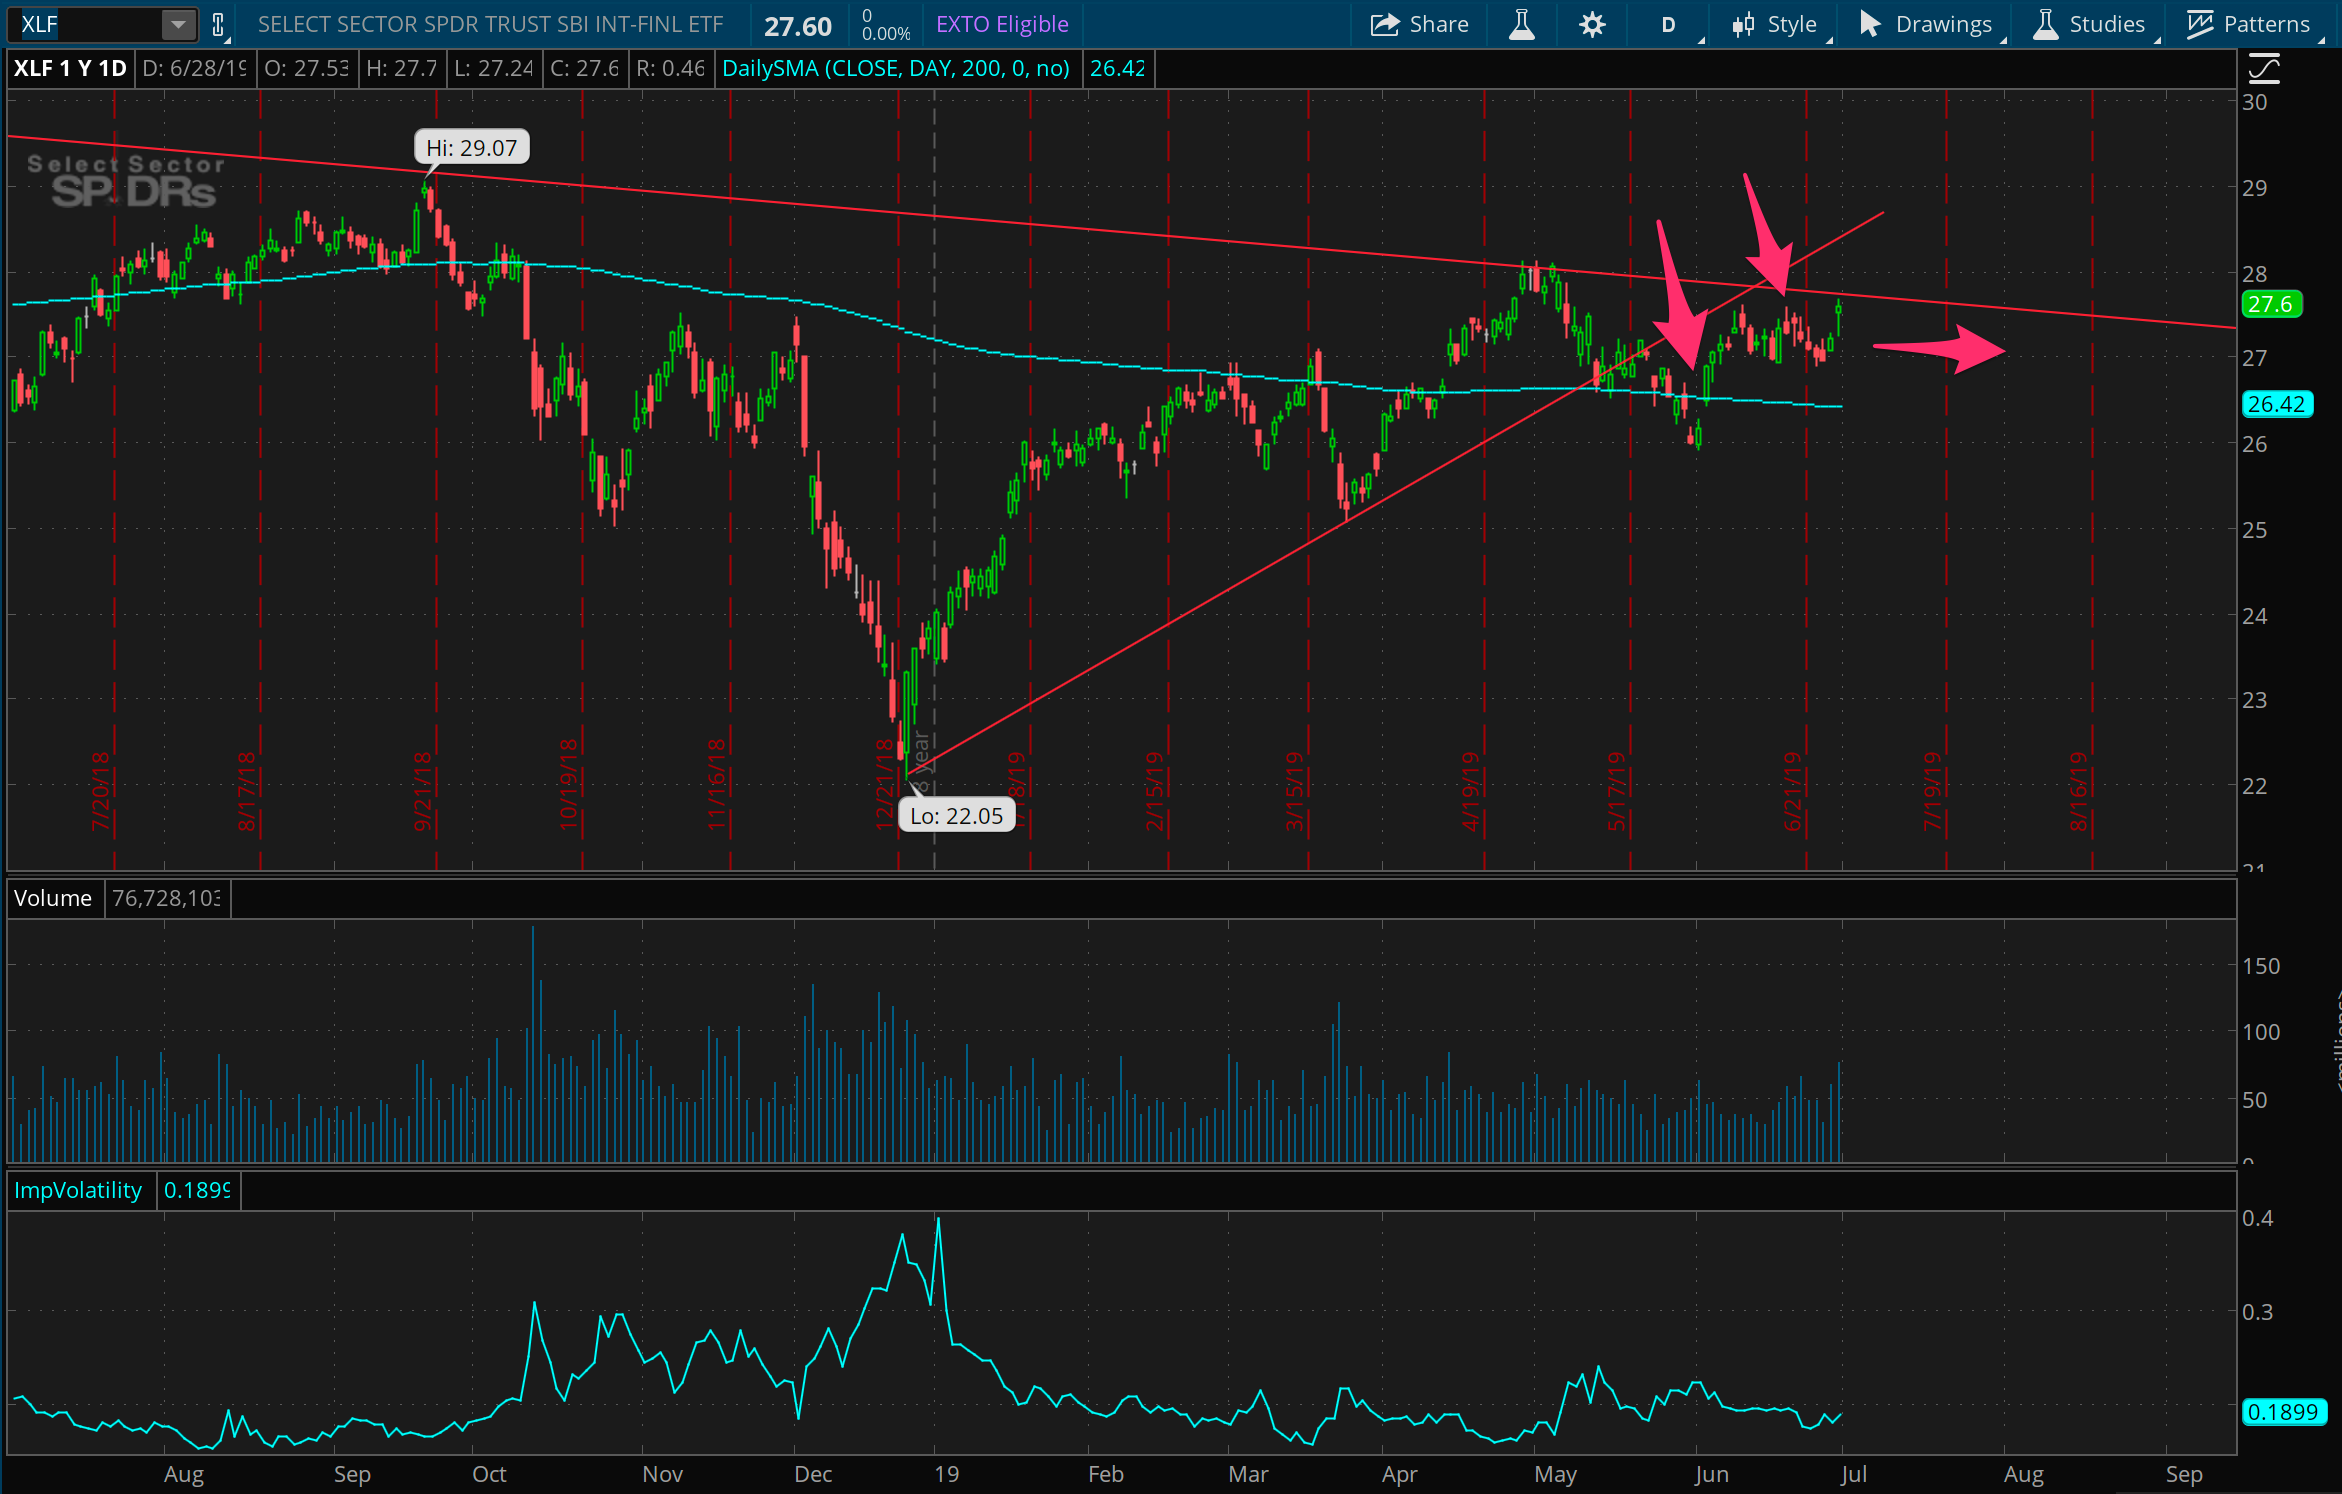
A similar trade I put on around the same time is this short in the SPDR financials sector ETF. This one is looking cleaner than XLB above, staying put under its own downward trend line, but had a strong finish to the week. A lot of continued market strength could cause all these positions to take longer than hoped, but they haven’t broken down completely yet, and I’ve rolled this trade out to August expiration to give it more time.
Oil prices gonna be oil prices
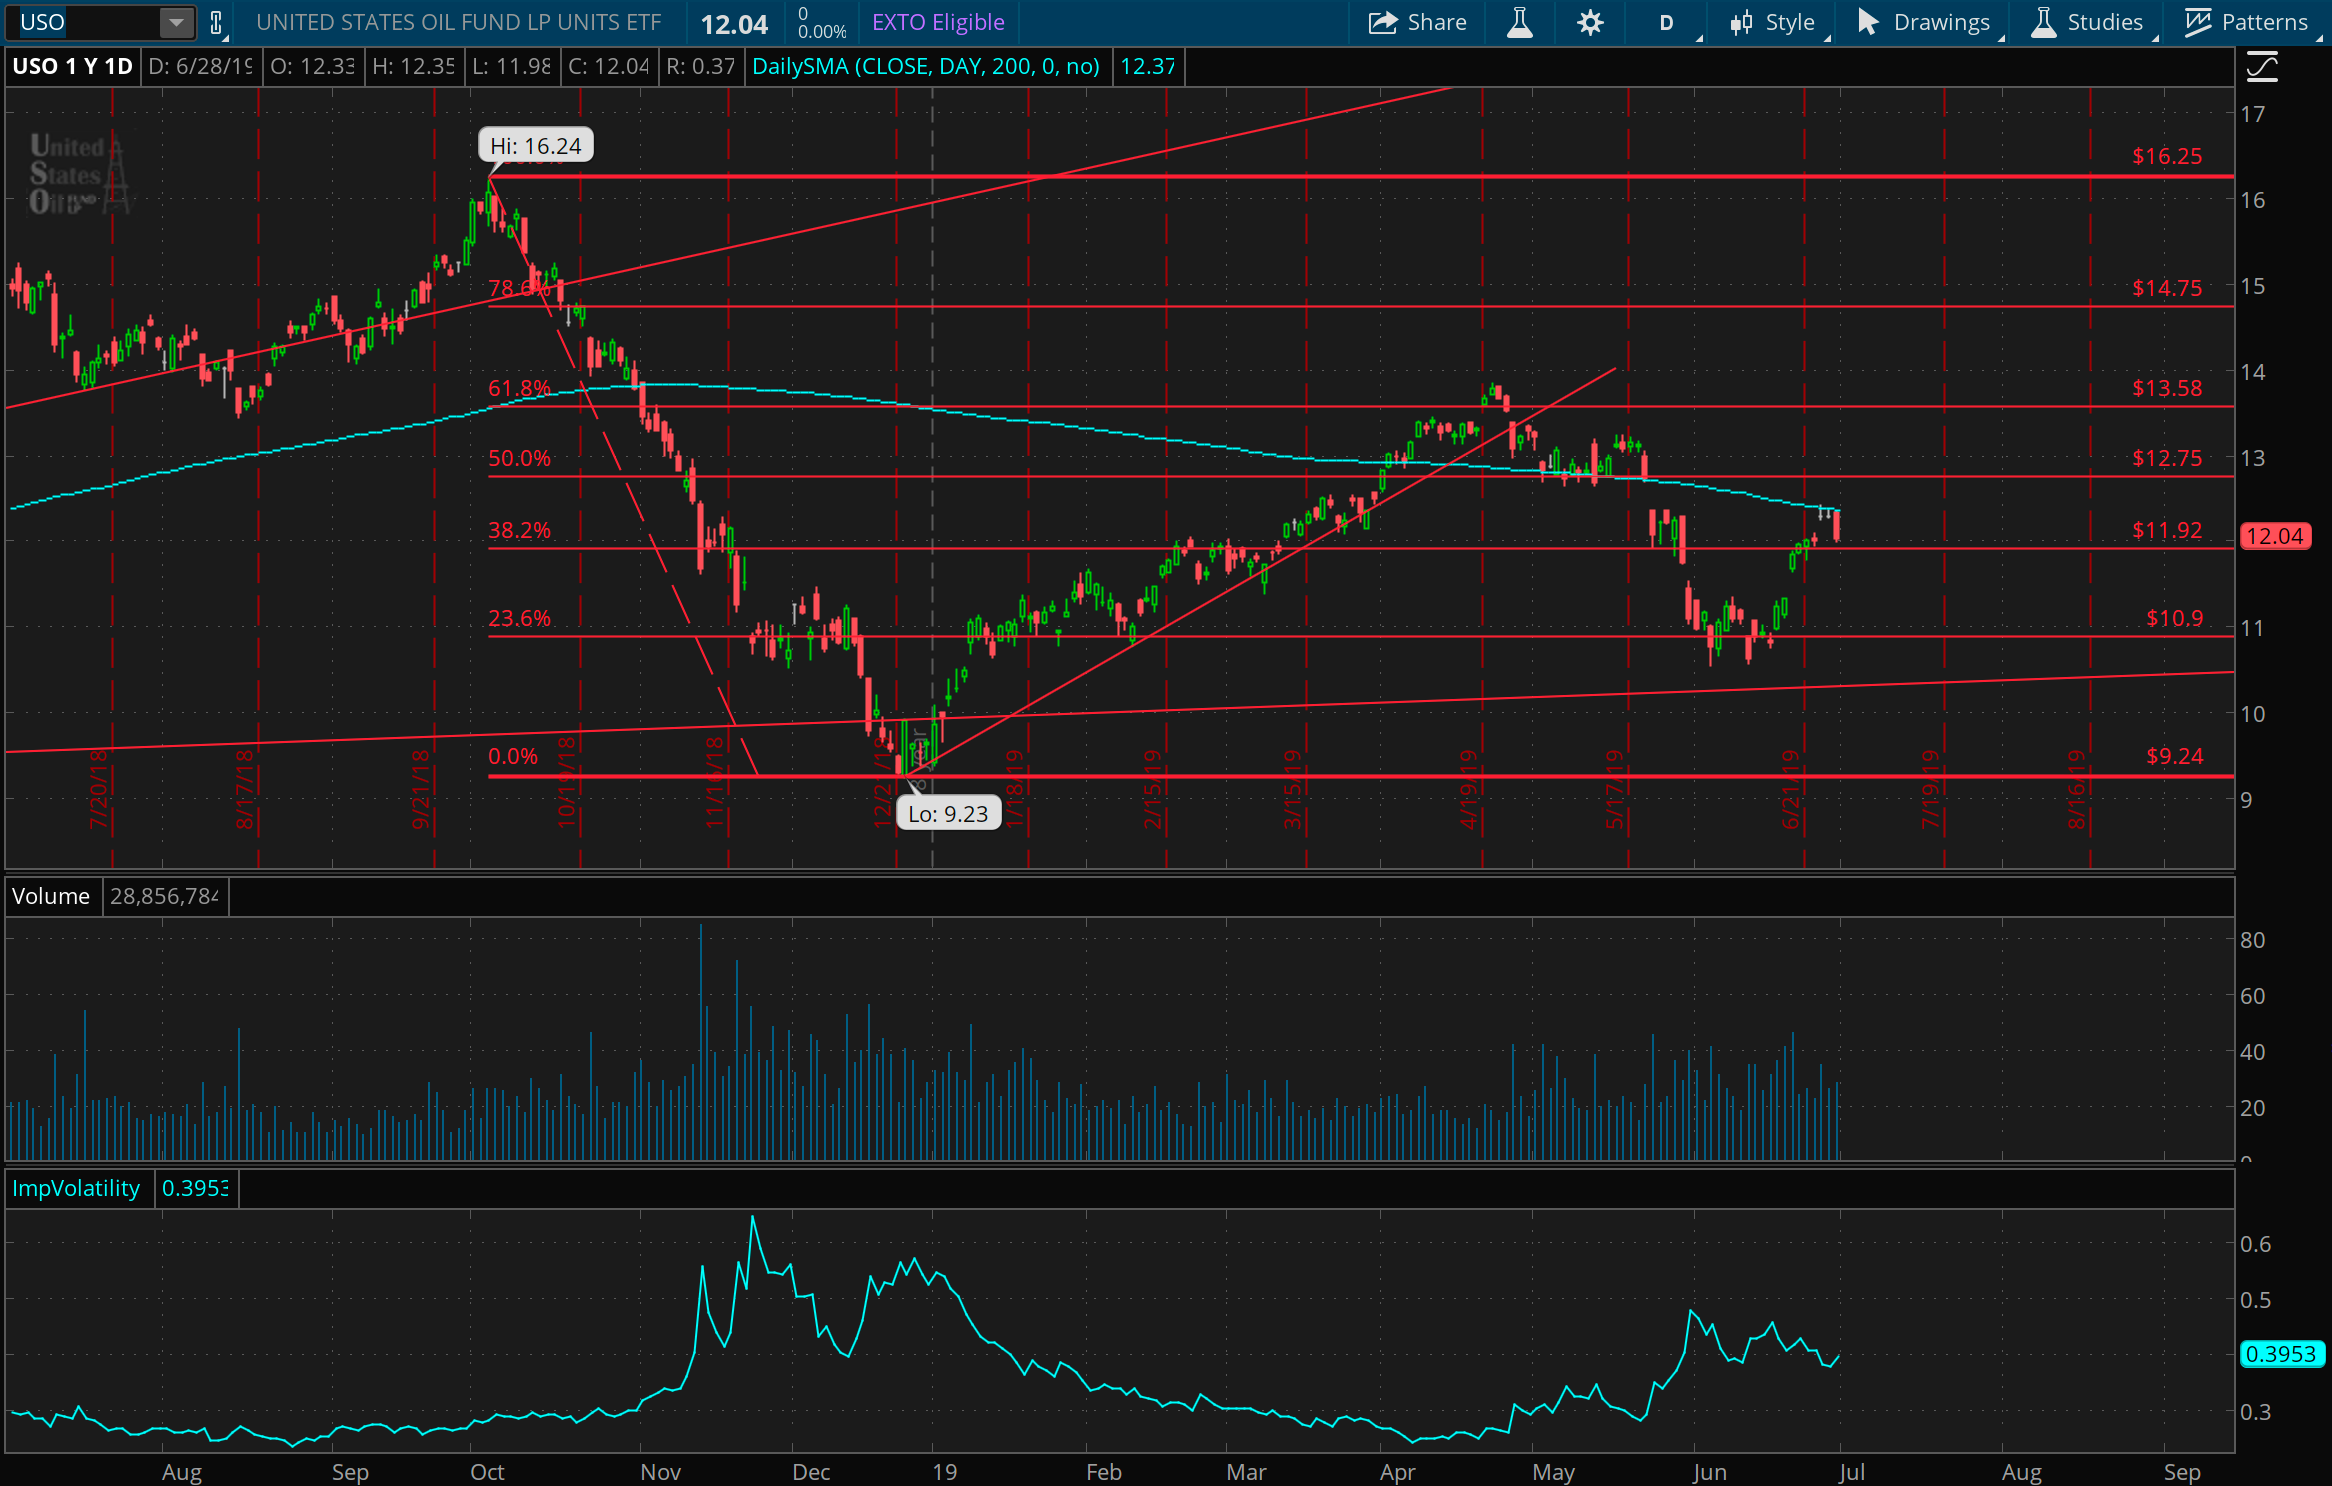
After finishing out the unwind I highlighted last week, I’ve been staying out of oil. On the week, oil prices stayed basically unchanged, but did so in a very dramatic way, rising up to the 200 day moving average with a big gap up on Wednesday, only to fall and give back all the gains at the end of the week. Based on this, I’d expect USO to continue with some volatile movements but likely staying within the 11 - 13 range for the foreseeable future.
CAT short setup
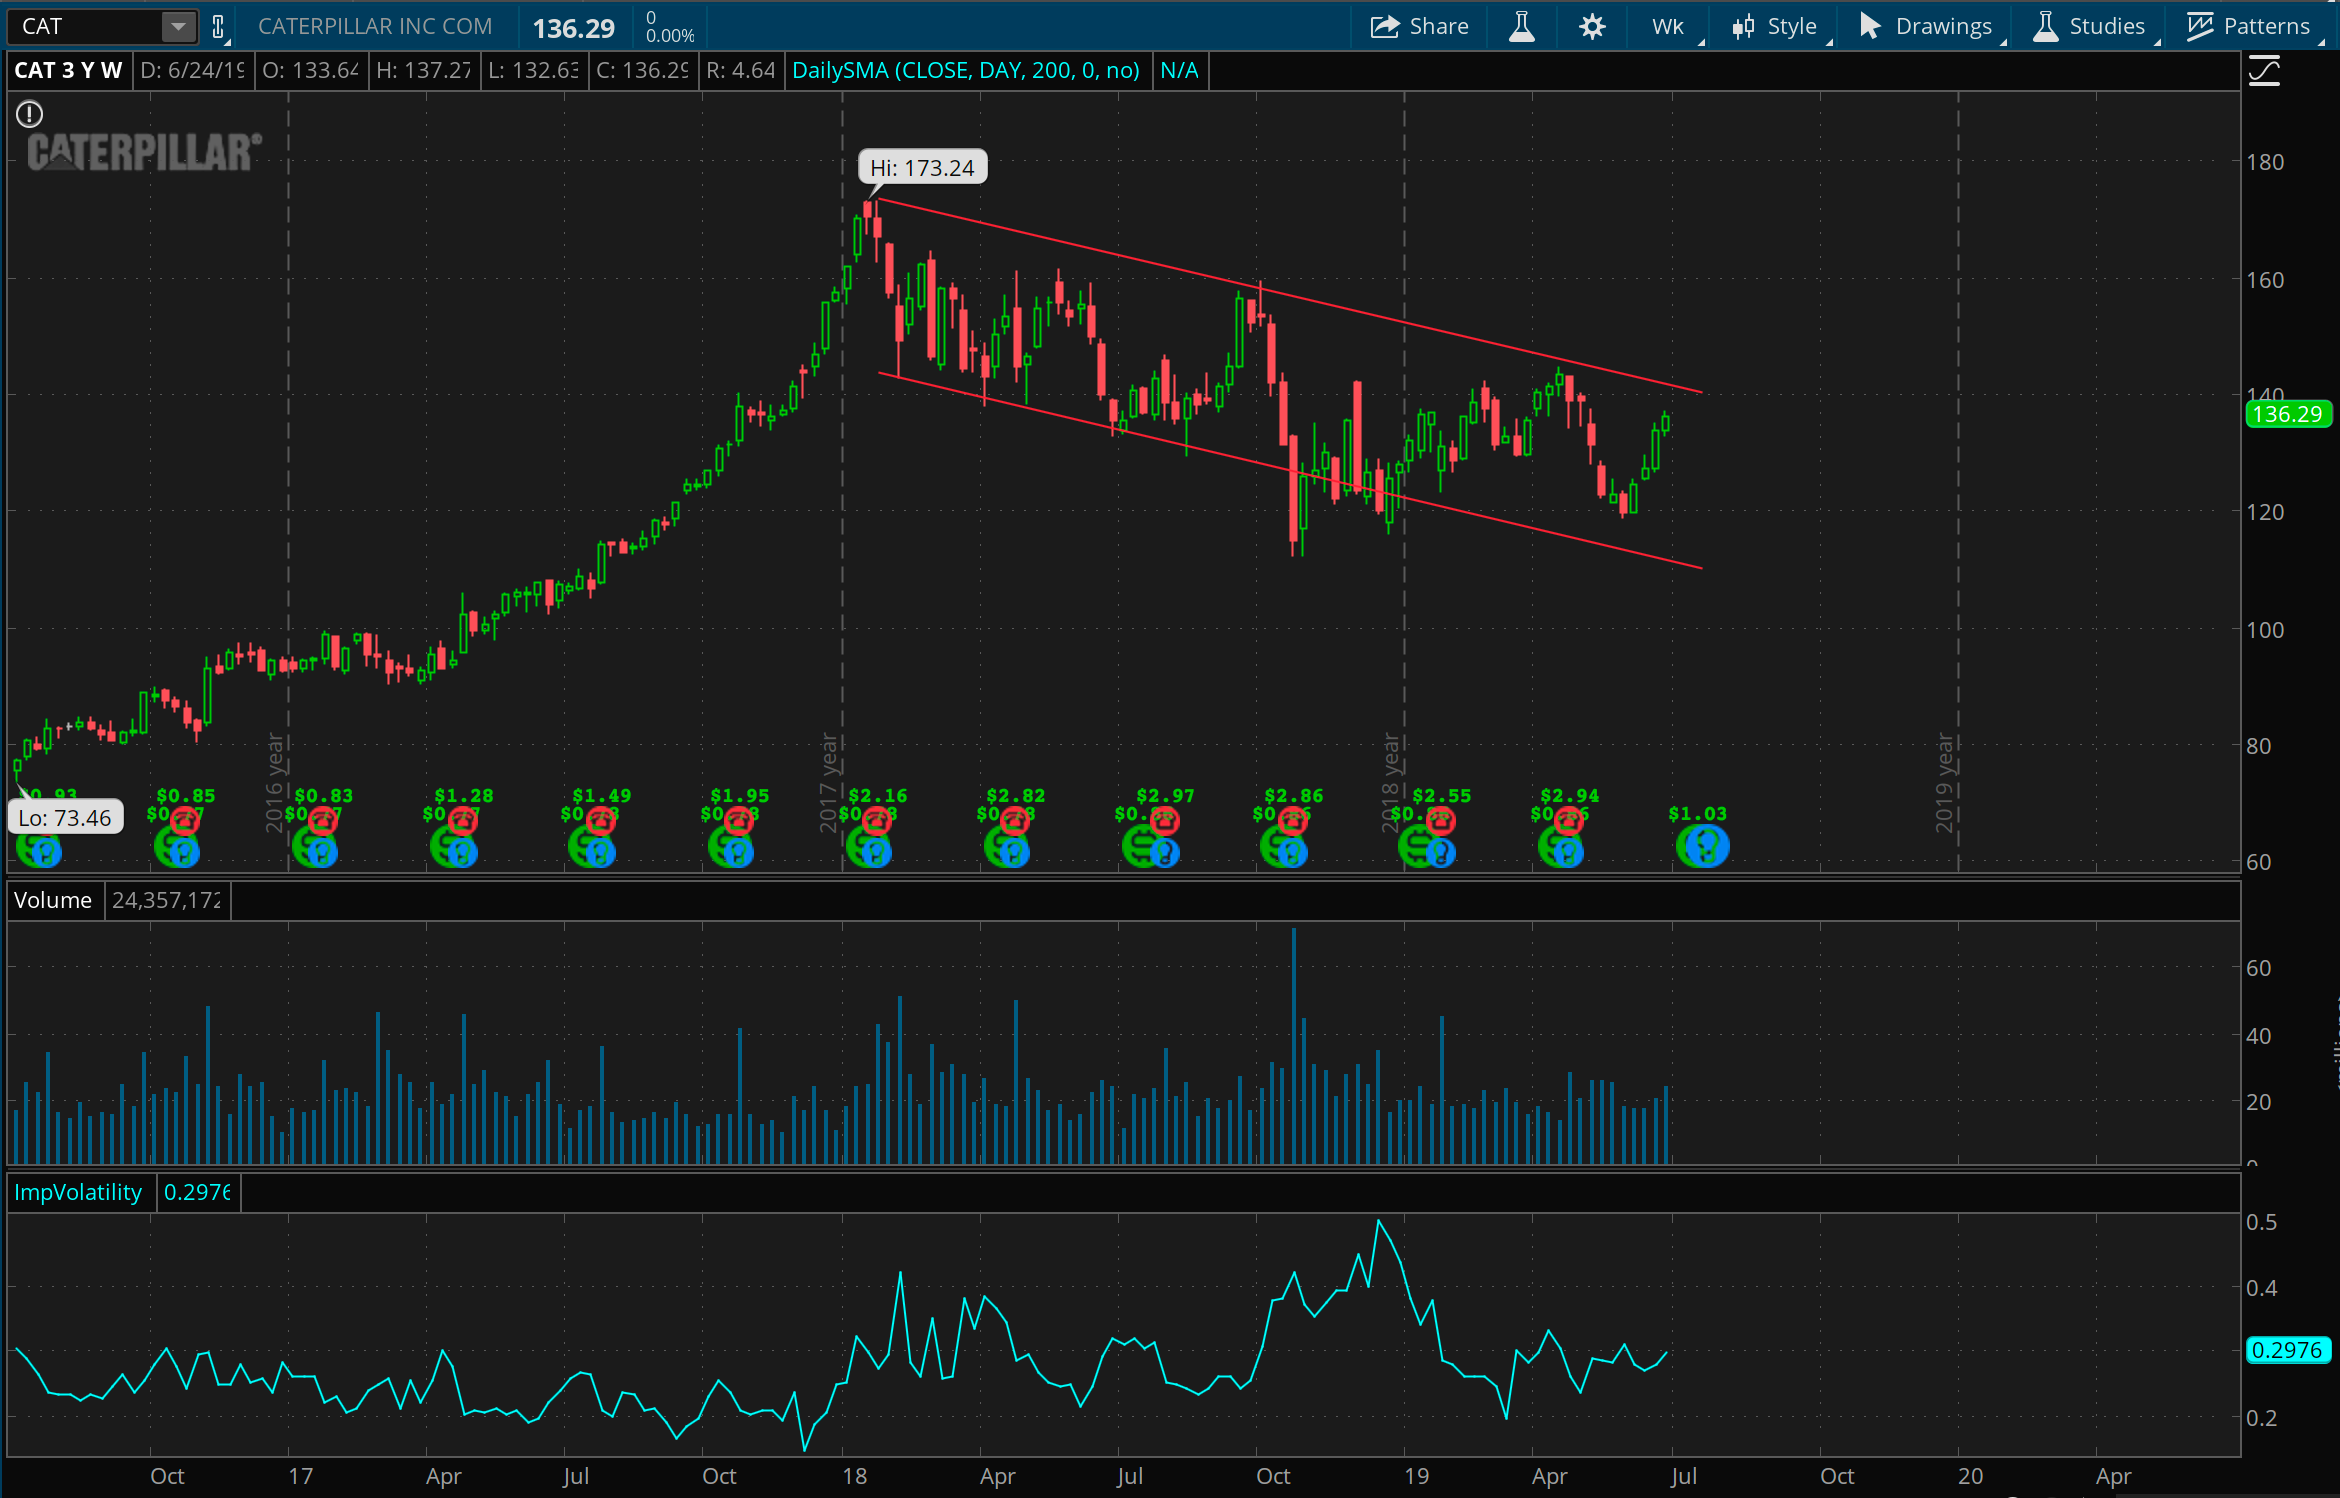
Here’s a lovely trade-in-waiting, with CAT nearing the upper end of a multi-year downward price channel. The above chart is a three year chart, and you can see that around 140 could be a great place to step into this trade. I’ll be stalking this a bit closer over the next couple weeks, and hoping to find this trade prior to our next minor (or major) downturn in the broader market.