VXX spikes!
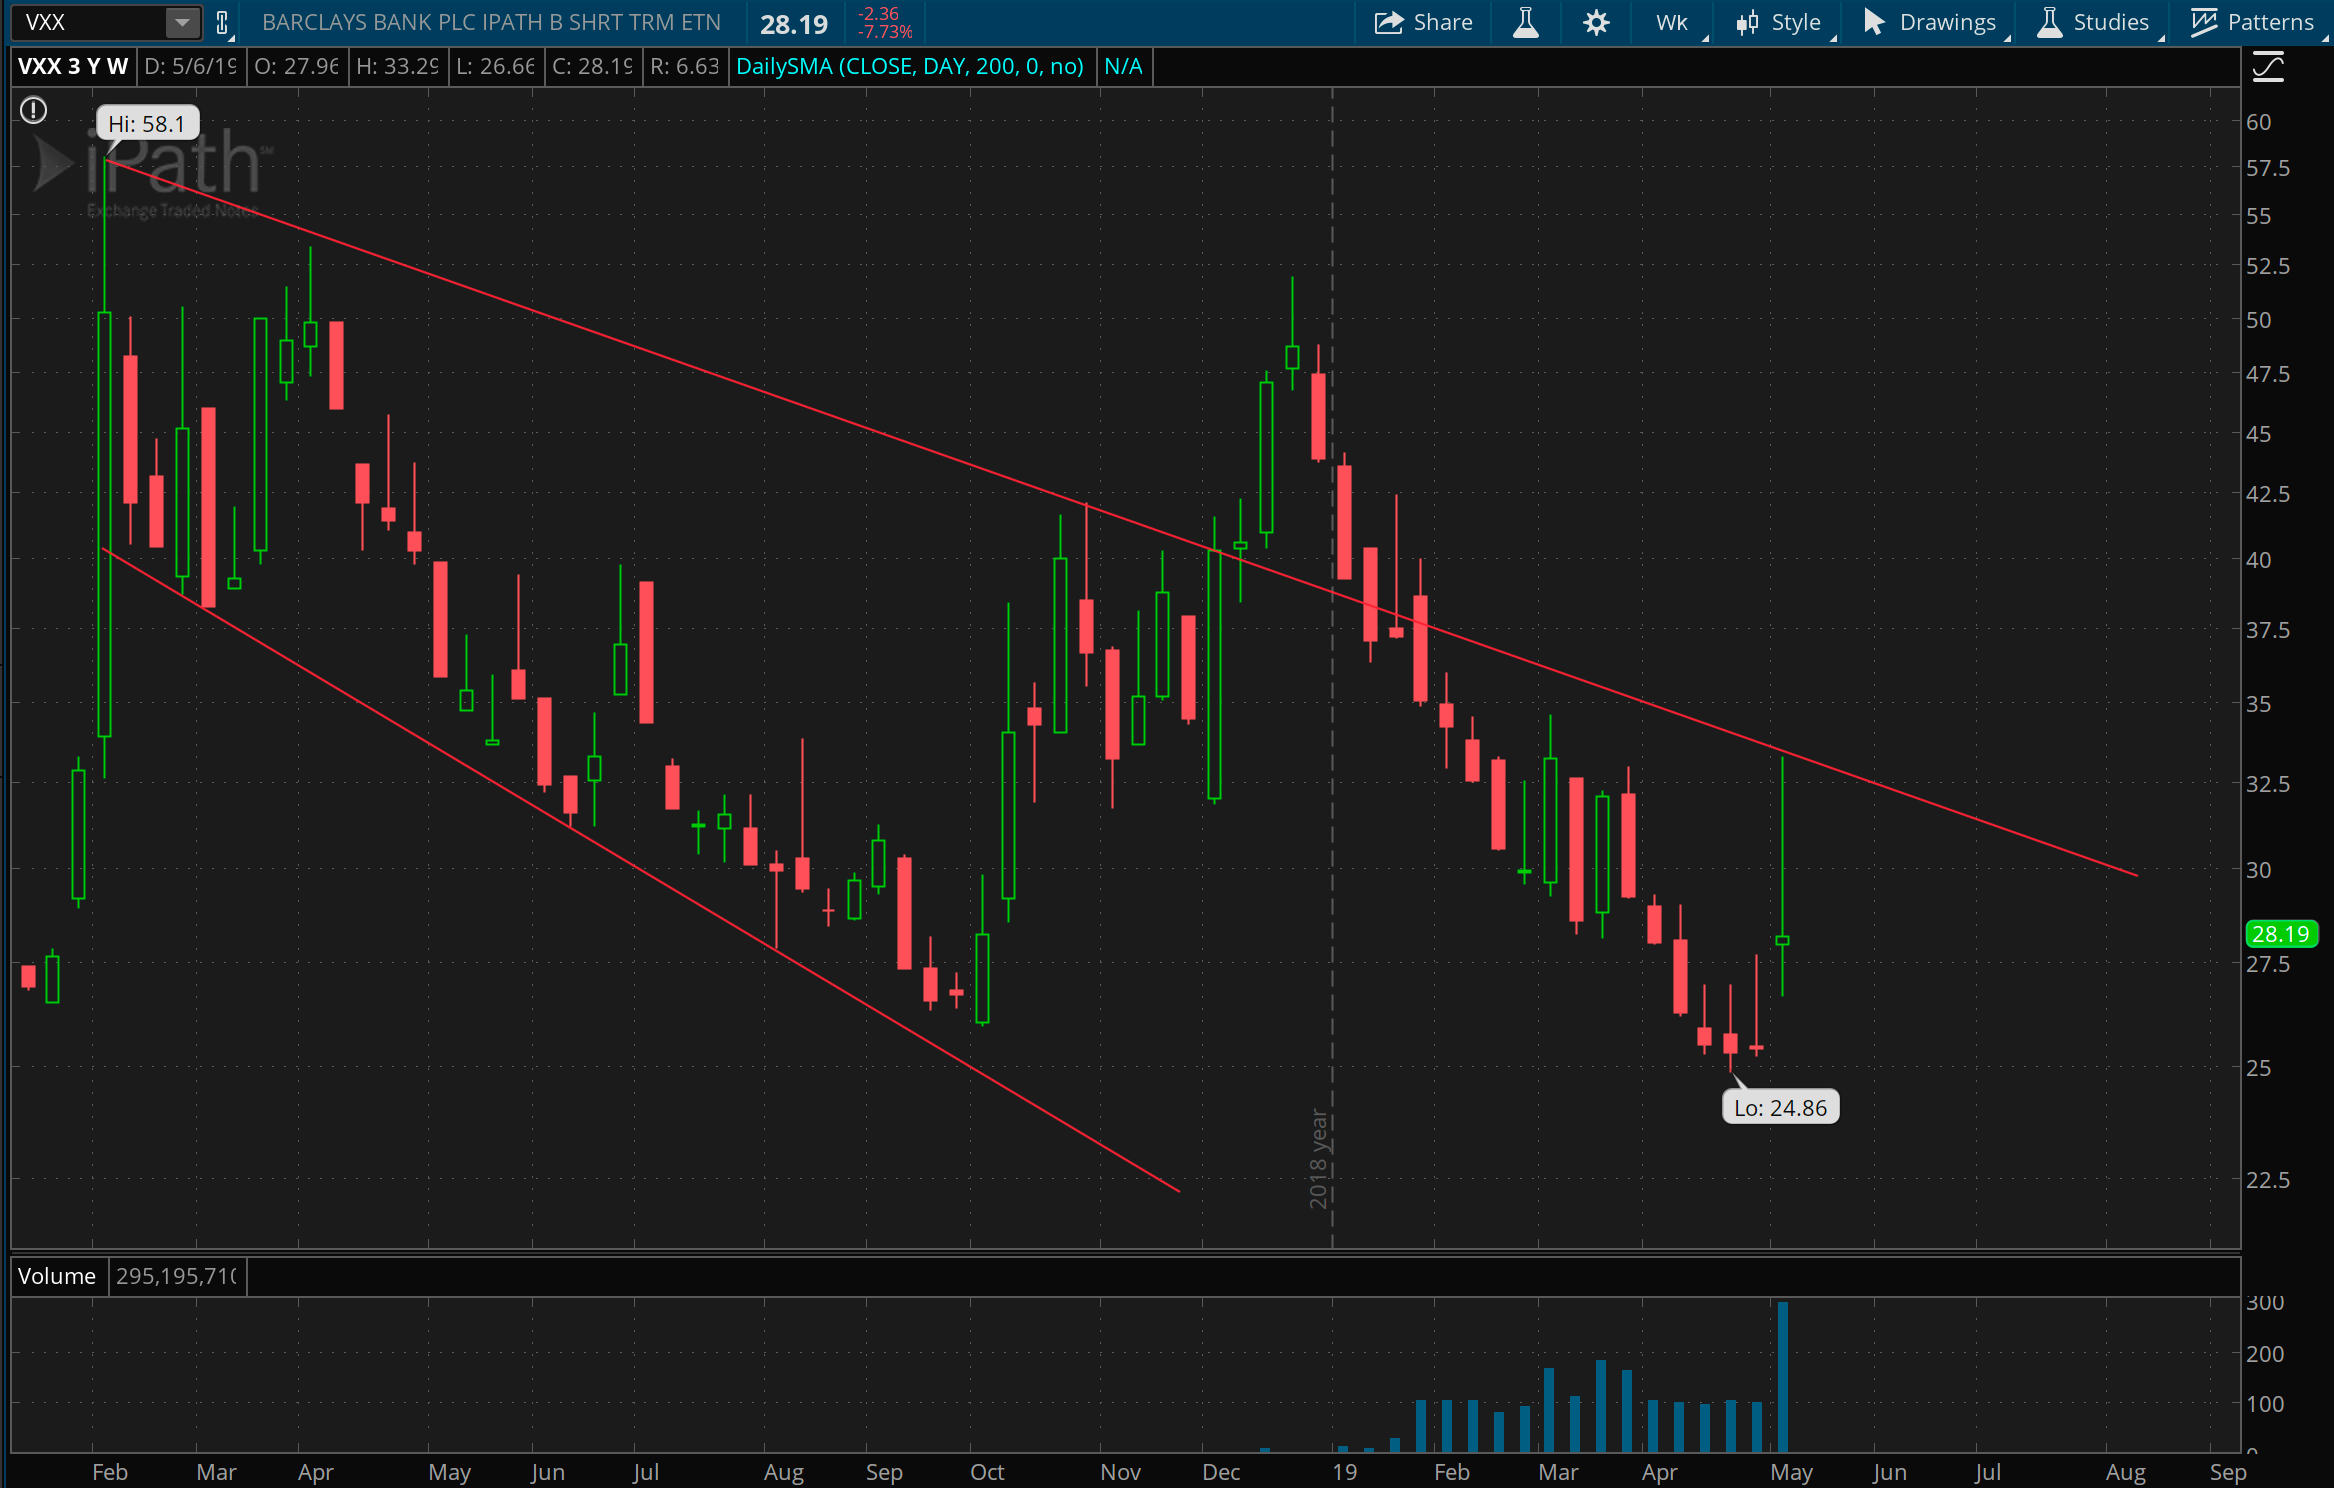
The VXX (an ETN holding a long investment in VIX futures) took on a spectacular spike this week, rising over 15% intraday on May 7th (Tuesday). From where it ended last week at 25.42, the intraday high of 33.29 on the 9th represents a 31% increase.
Note that the high on this weekly chart met a trend of prior resistance from April / May and then Nov / Dec of 2018. I wouldn’t take much from that though, since the nature of volatility is to feed on itself and spike out. When market players see a spike in volatility, it can lead to more market activity and thus more volatility.
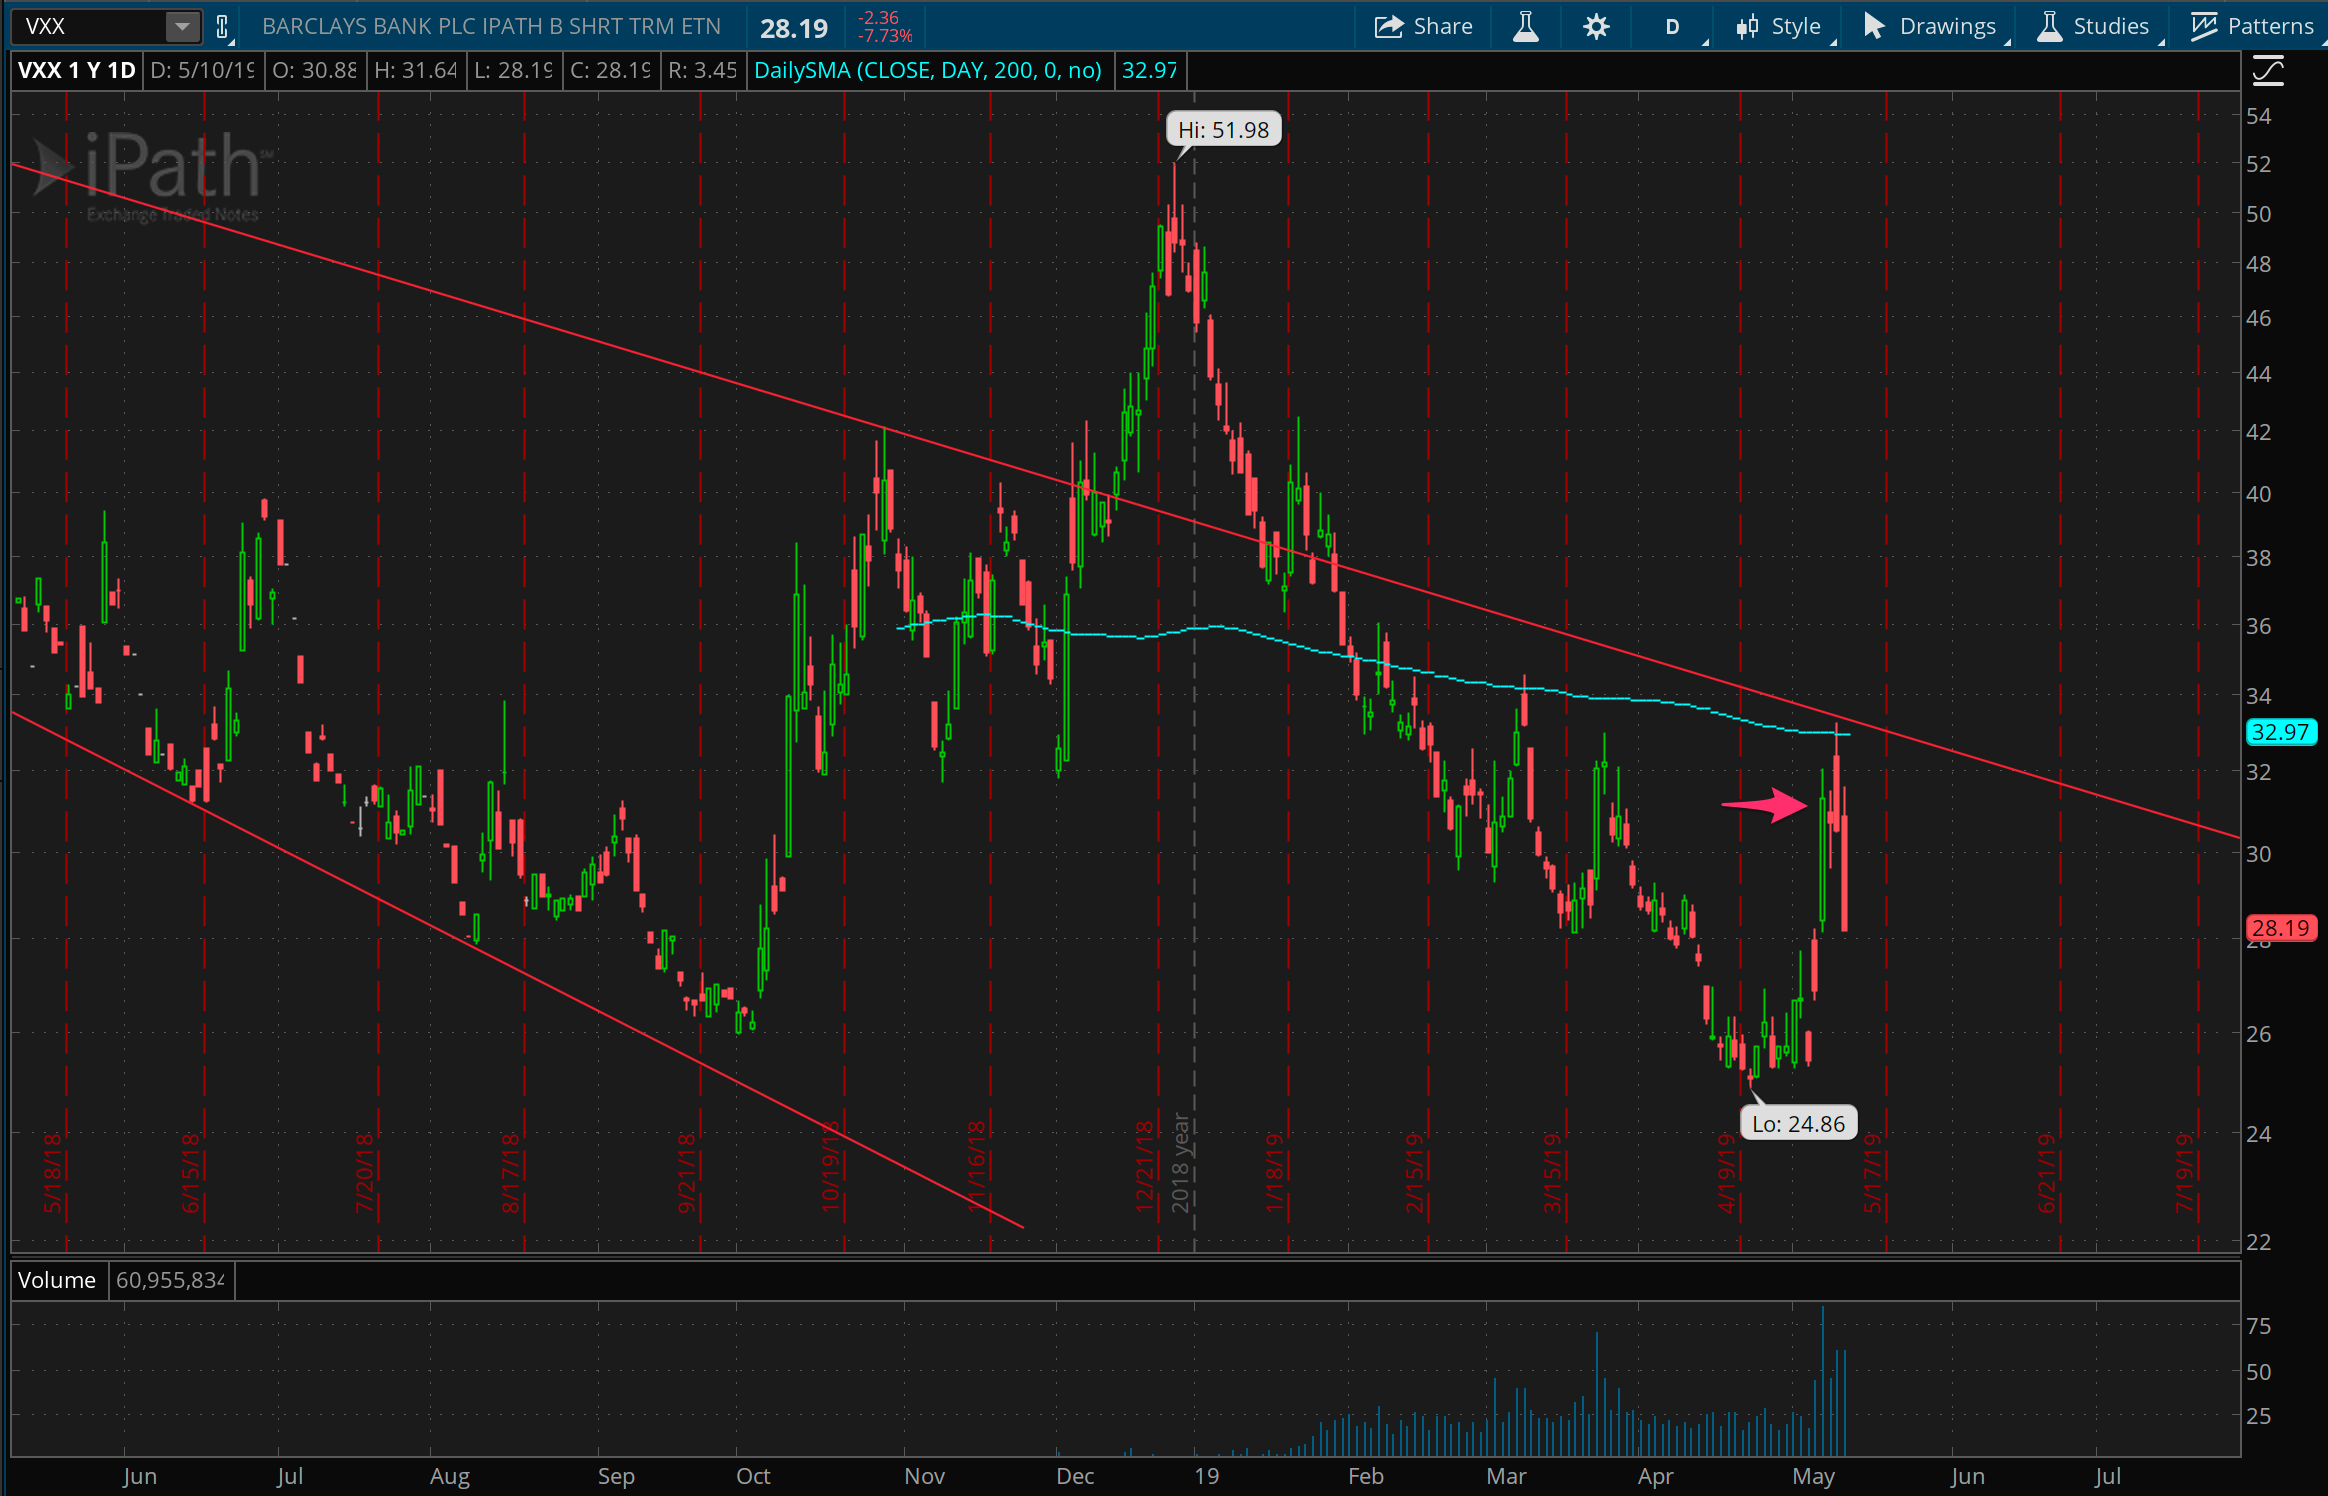
A closer look at the VXX, showing daily bars for a year, and revealing the internals of this week. To be honest I hadn’t considered the chart at all when I shorted this on the 7th at 31.62 (indicated with the red arrow). I just noticed it had shot up over 15% in a single day, back to over 30, and thought it was a good point to nibble into it. I figured it might still spike further through the week and was prepared to take more bites. Instead it came in over 10% in 3 days, and I wish I started with more!
Support for the Qs
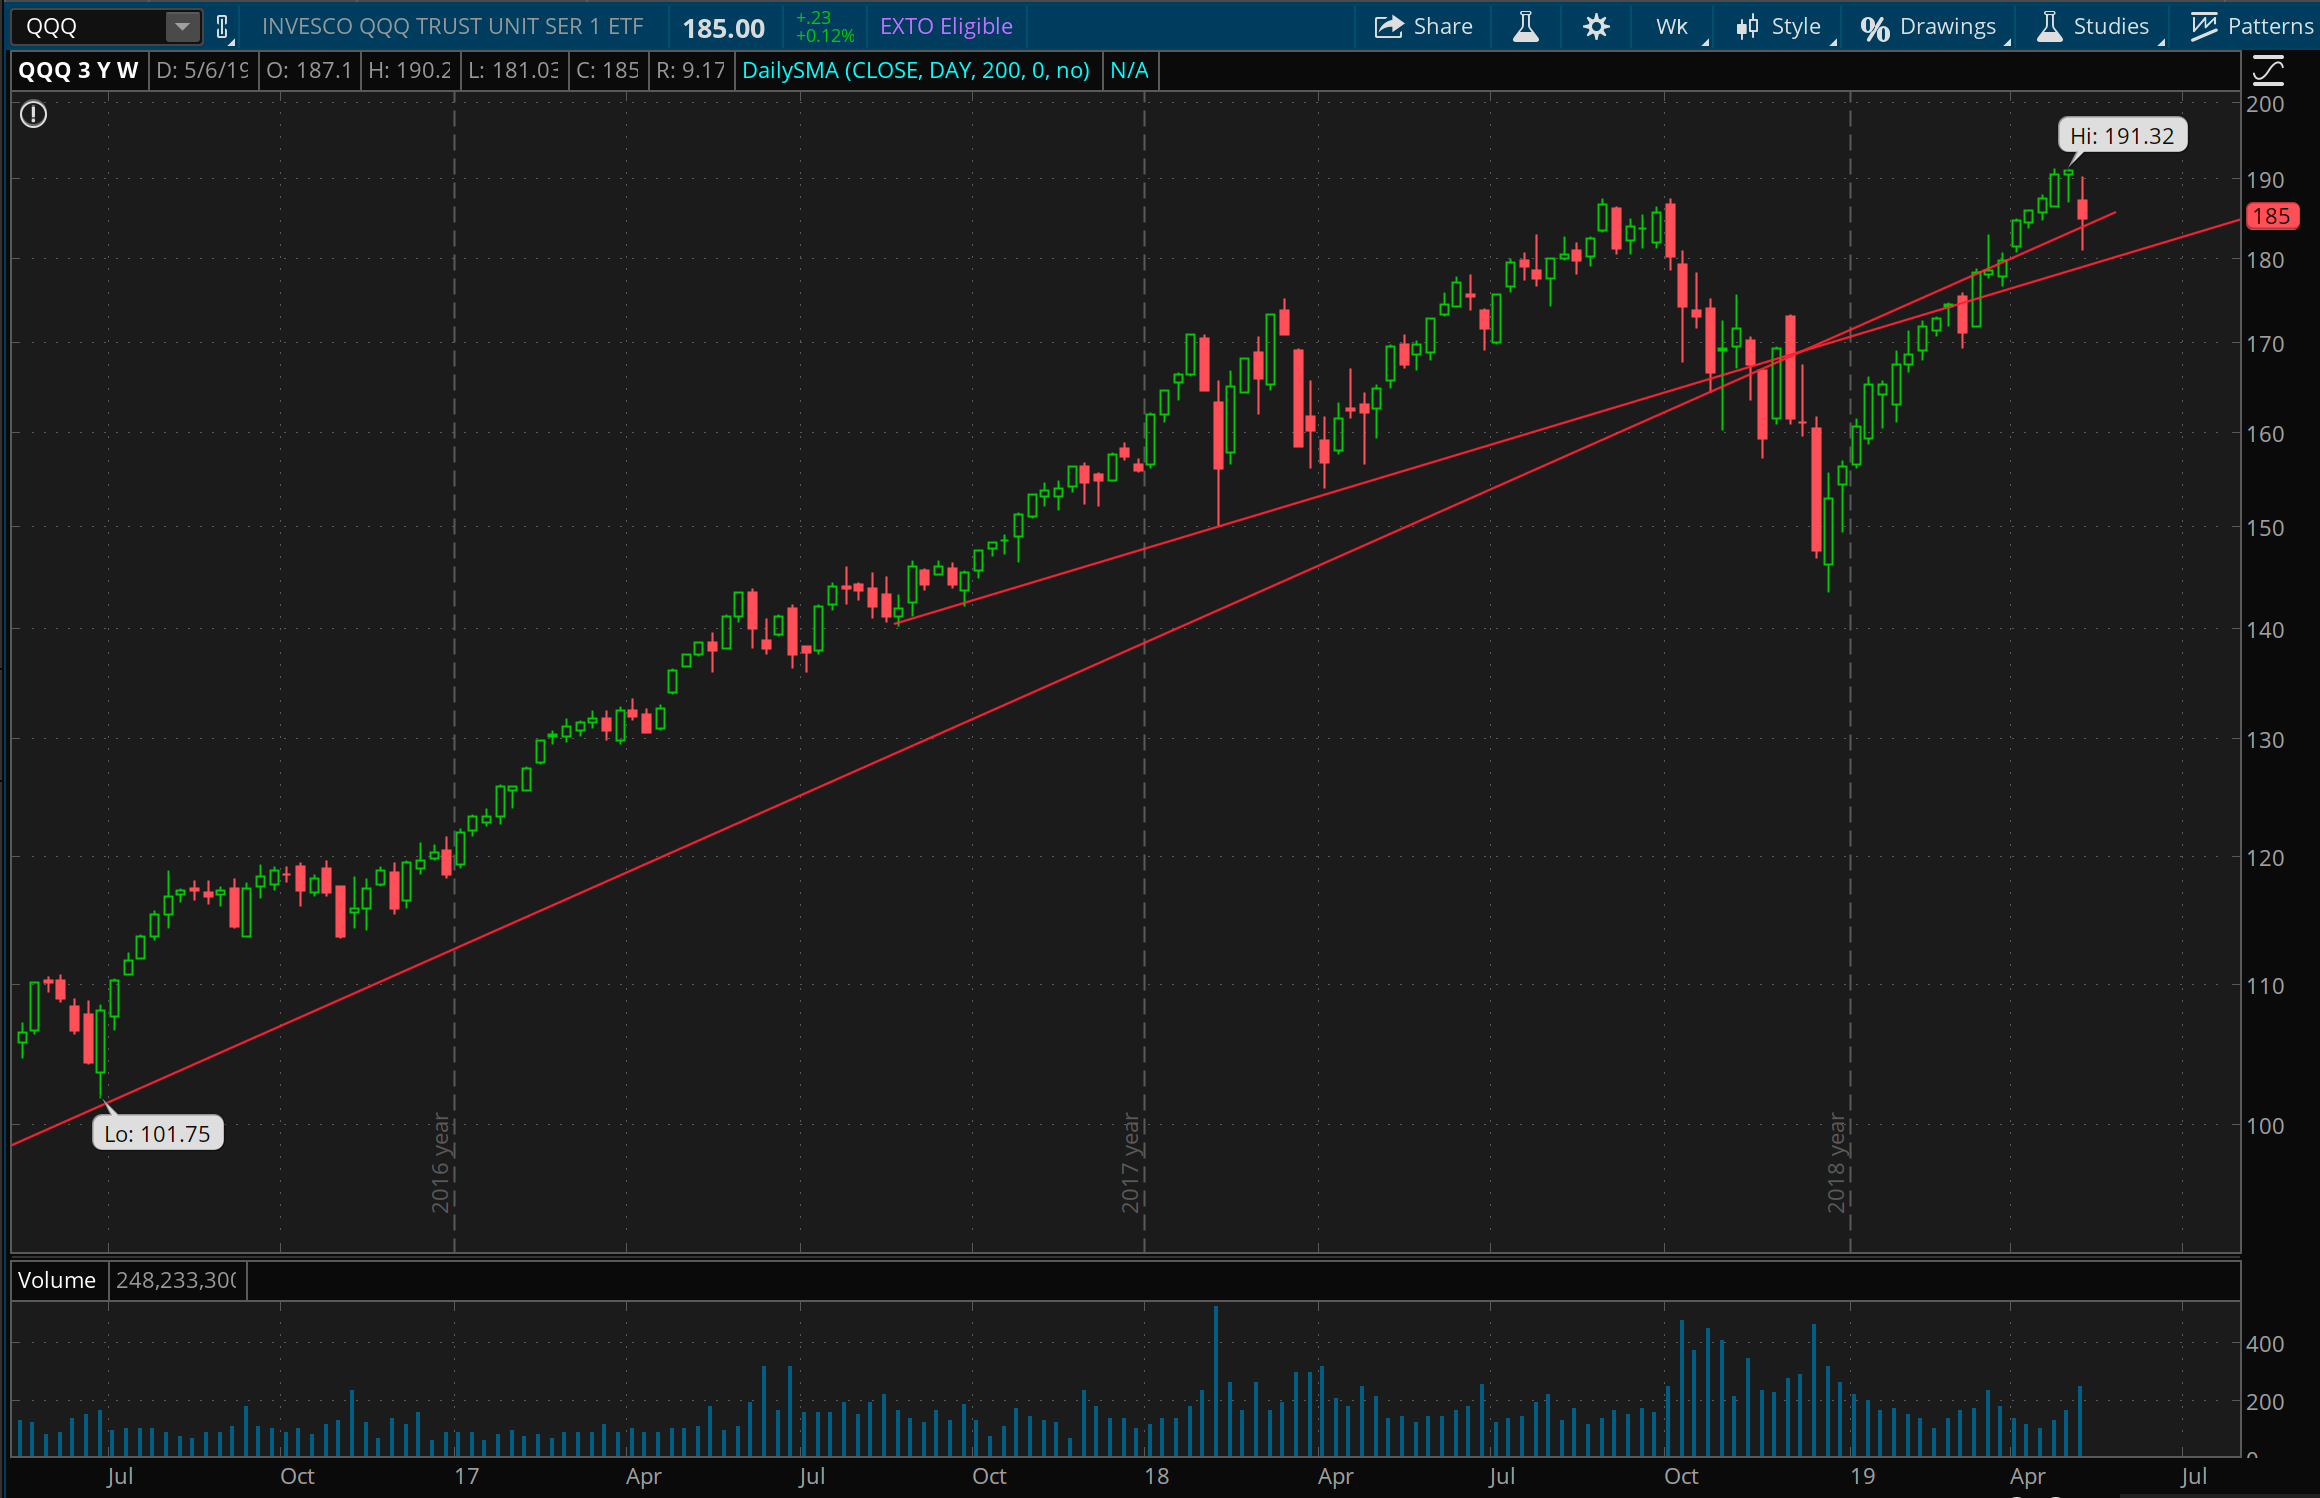
The important line on this long term chart of QQQ is the shorter one starting from July 17th that touches the turnaround or congestion points in Feb / Apr 2018 and then Oct - Dec 2018. I do think this line represents “support”. I put that in quotes because I don’t think the Qs are going to just bounce right off, but I’d think it more likely than not to see the price hang around that line for a little bit before it falls out of bed (if it does).
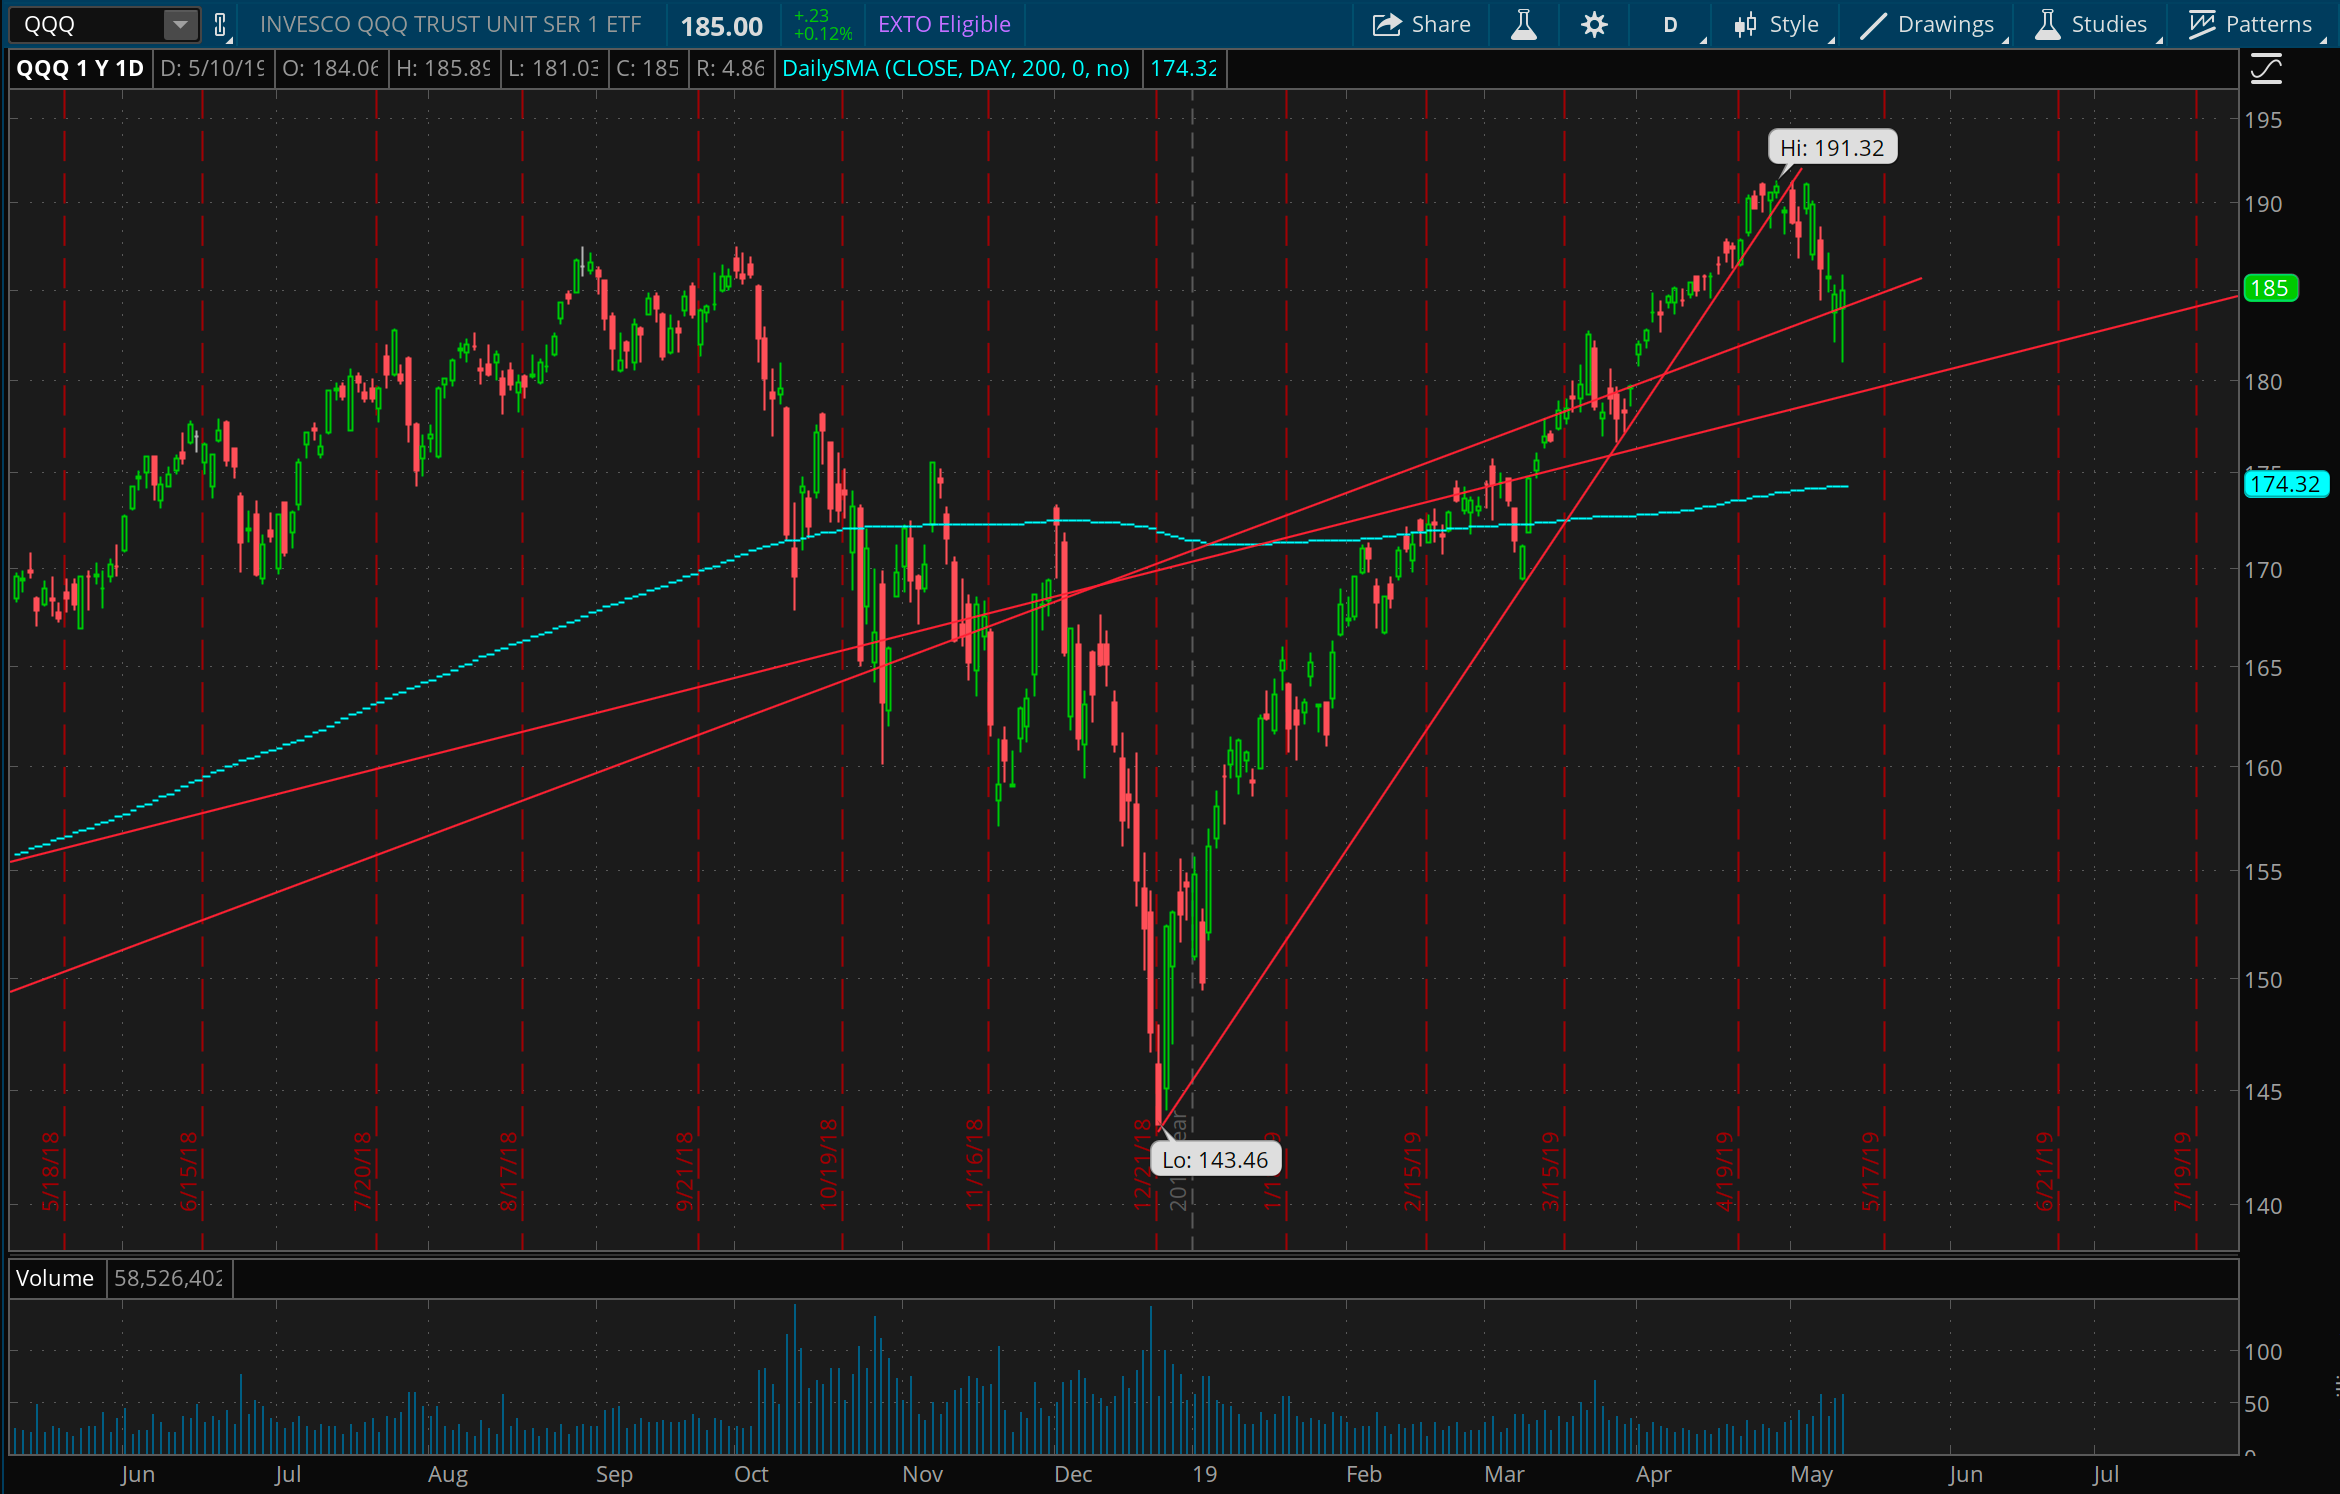
You can see further in the dailies for QQQ. Here we also get the 200 day moving average, which shows yet more “support”, or perhaps even “gravity” wherein we should expect the price to stay near it as the MA rises or price falls. I’m looking to put in some defined risk trades in the form of put spreads on any sort of good move down. If we head to 180 or below, I’ll want to put on some (defined risk) trades against it falling further than 170-175 in the following days and weeks.
Sketchy AAPL
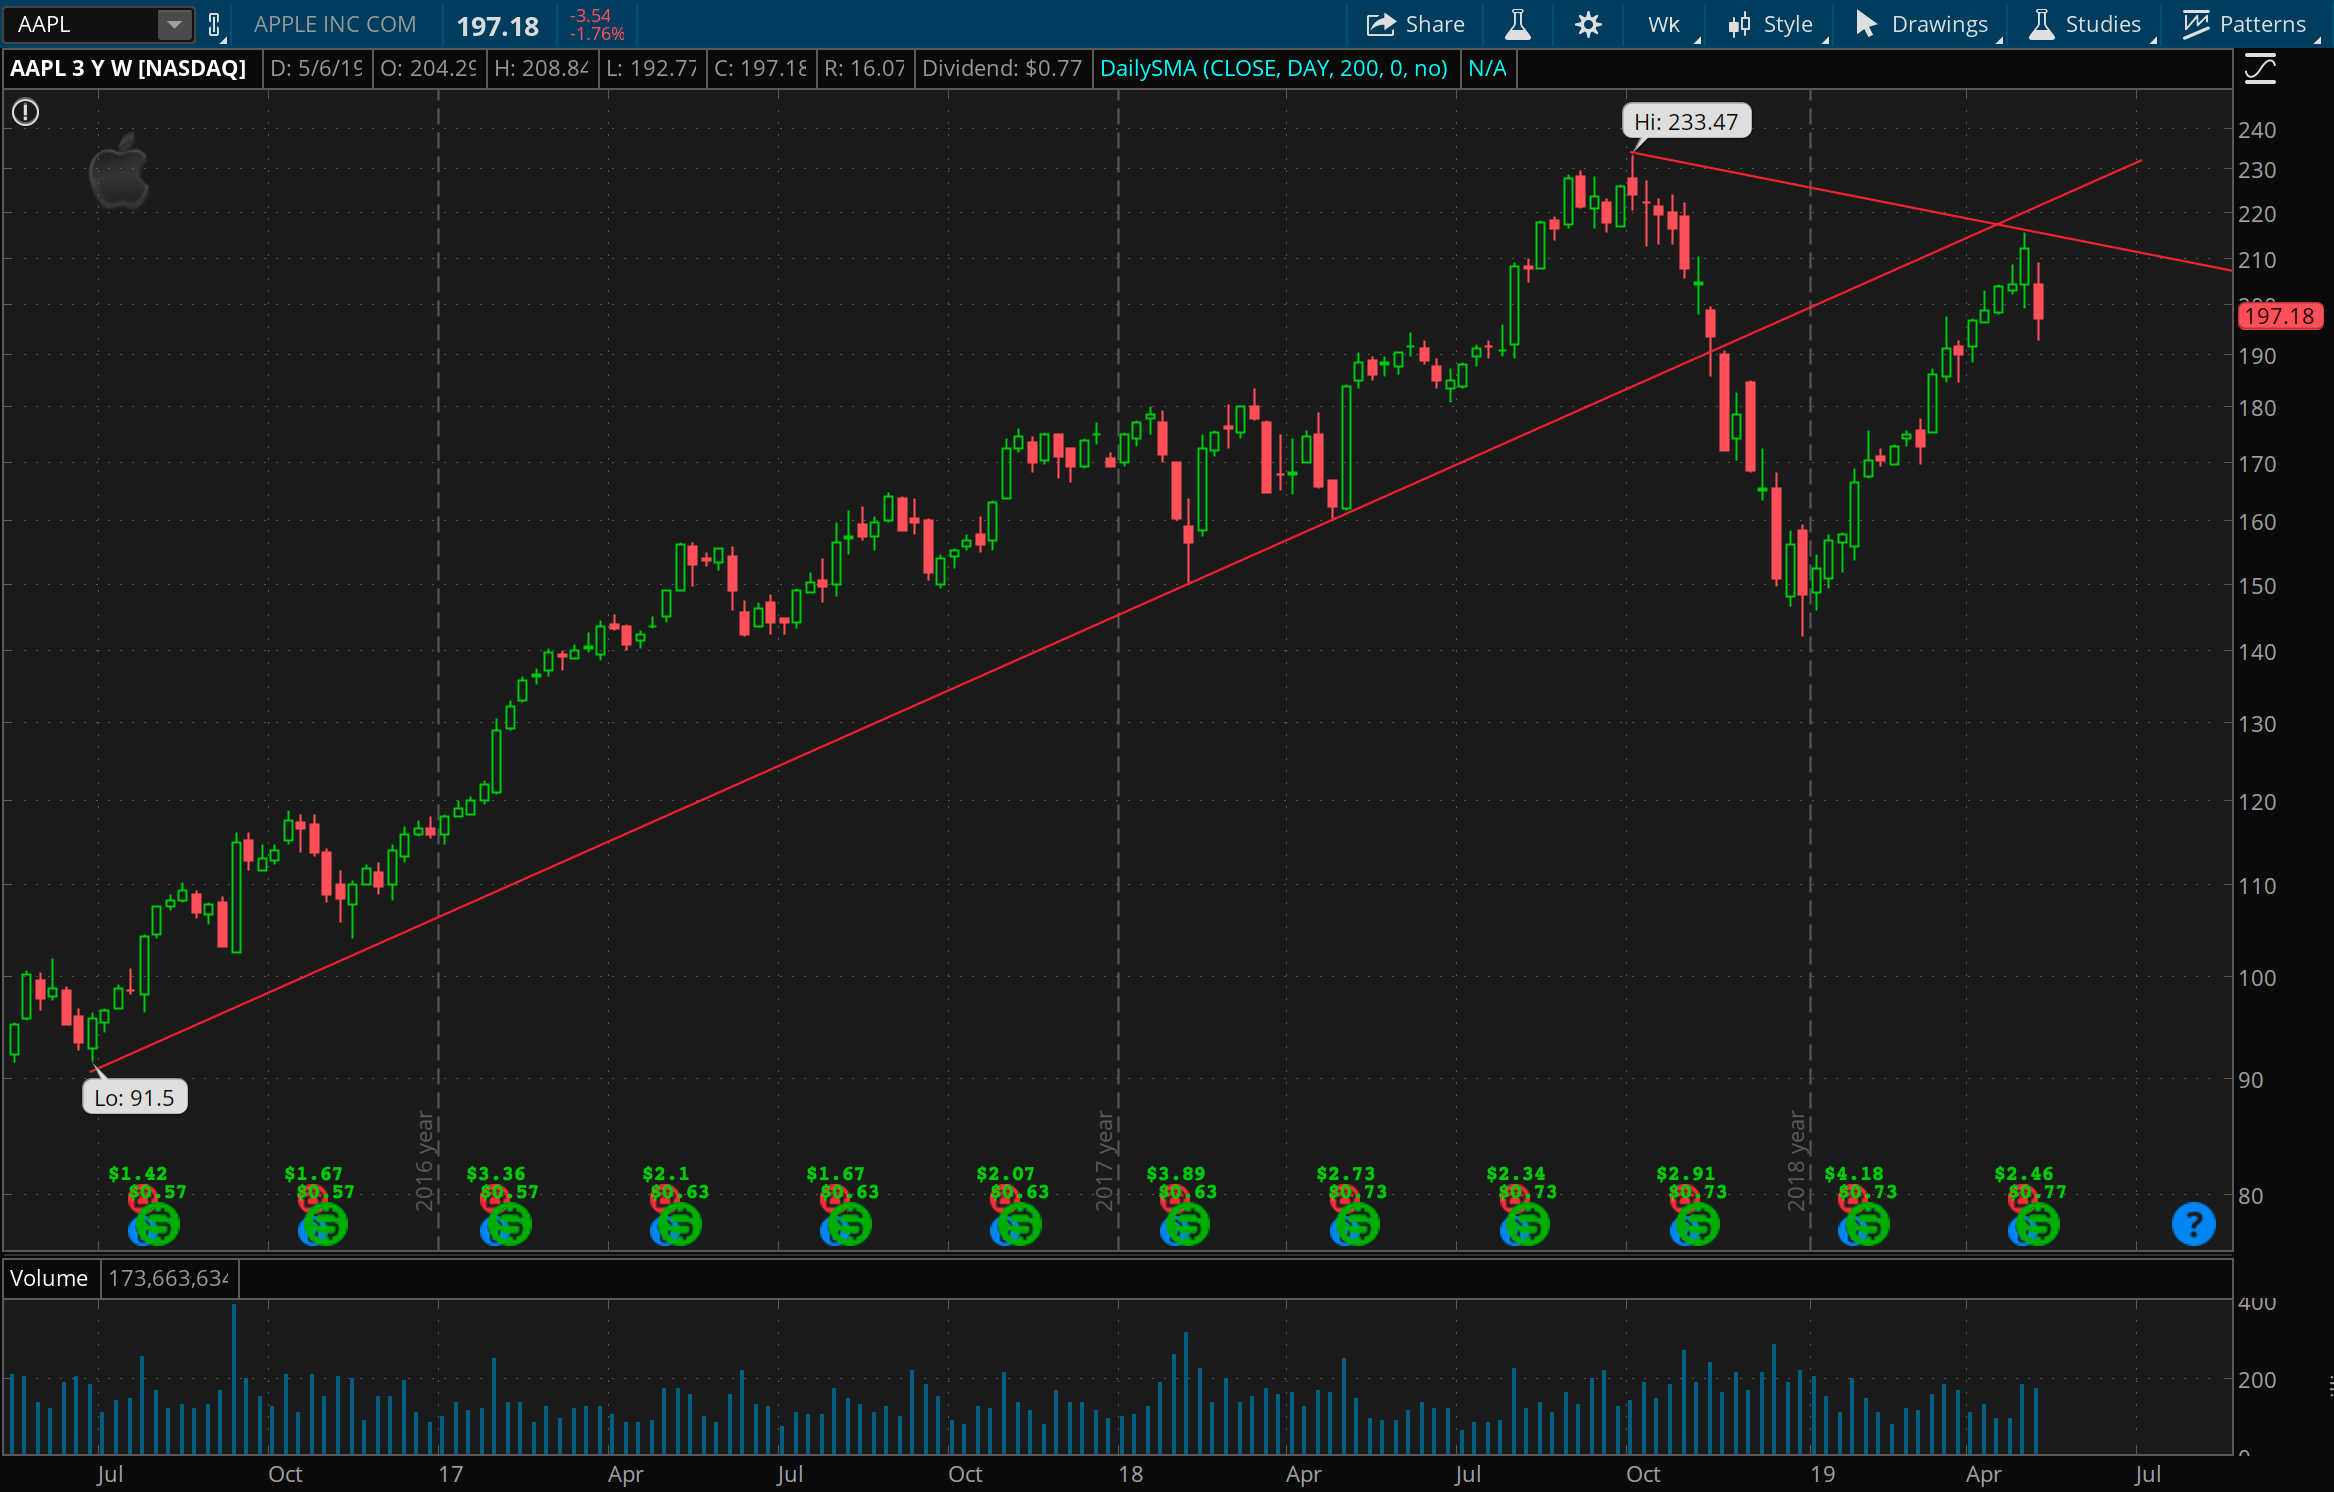
This 3 year chart of AAPL just looks sketchy. The support line anchored from July 2016 that captures touch points in late 2016 and early 2018 seems to have flipped to resistance after AAPL’s incredible fall in late 2018, as it dropped nearly 40% in the last three months of the year. (Yes, almost cut in half.)
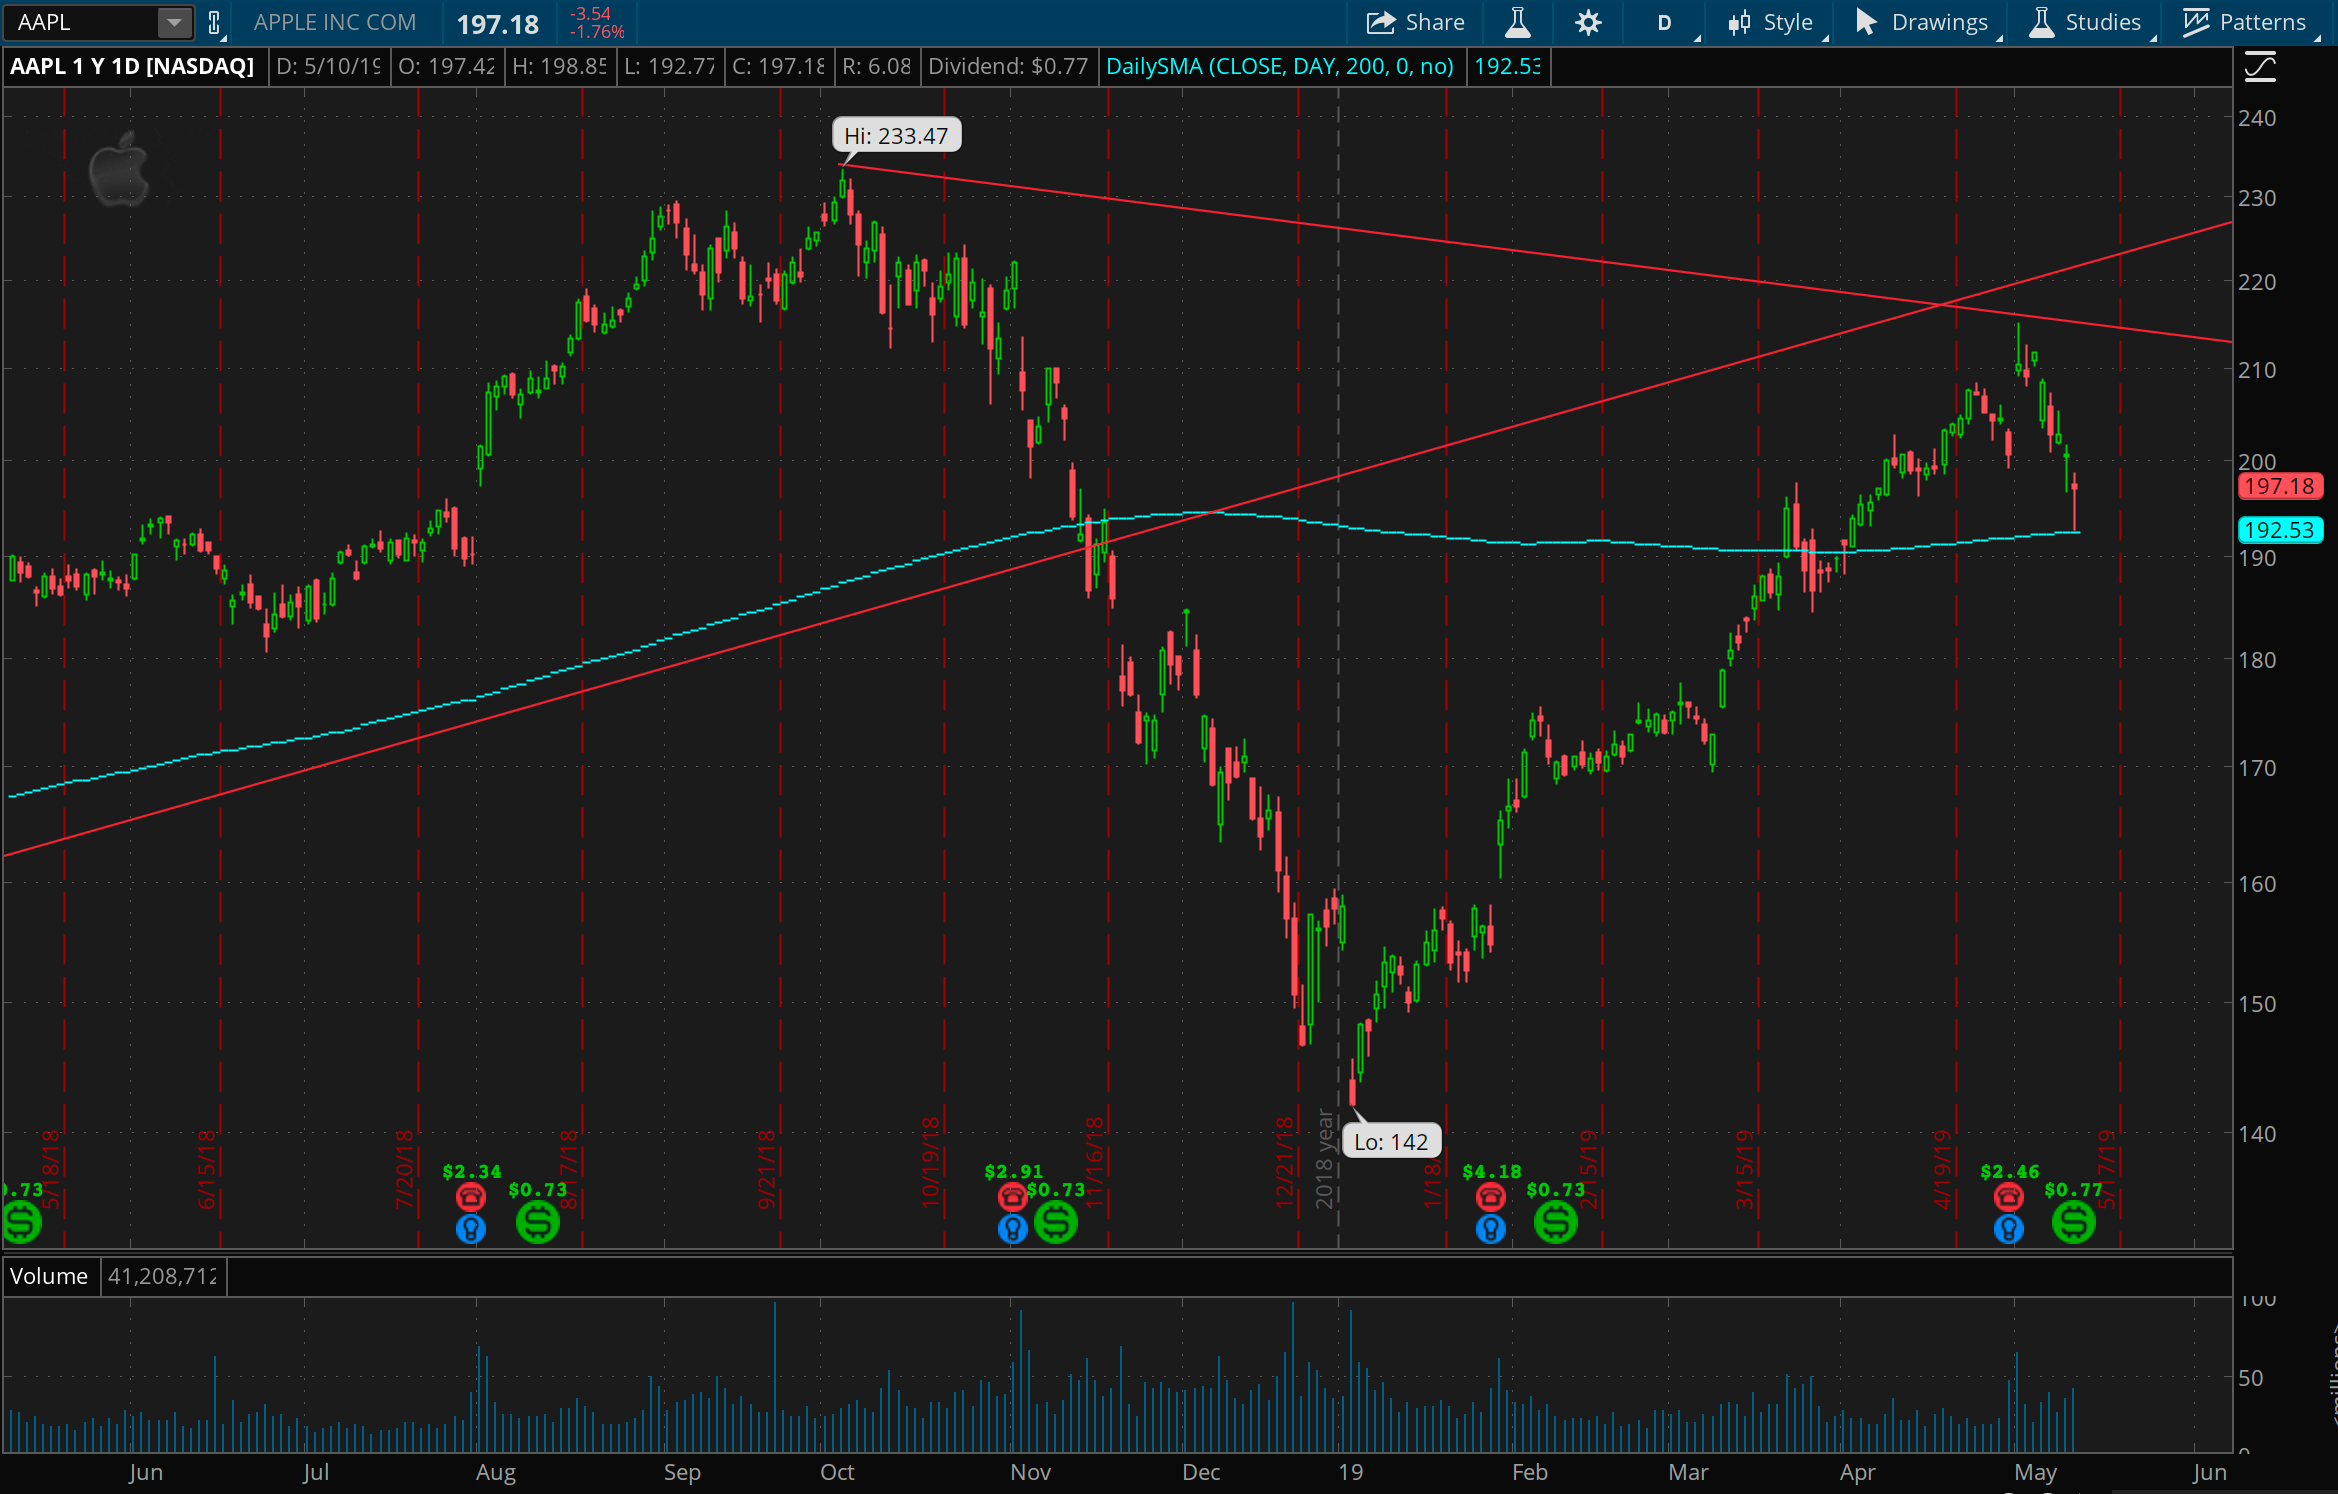
The daily chart tells an interesting story where we see a week of declines in AAPL bounce near perfectly off of its 200 day moving average. This might mean a little bit of congestion between 192 and 212 for a while, but still I’m bearish on AAPL’s overall direction during the next few months.
NFLX on the range
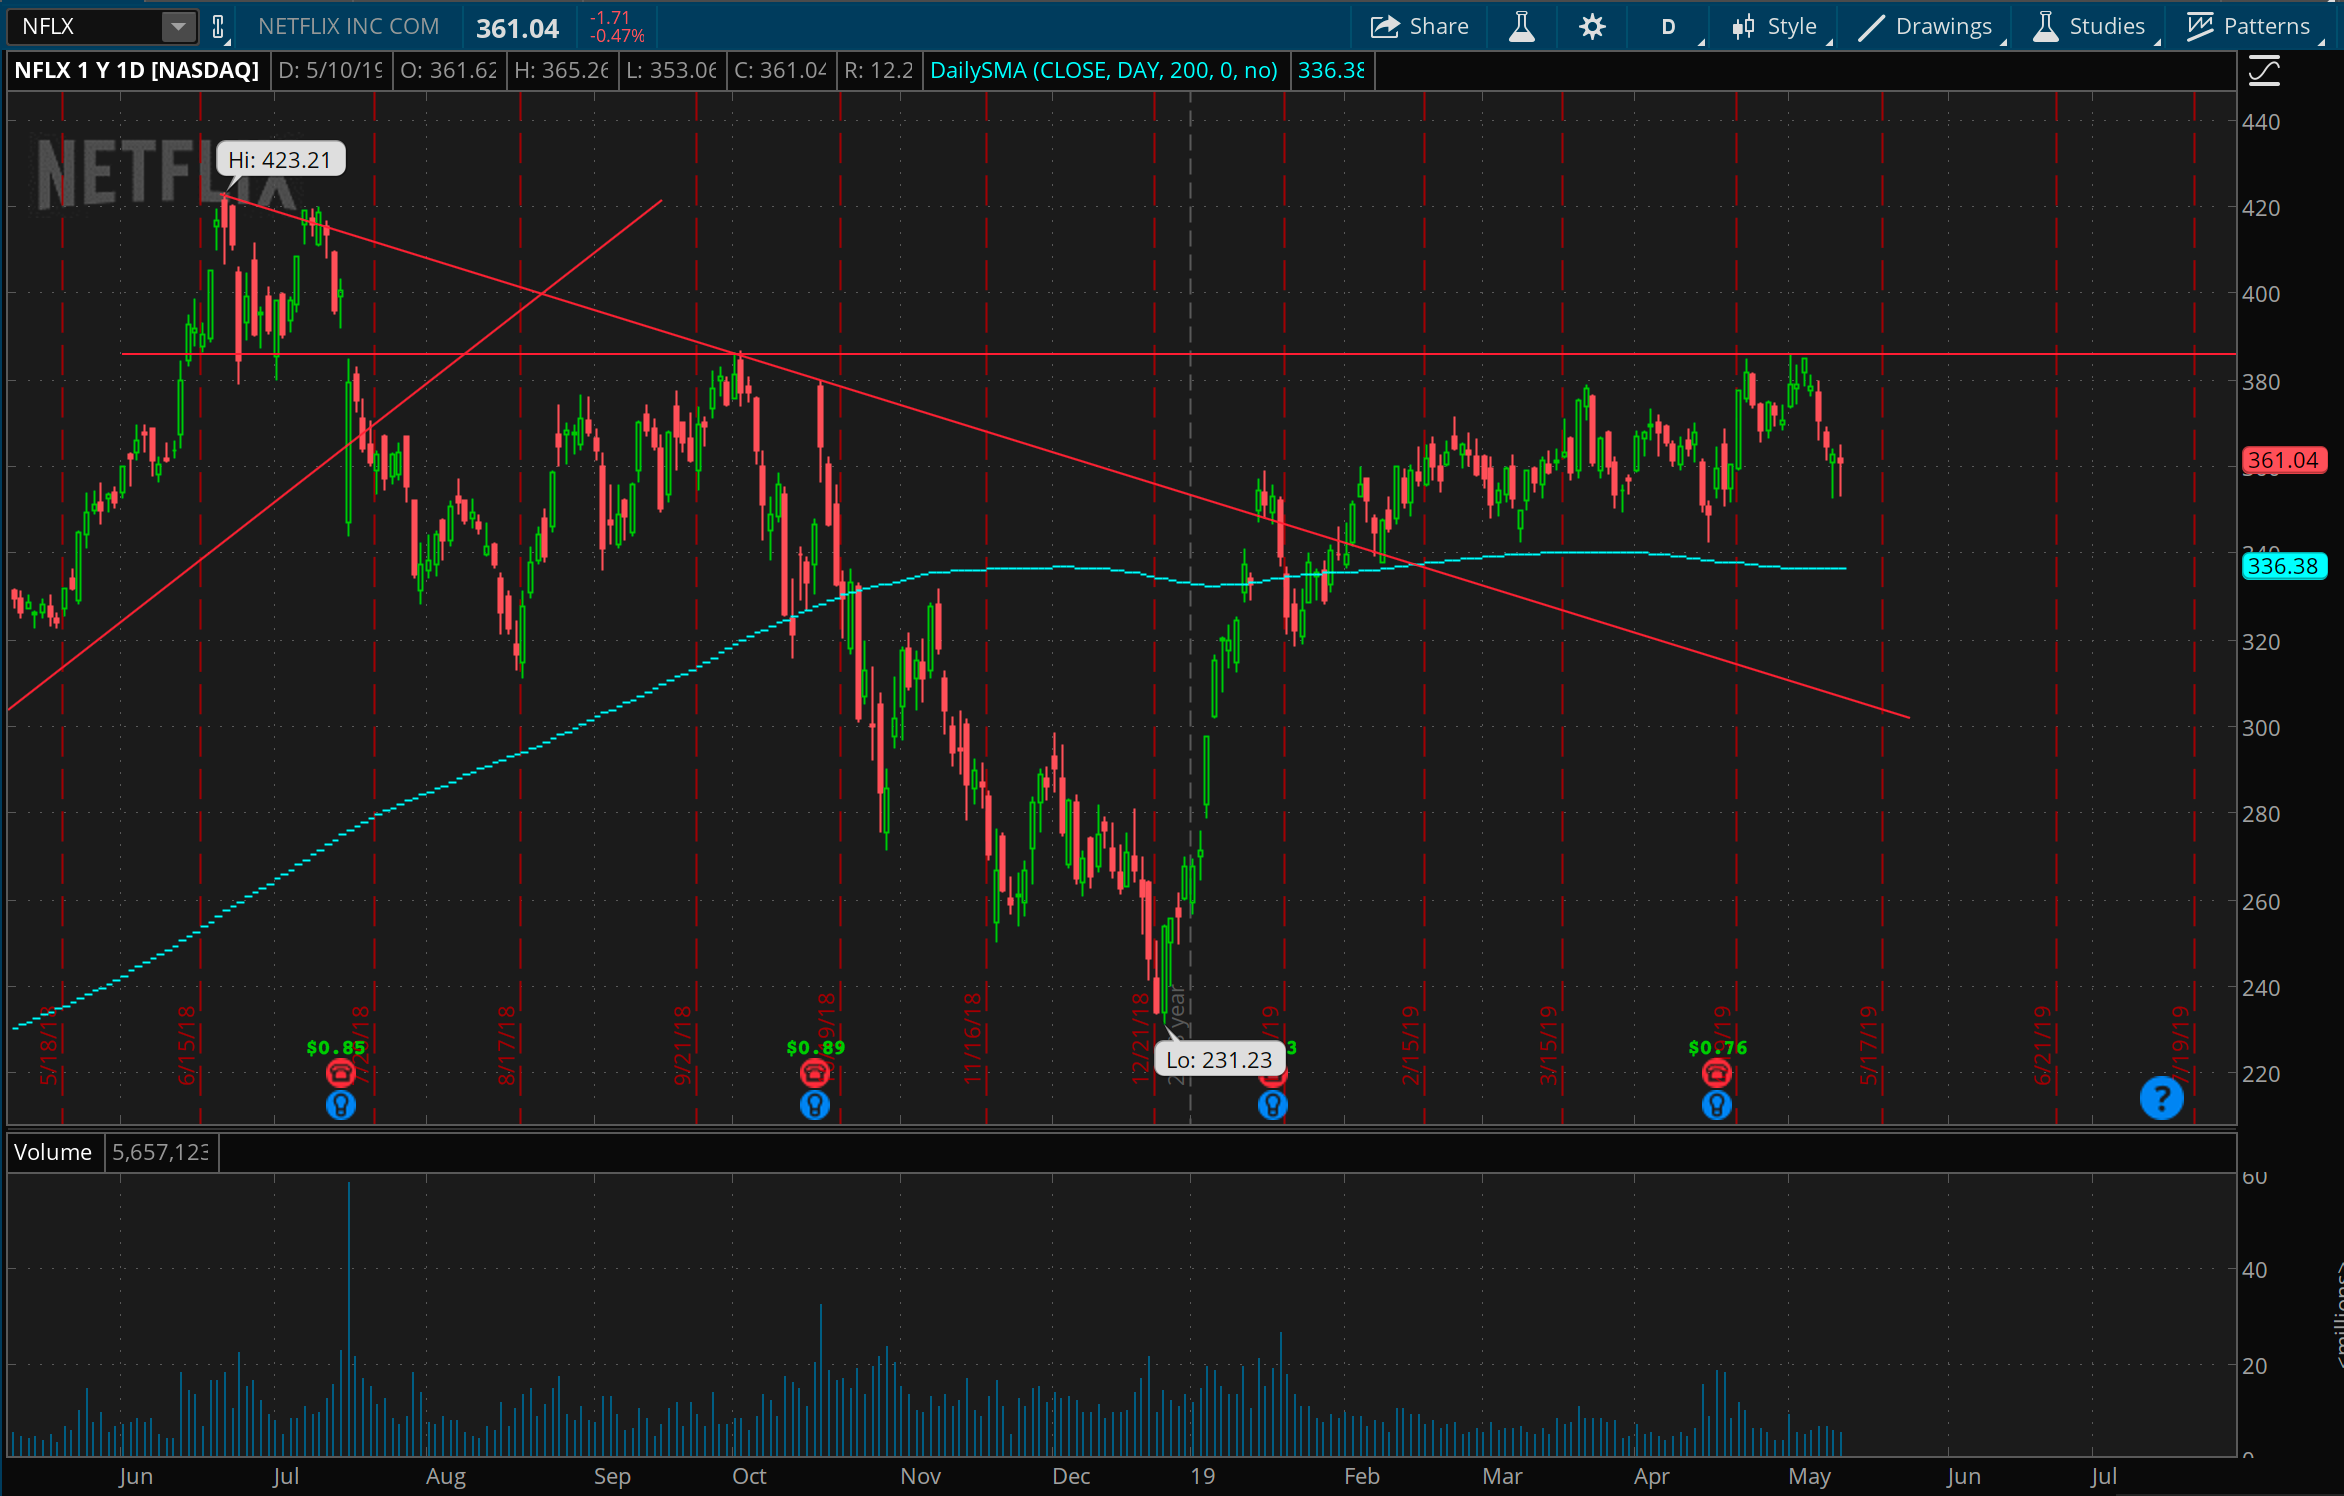
NFLX also has some potential to be rangebound for a while between an important overhead level around 385, and the 200 day moving average around 335. Planning to put on spreads around both these levels in the coming days and weeks as the price approaches them.
Bitcoin awakes!
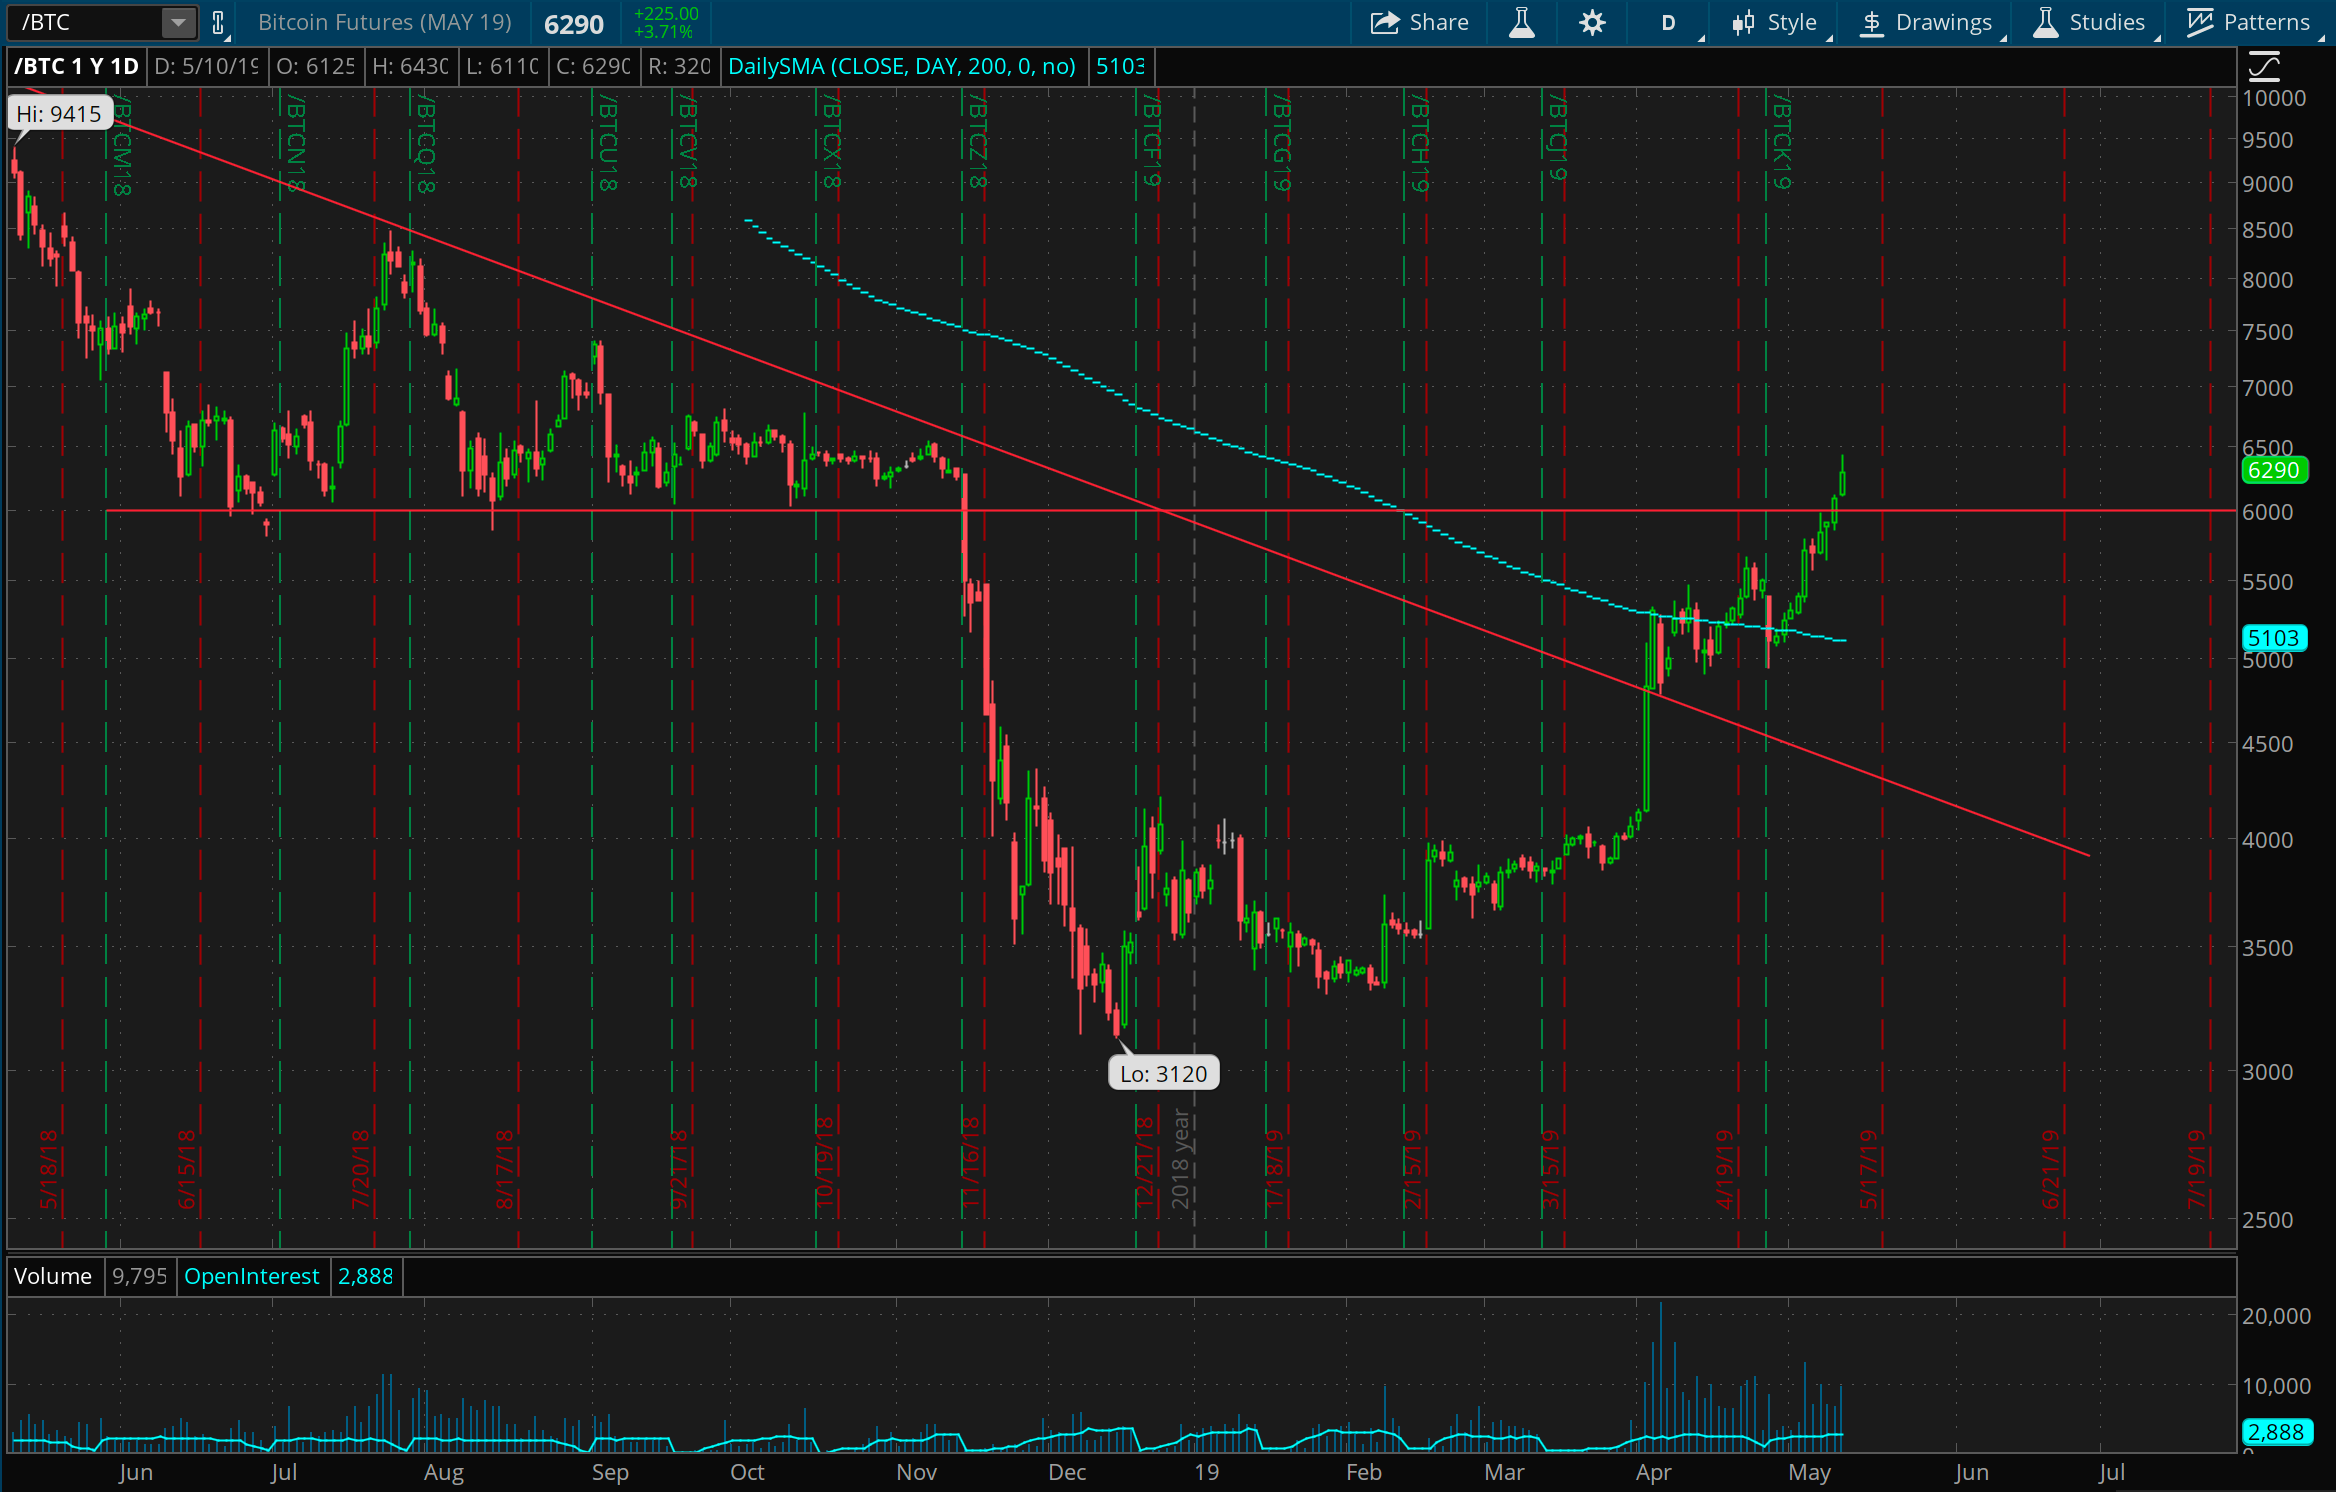
Bitcoin is waking up! After going through a big basing period around 3500 for the past 6 months or so, it has quite suddenly broken through a ton of resistance, including a long term down trendline anchored back from the opening futures price of 20,000, the 200 day moving average, and this key 6000 level. Not sure what’ll happen next but important it stays over this level, or else it could quickly spill back to 5000 or lower.
USO middling
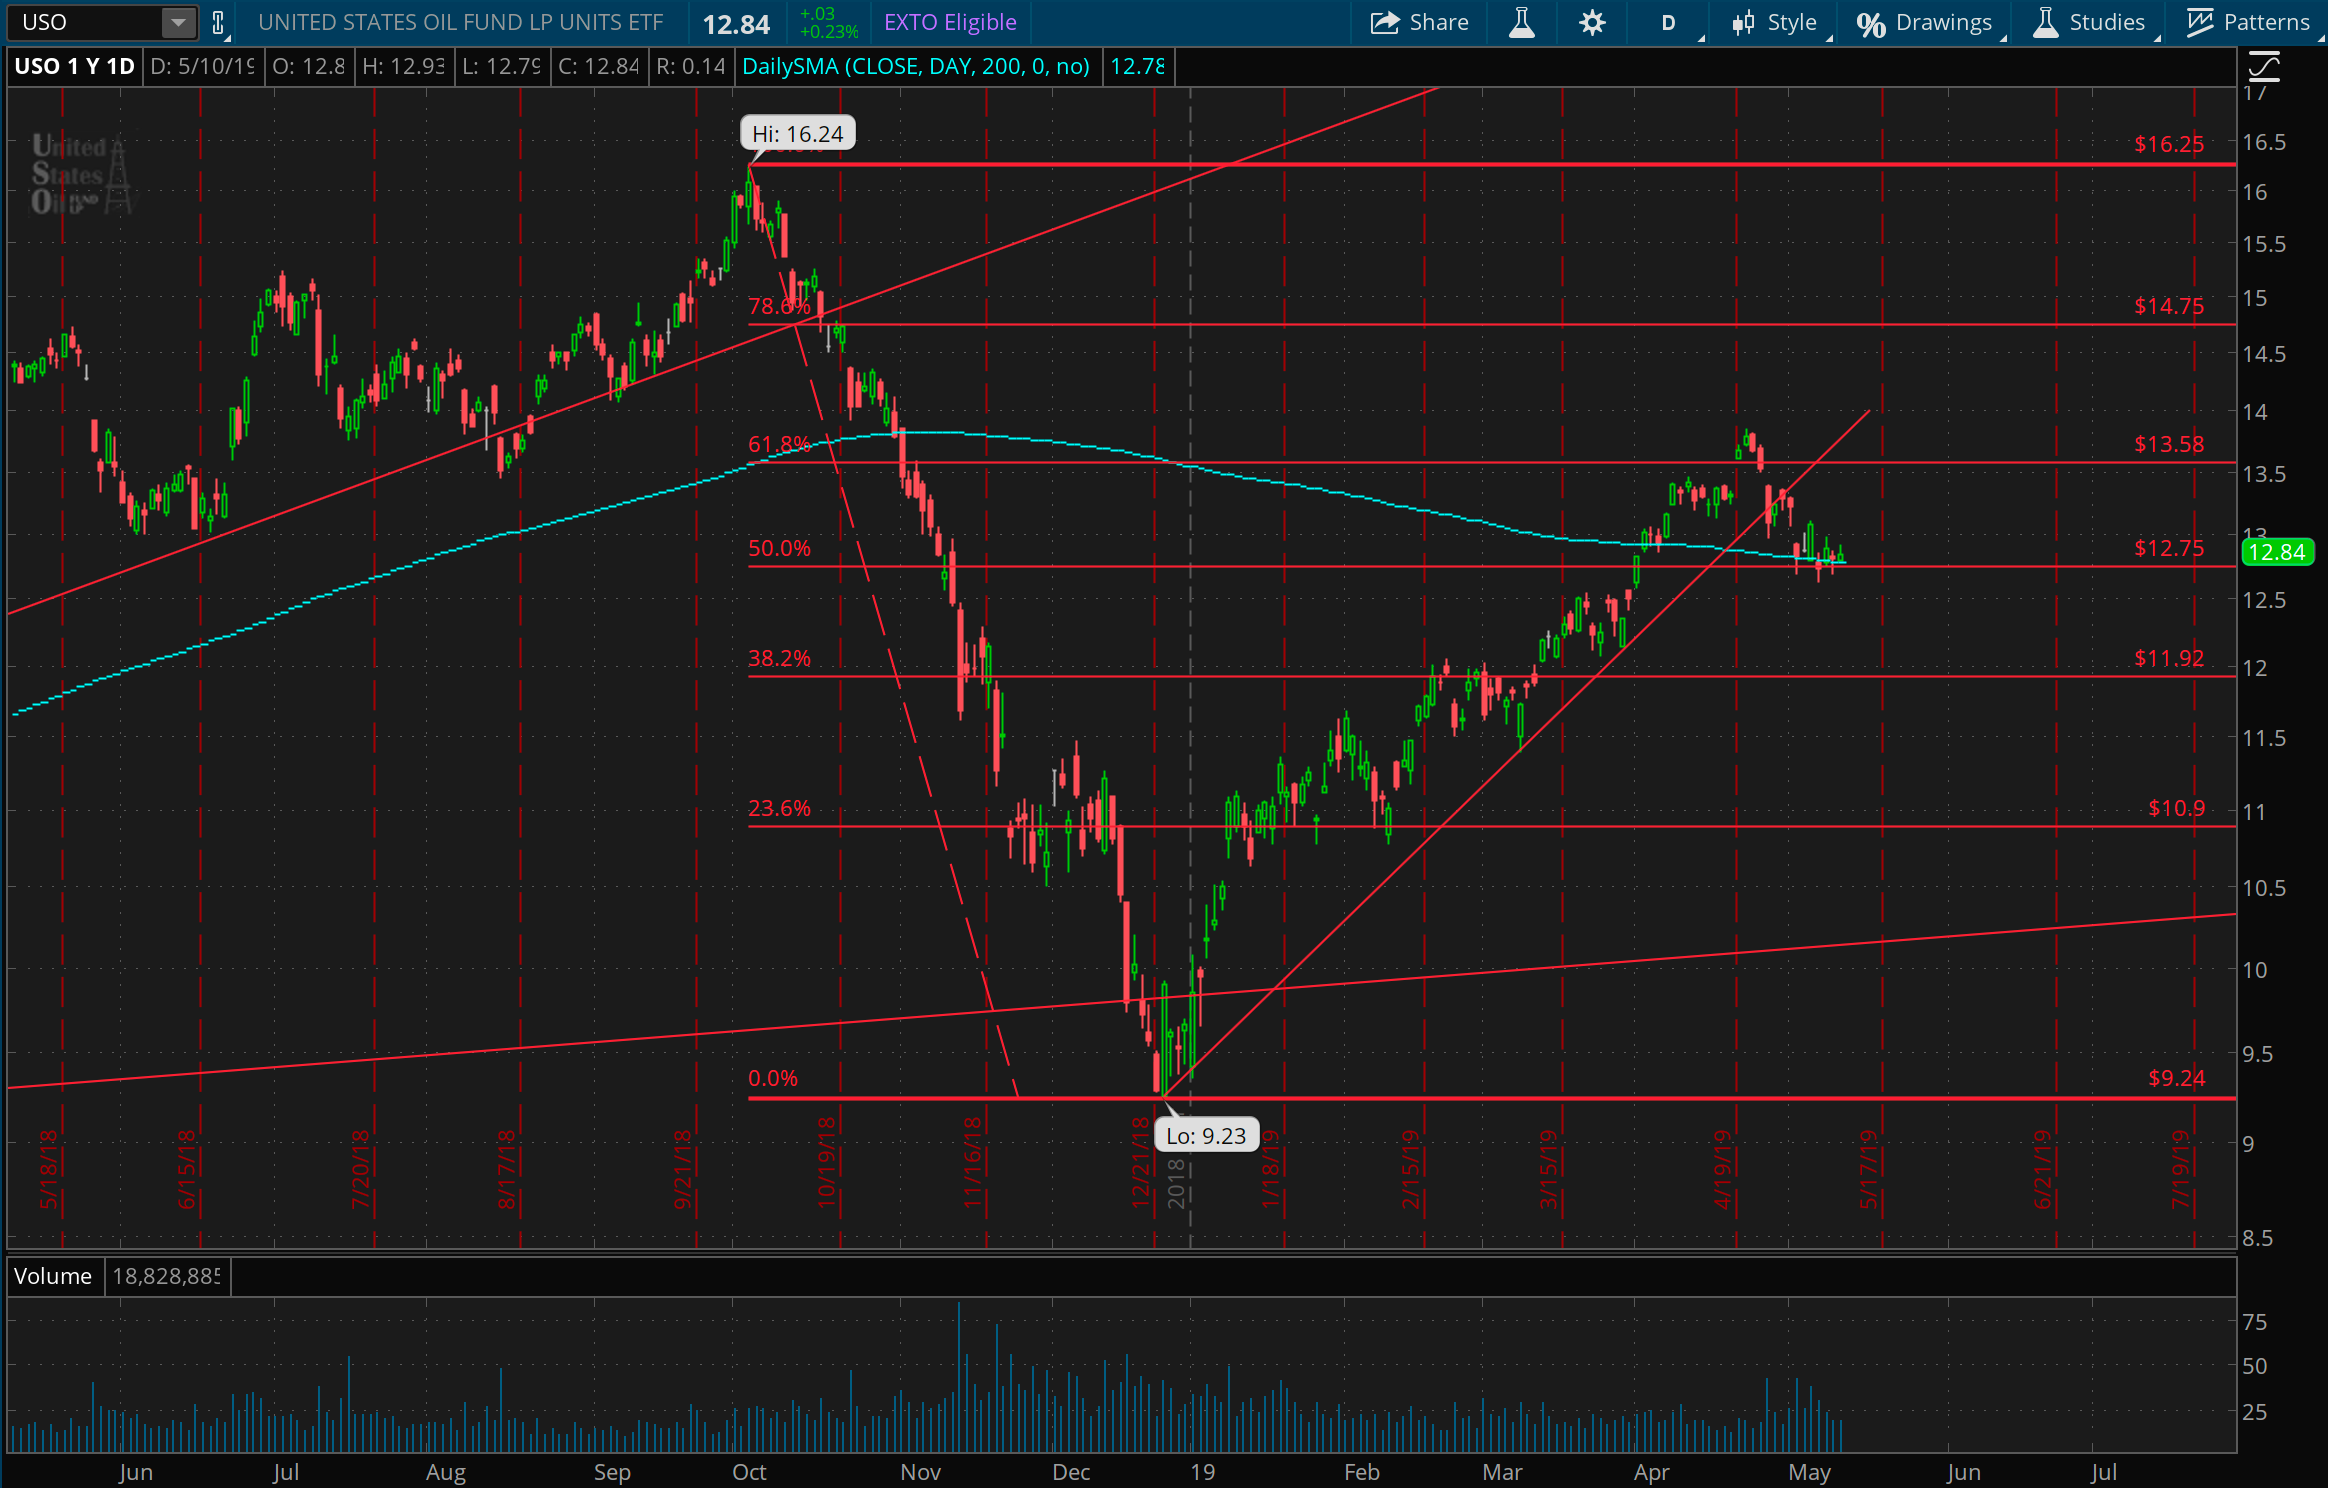
Really fascinating place for oil prices here, right at the mid point between the high from Oct 2018 to the low point after a massive and harrowing straight line fall of over 30% down to 9.23. At this point it feels likely to want to hang around this level and its 200 day moving average, and I’m looking at the 12 and 14 levels for some possible range going forward over the next few weeks.
Oh, CAT
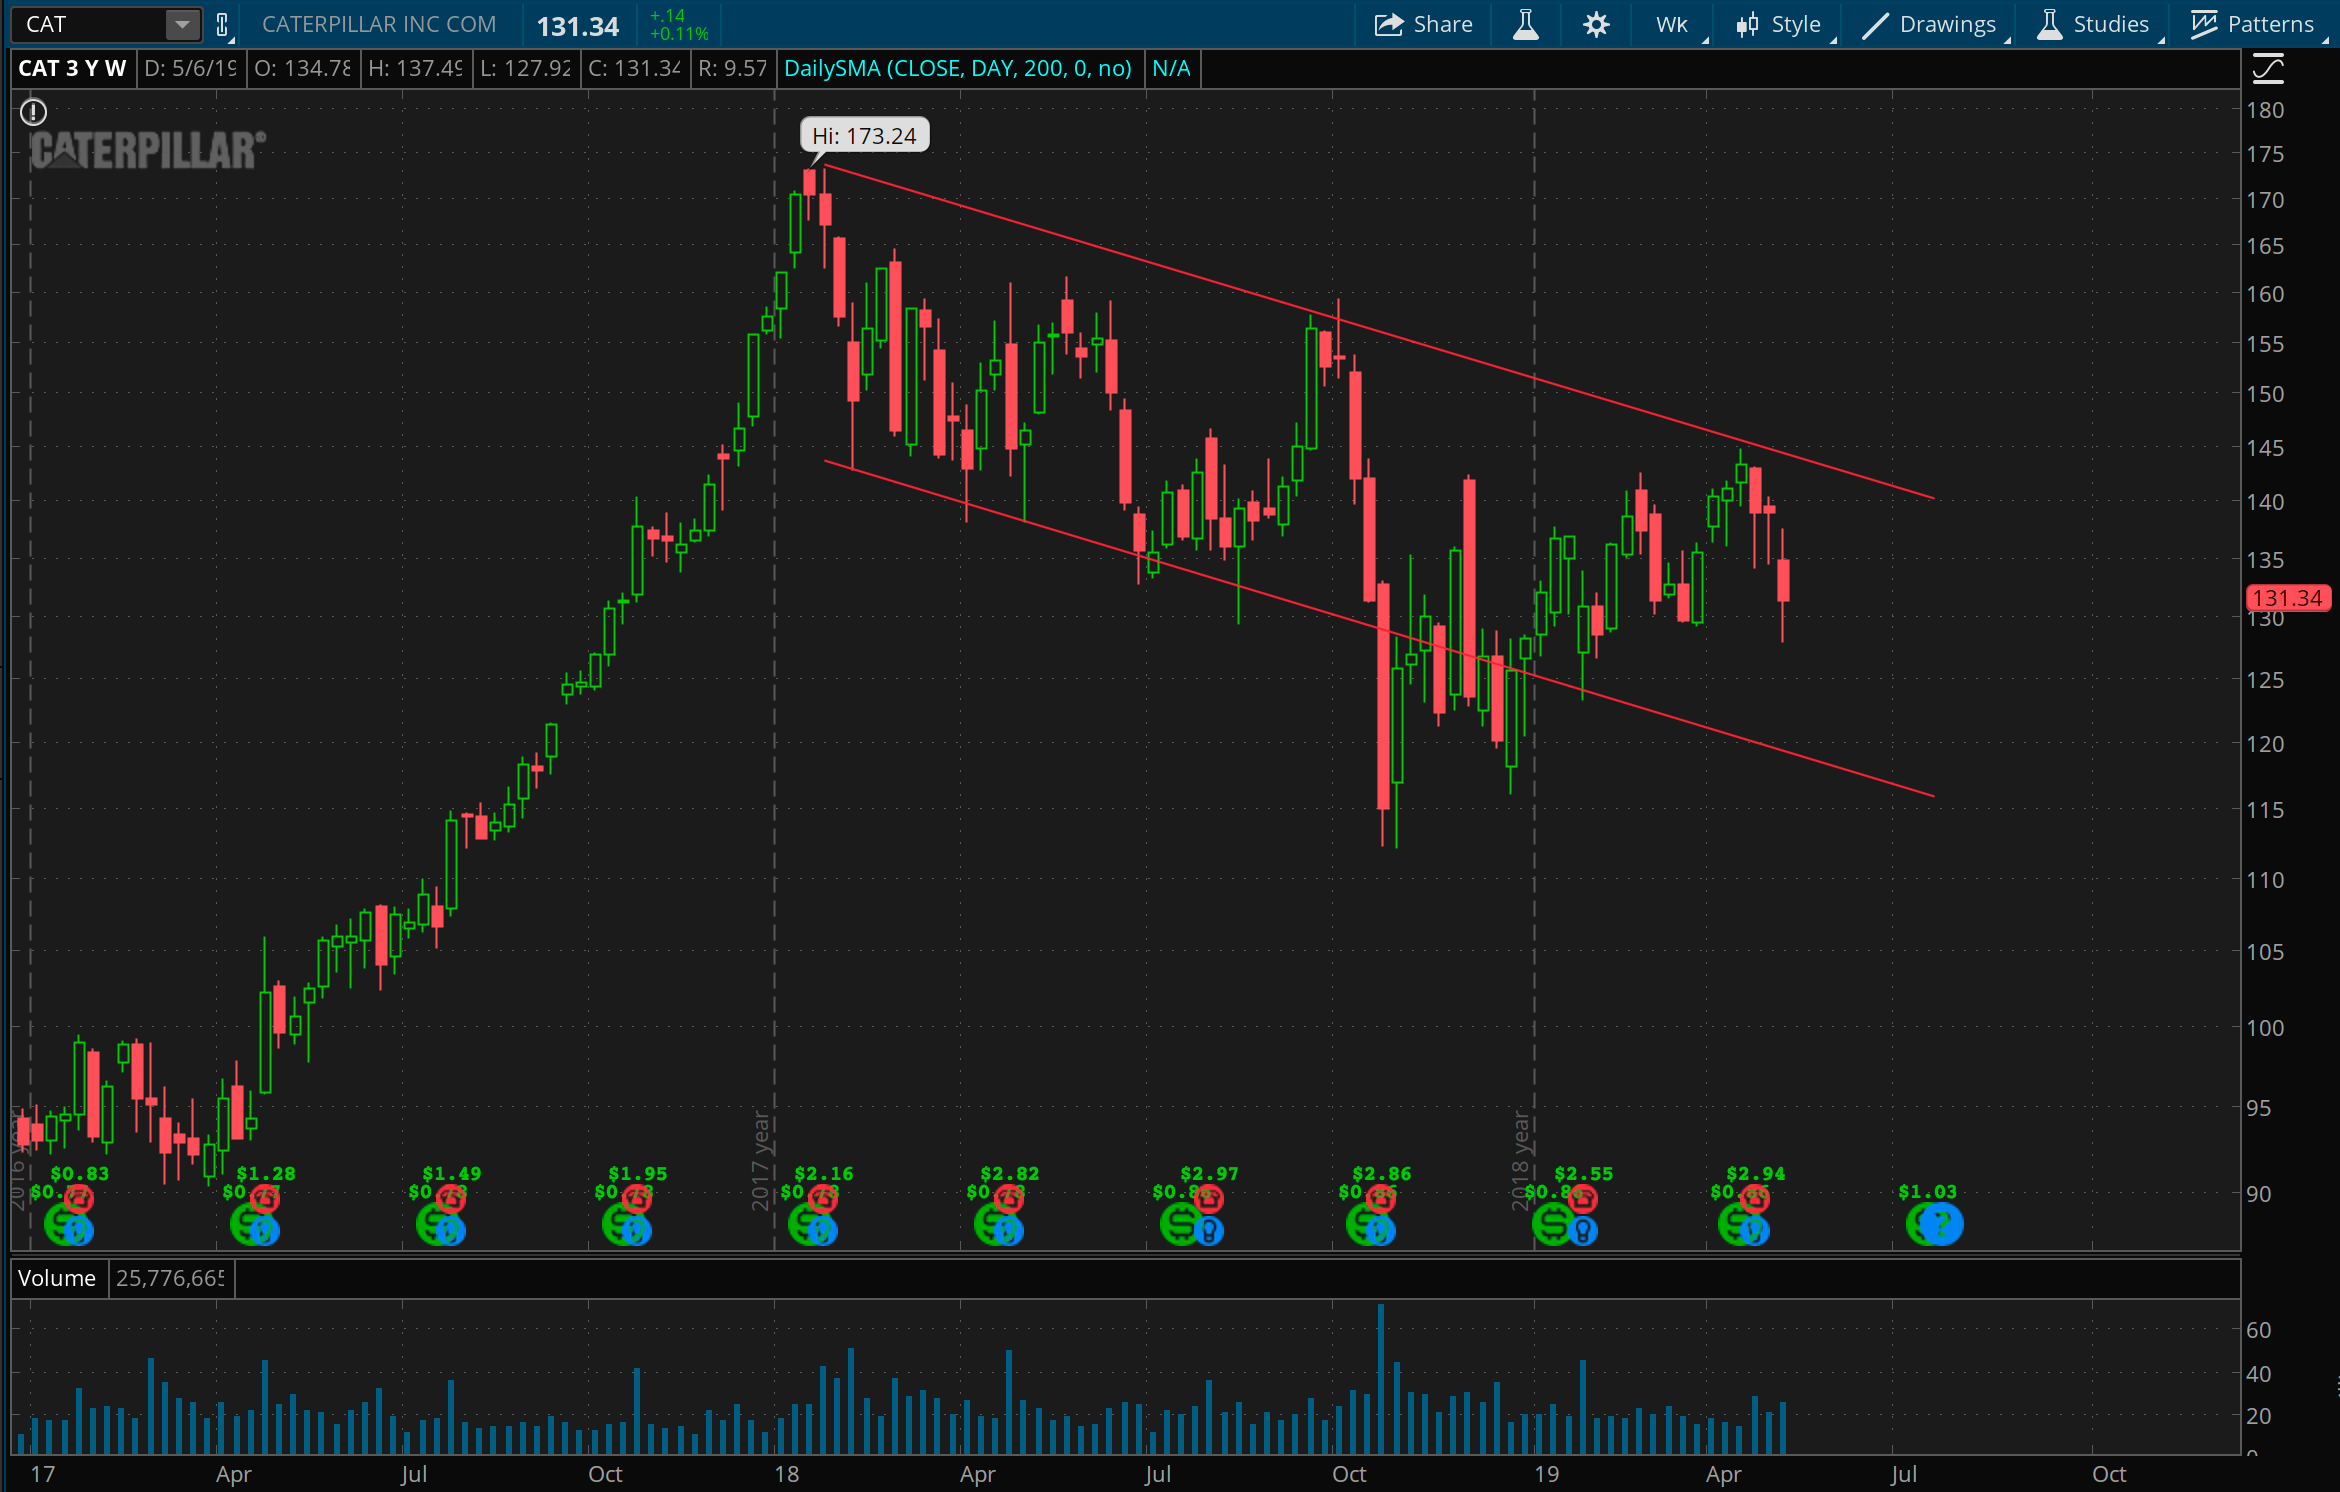
This last chart is just a compelling view at the downward channel CAT has been in for almost 18 months, since the beginning of 2018. If it moves back towards the top of this channel again around 140, it feels like a decent place to get short.