
Will the market pull a muscle from this reach?
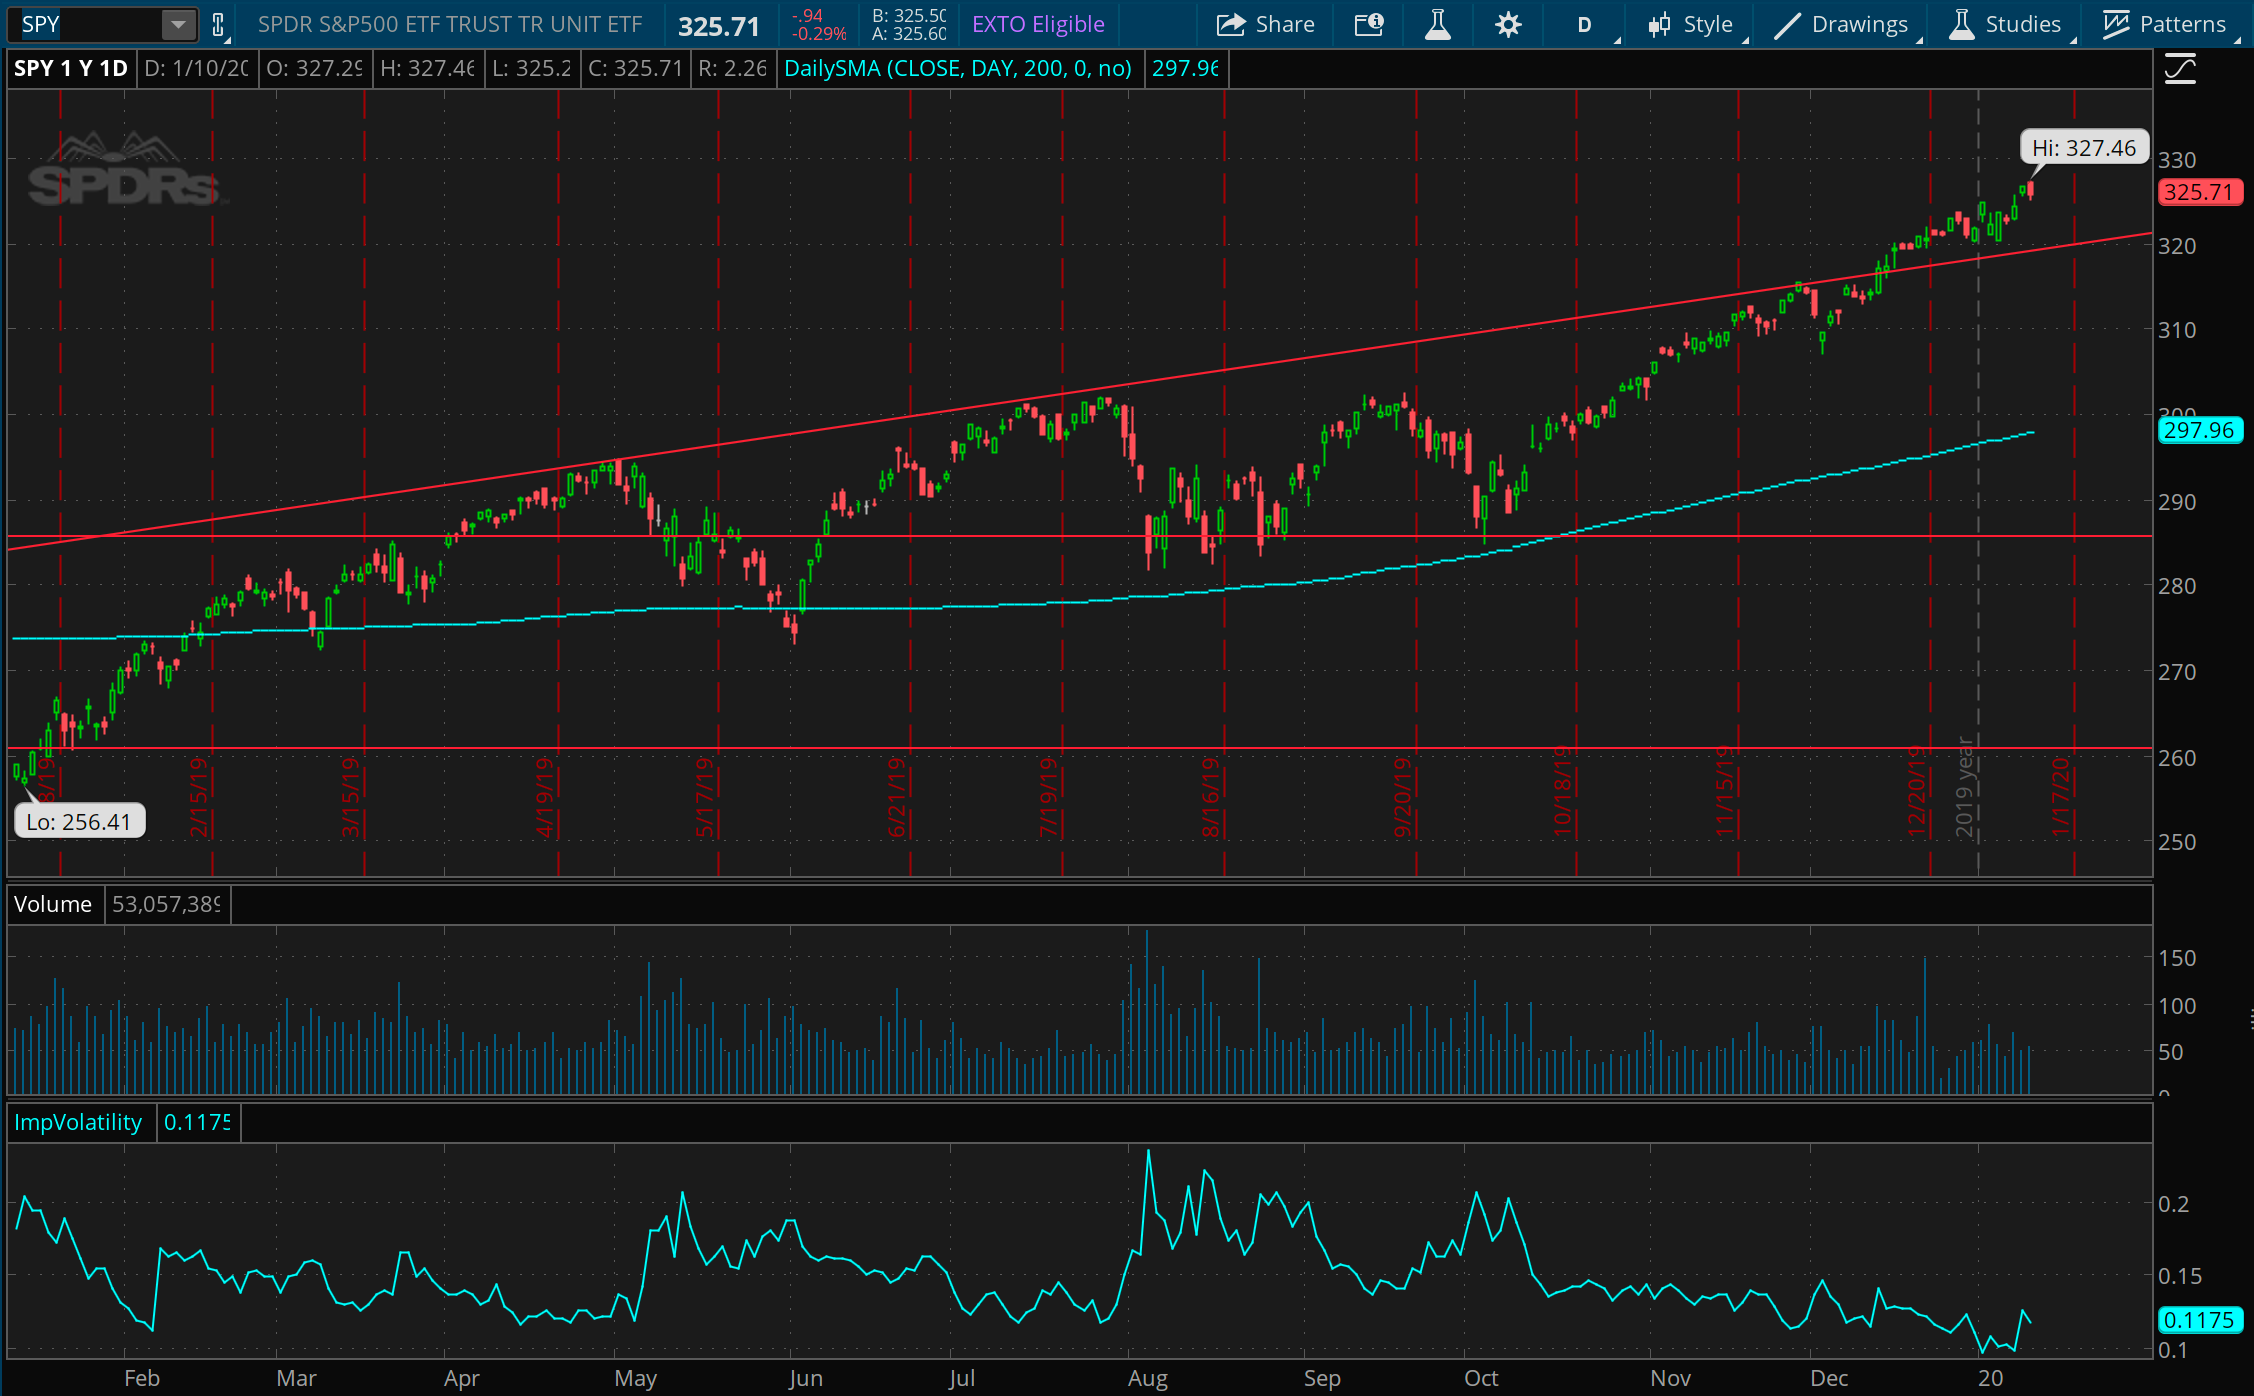
Behold, the market has reached beyond the line of upward sentiment that’s been in place all the way back from the lows of 2015. These are quite lofty heights, and in a short span, as you can see from the distance above the 200 day moving average. Clearly that type of distance was too far too fast in 2018, and we could certainly see a pull back sometime soon. There appears to be substantive support around 300 now, where the market was previously turned away back in July and September last year.
Bonds stay poised
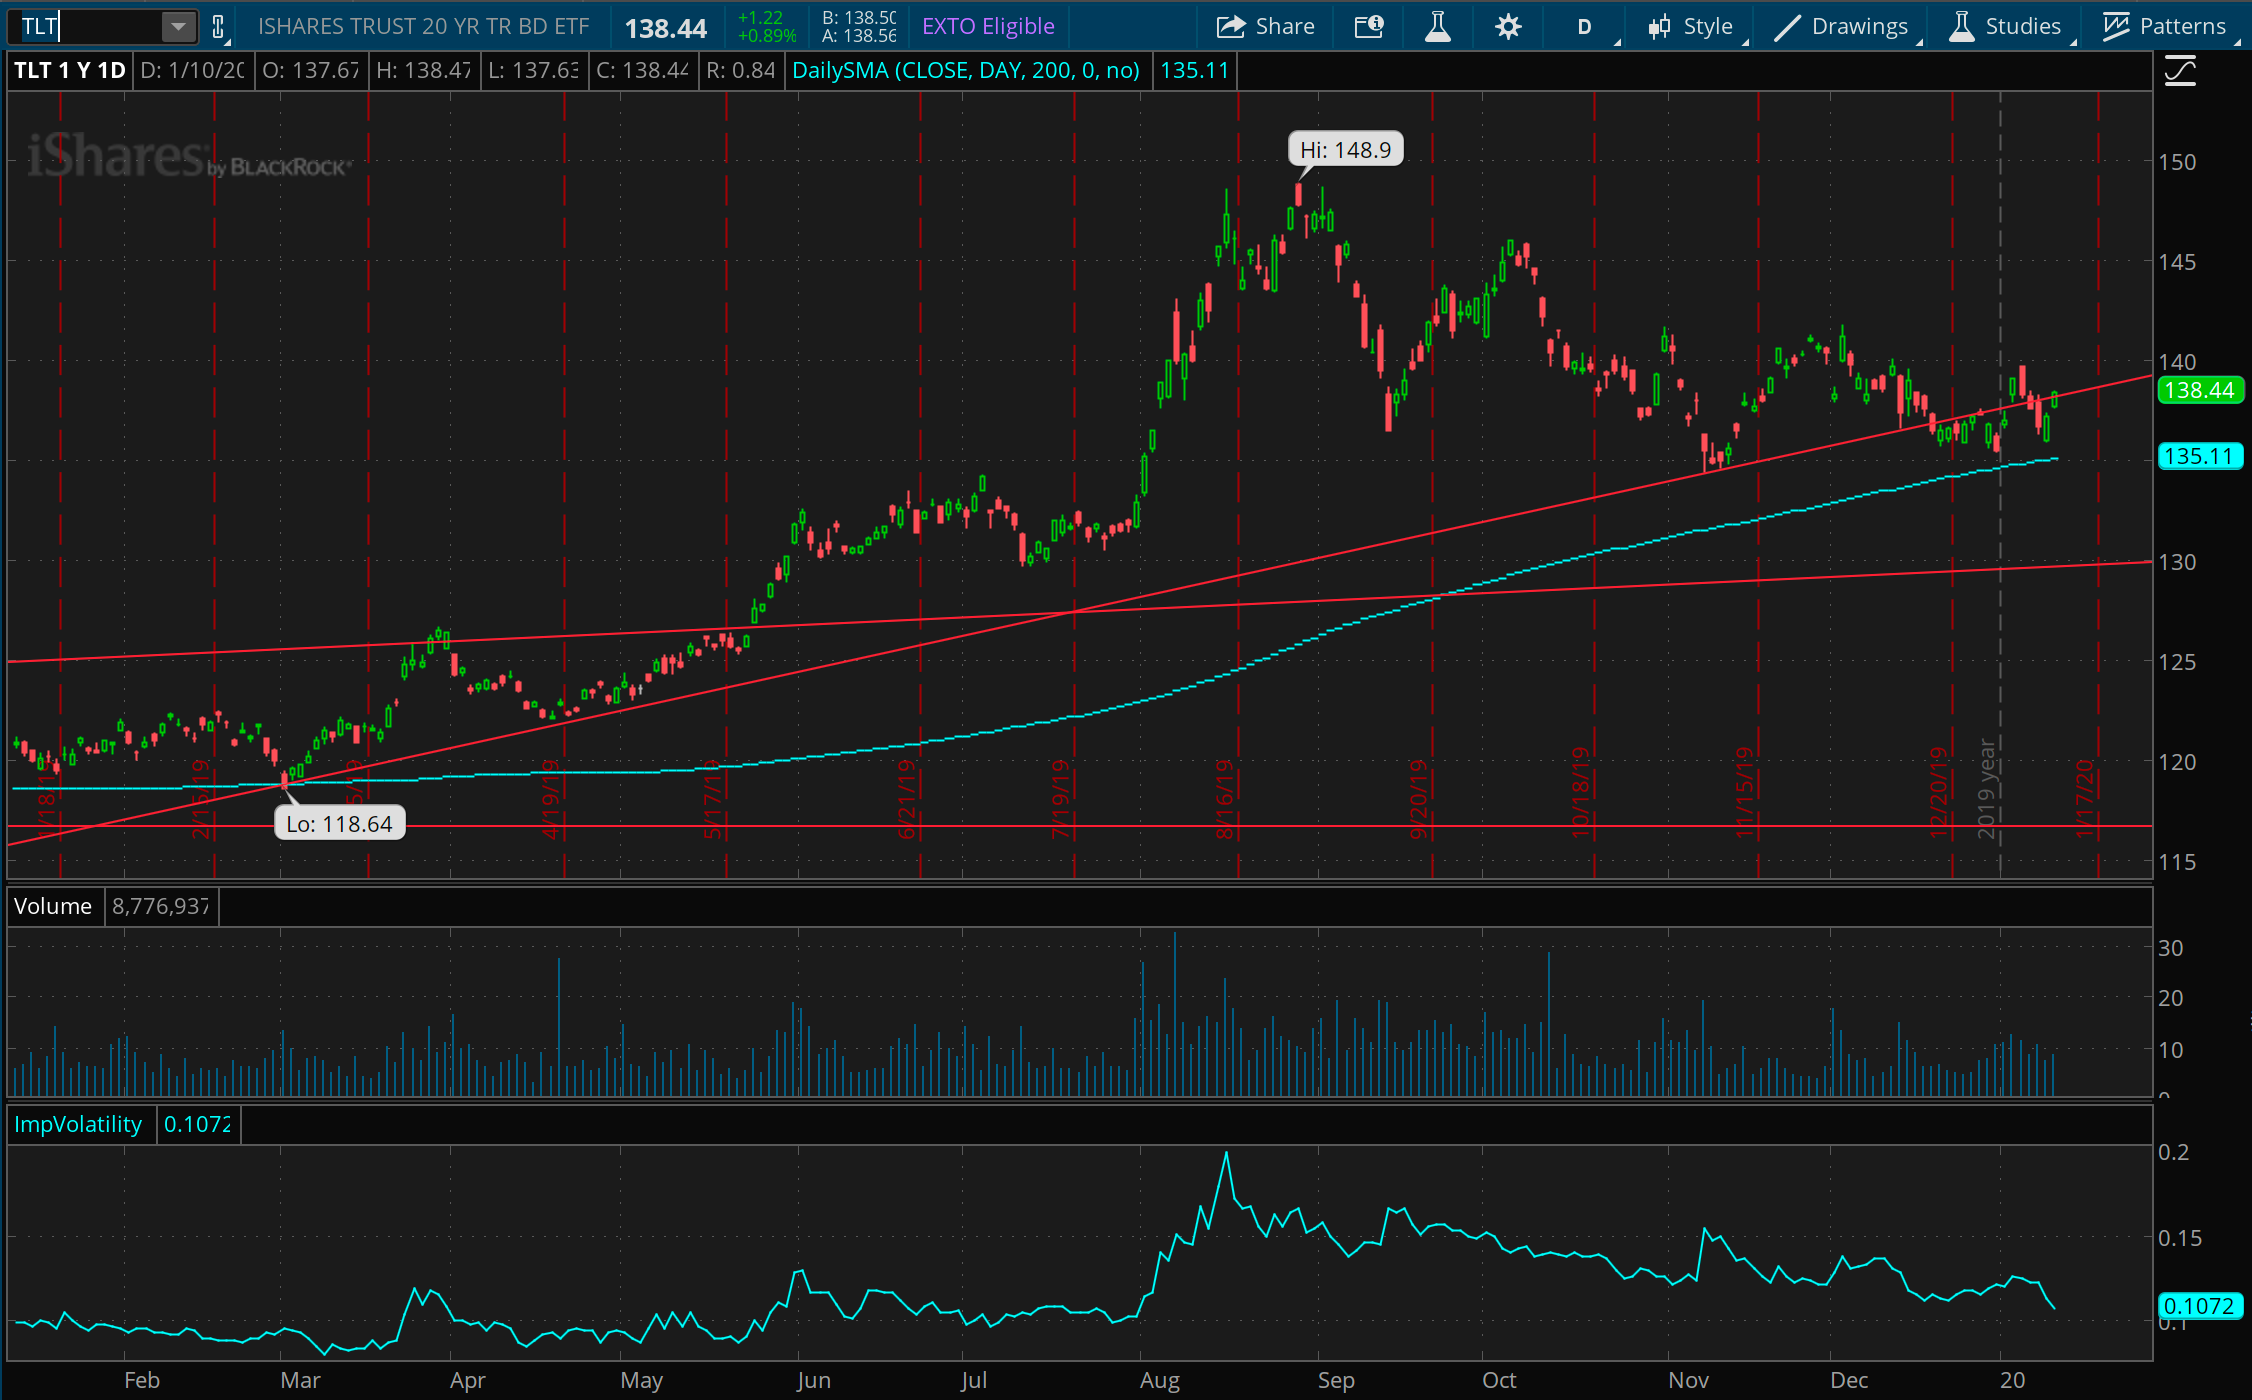
After a pretty dramatic spike during 2018, TLT is back to normal levels for its current multi-year trend. Between the 200 day moving average, the current long-term price trend, and the number of times price has bounced up or down from this level, I think 135 represents a bit of a line in the sand for TLT at this moment, and should serve as support until its breached. It’s arguable that this continued support in TLT represents an ongoing nervousness in the market, as it seems ready to bounce on any drop in equities.
Gold support
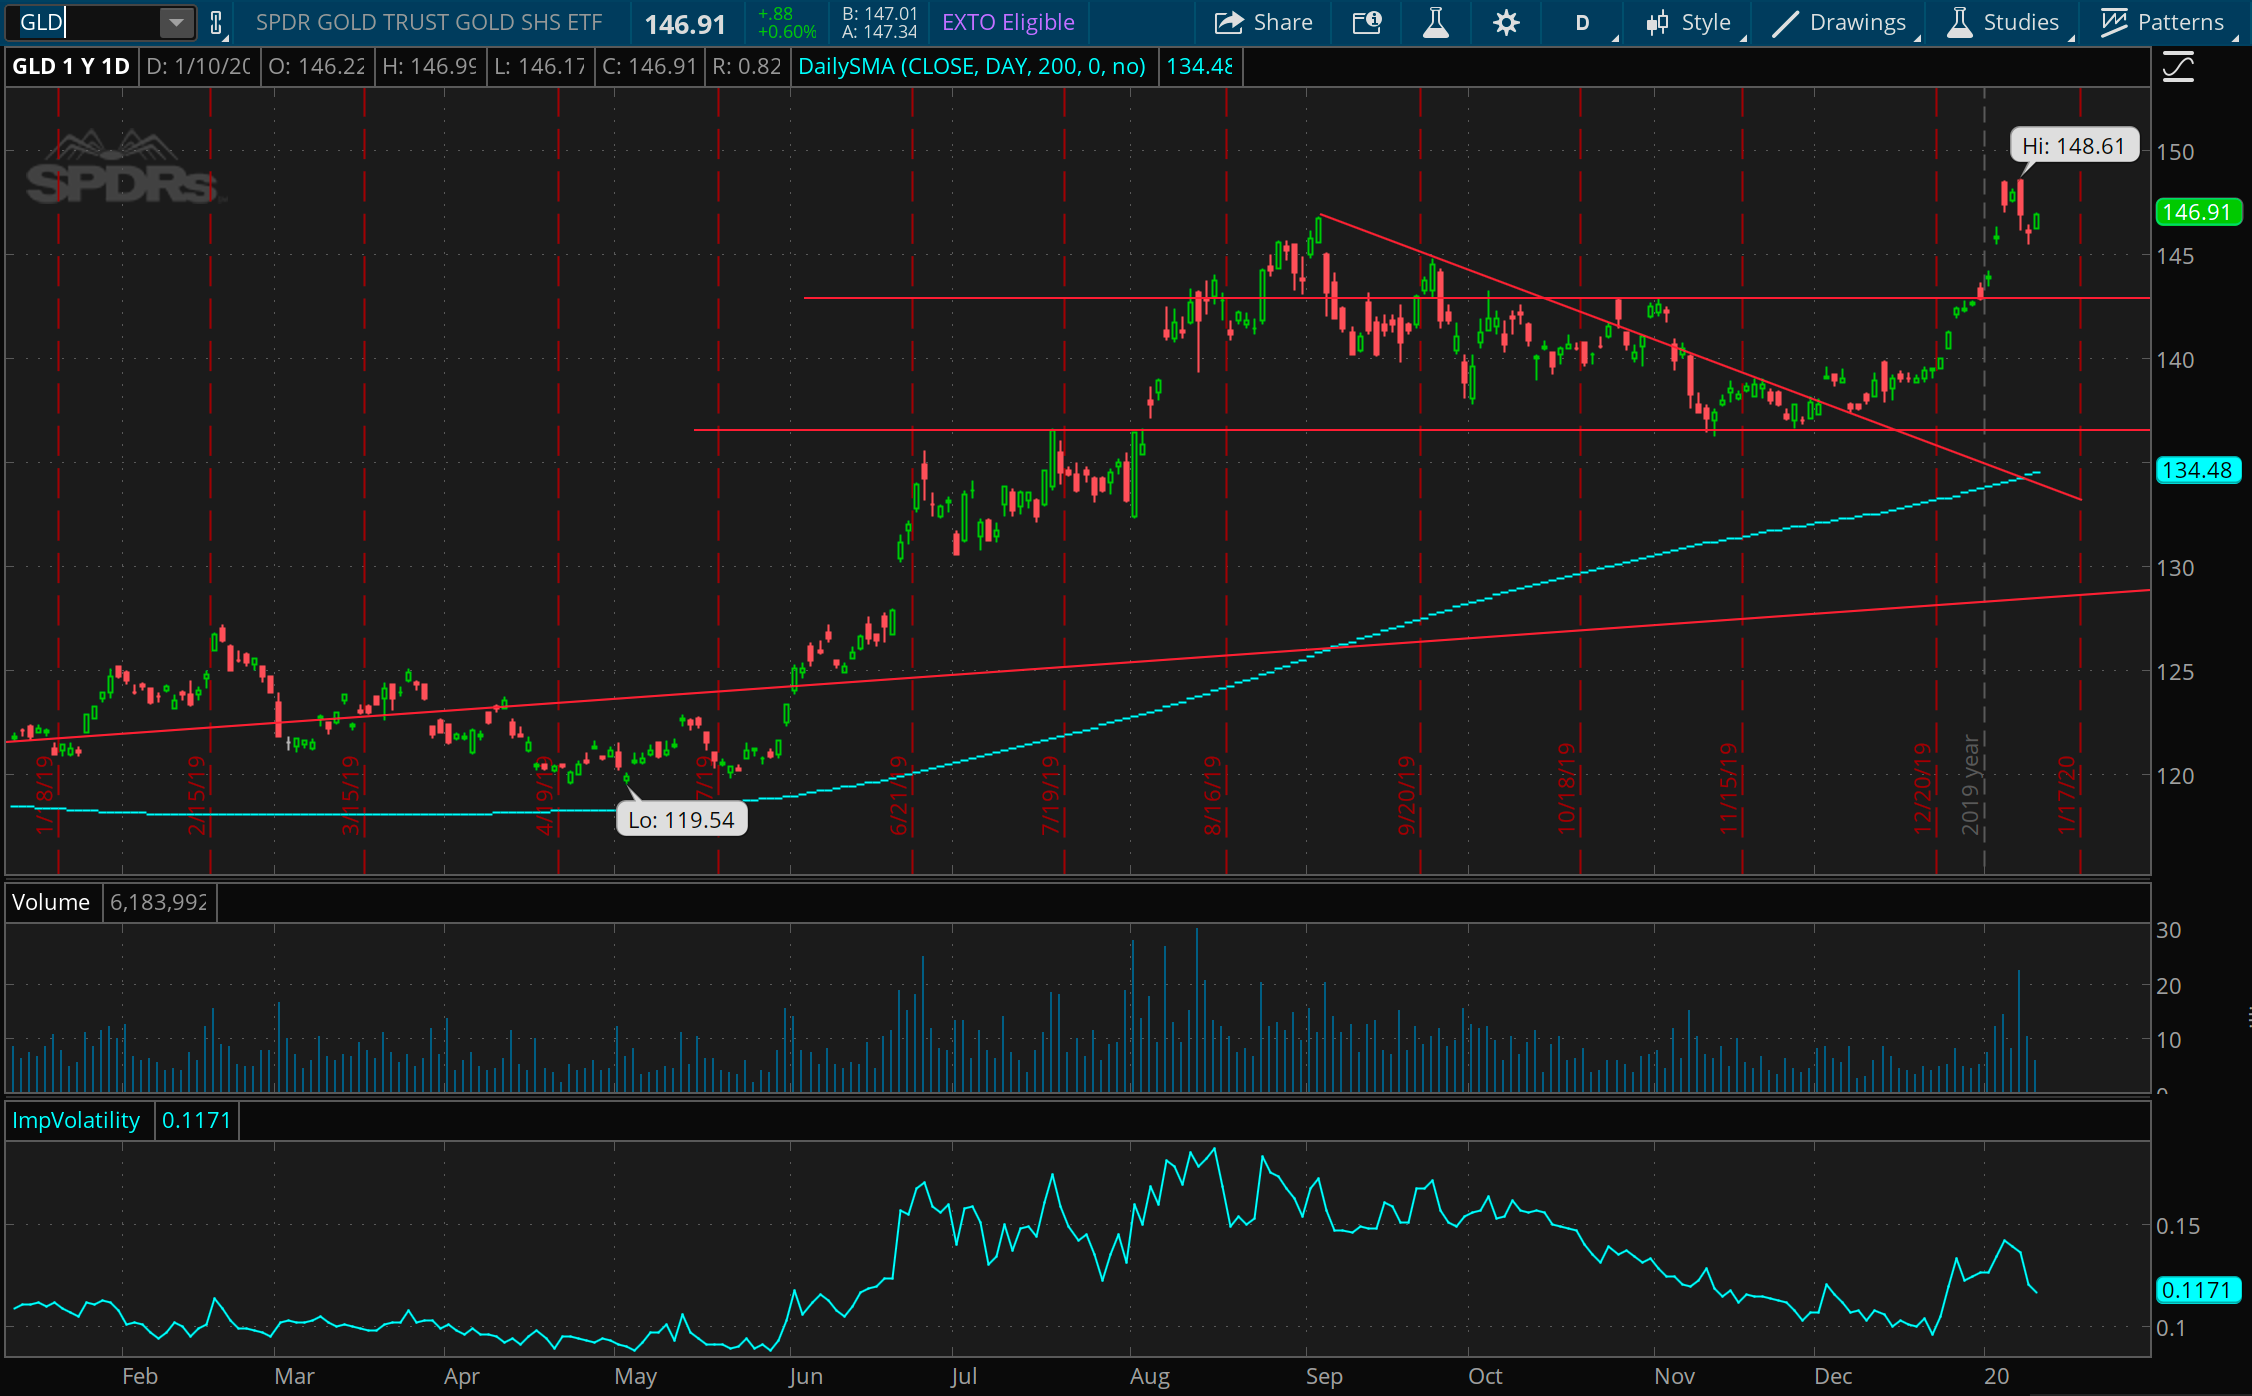
Gold also experienced a major rise during last year’s choppy summer session in the market. And while it participated in the same slow decline as bonds, the fall has been a bit more muted, and has spiked over 5% during the past 3 weeks. I’m particularly interested in this move right now, as it either is signaling a nervous market already hedging into this safe haven asset, or else signaling a growing expectation of inflation. At any rate, we haven’t risen into these levels in gold since 2011.
Oil, the real two sided market
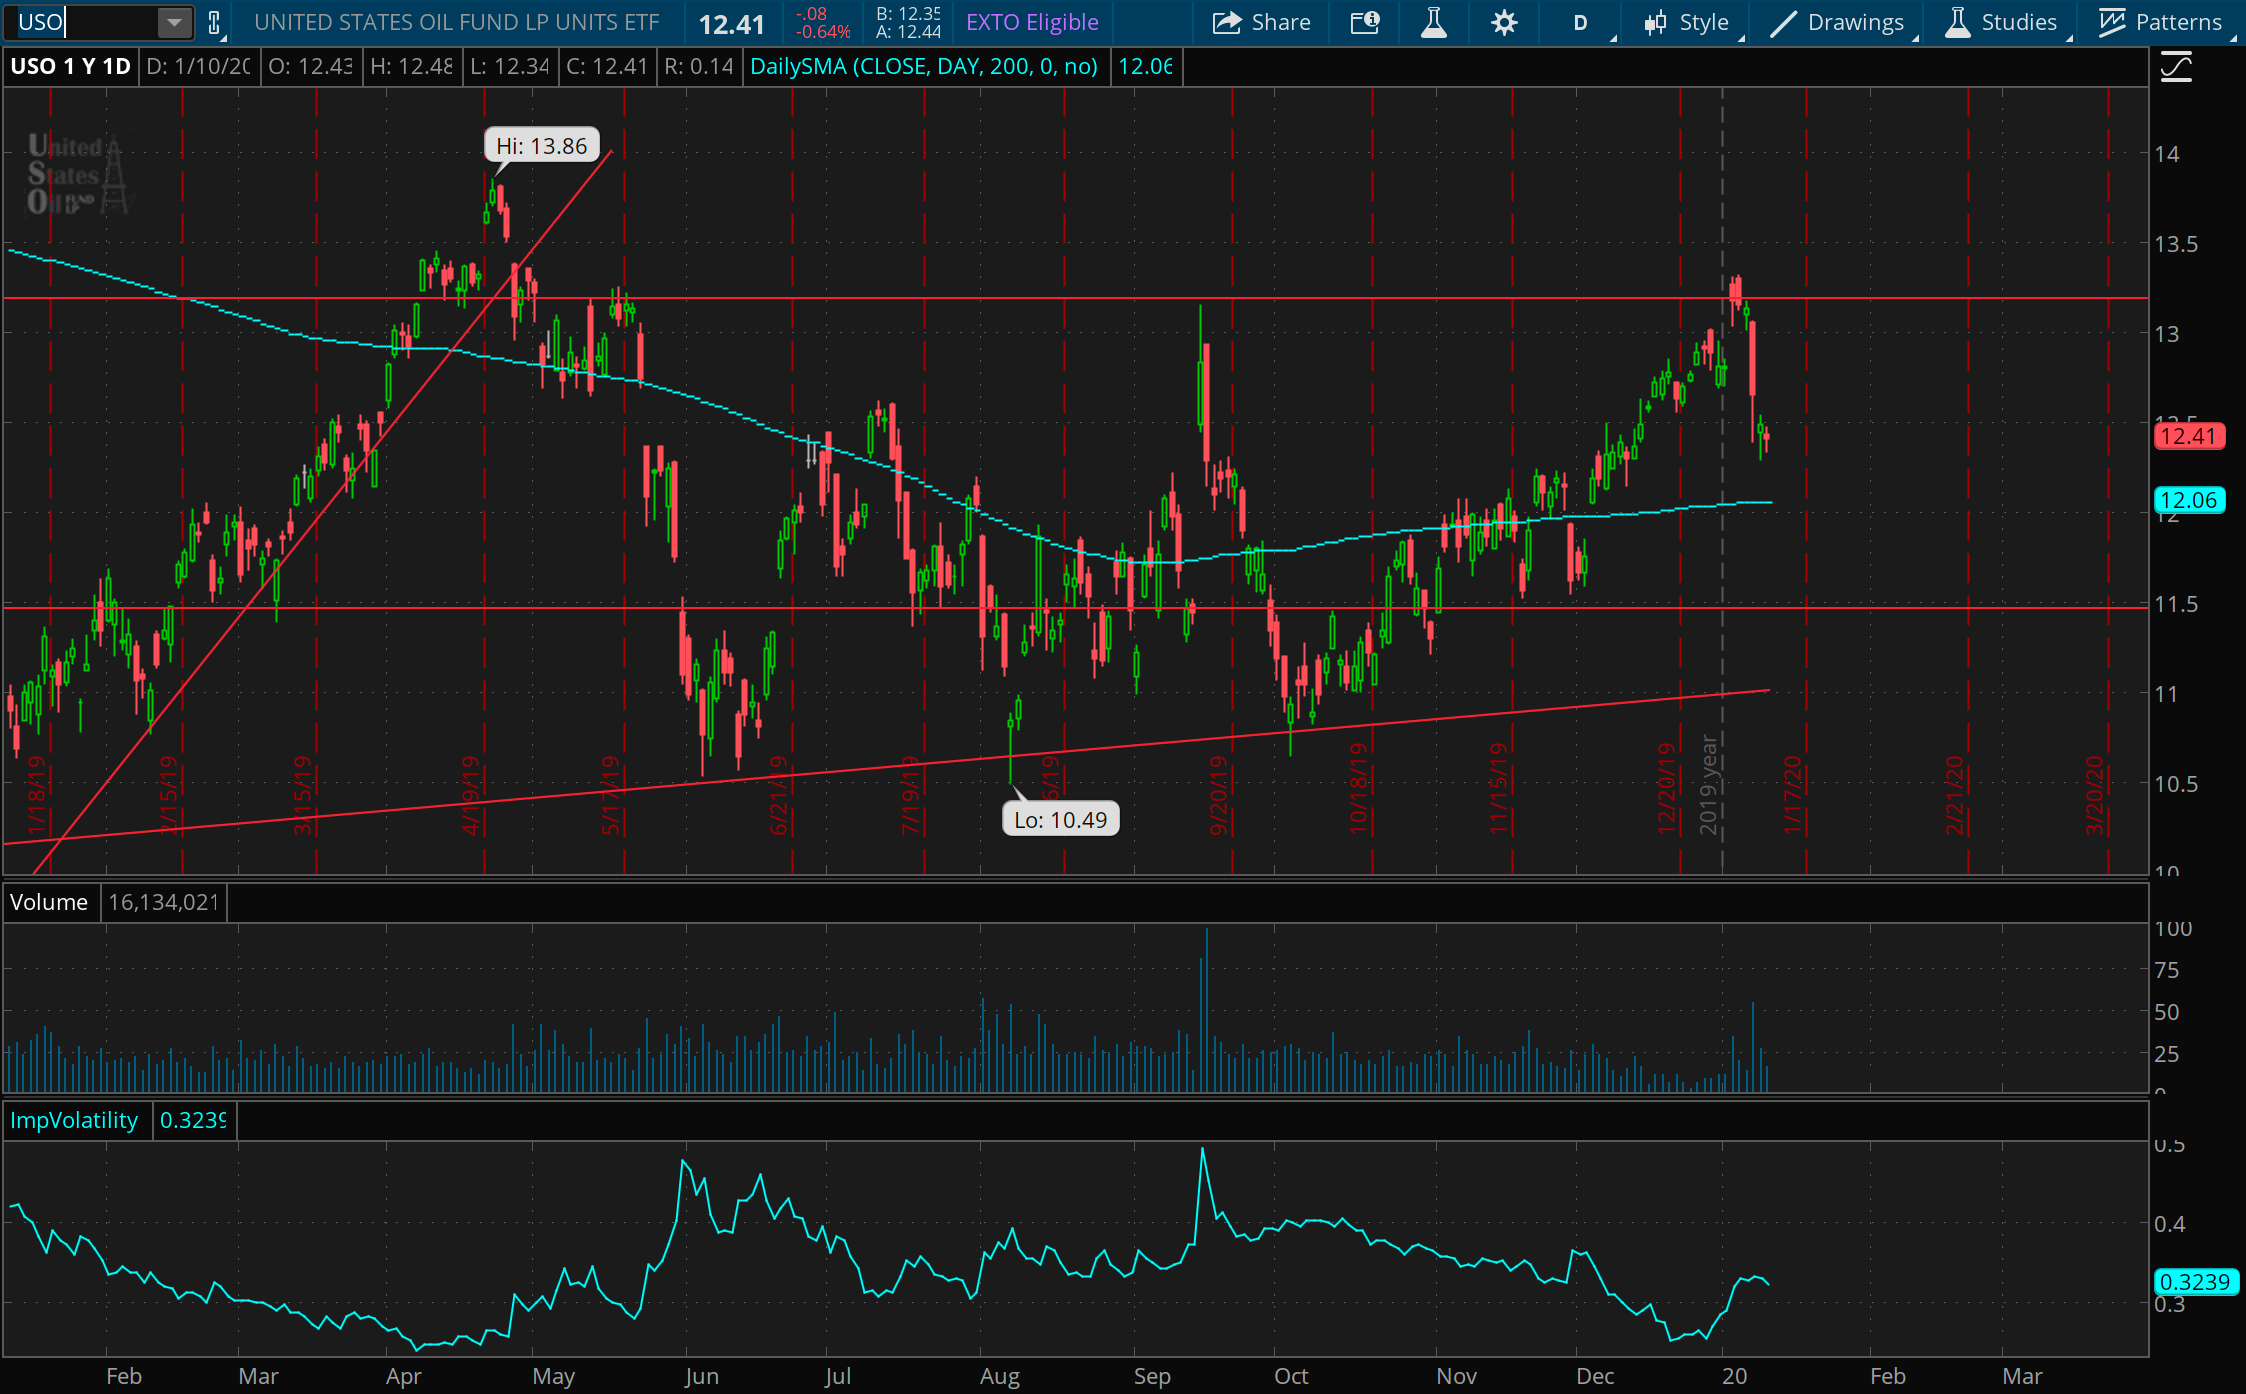
Oil appears to be the true two sided market out there right now, as it continues to bounce around in a range that’s been in place for over a year. There is no doubt that 13.25 in USO is a meaningful place of resistance for prices. This was originally put in place by an unexpected and dramatic fall back in May of 2019, and it feels like buyers who were caught long at those prices are still unwinding those positions today as they cut off the trade at a scratch. Honestly this action feels like another sign that the economic optimism starting back in October might be tiring.
Speaking of optimism…
Speaking of optimism, look at these two charts. First AAPL
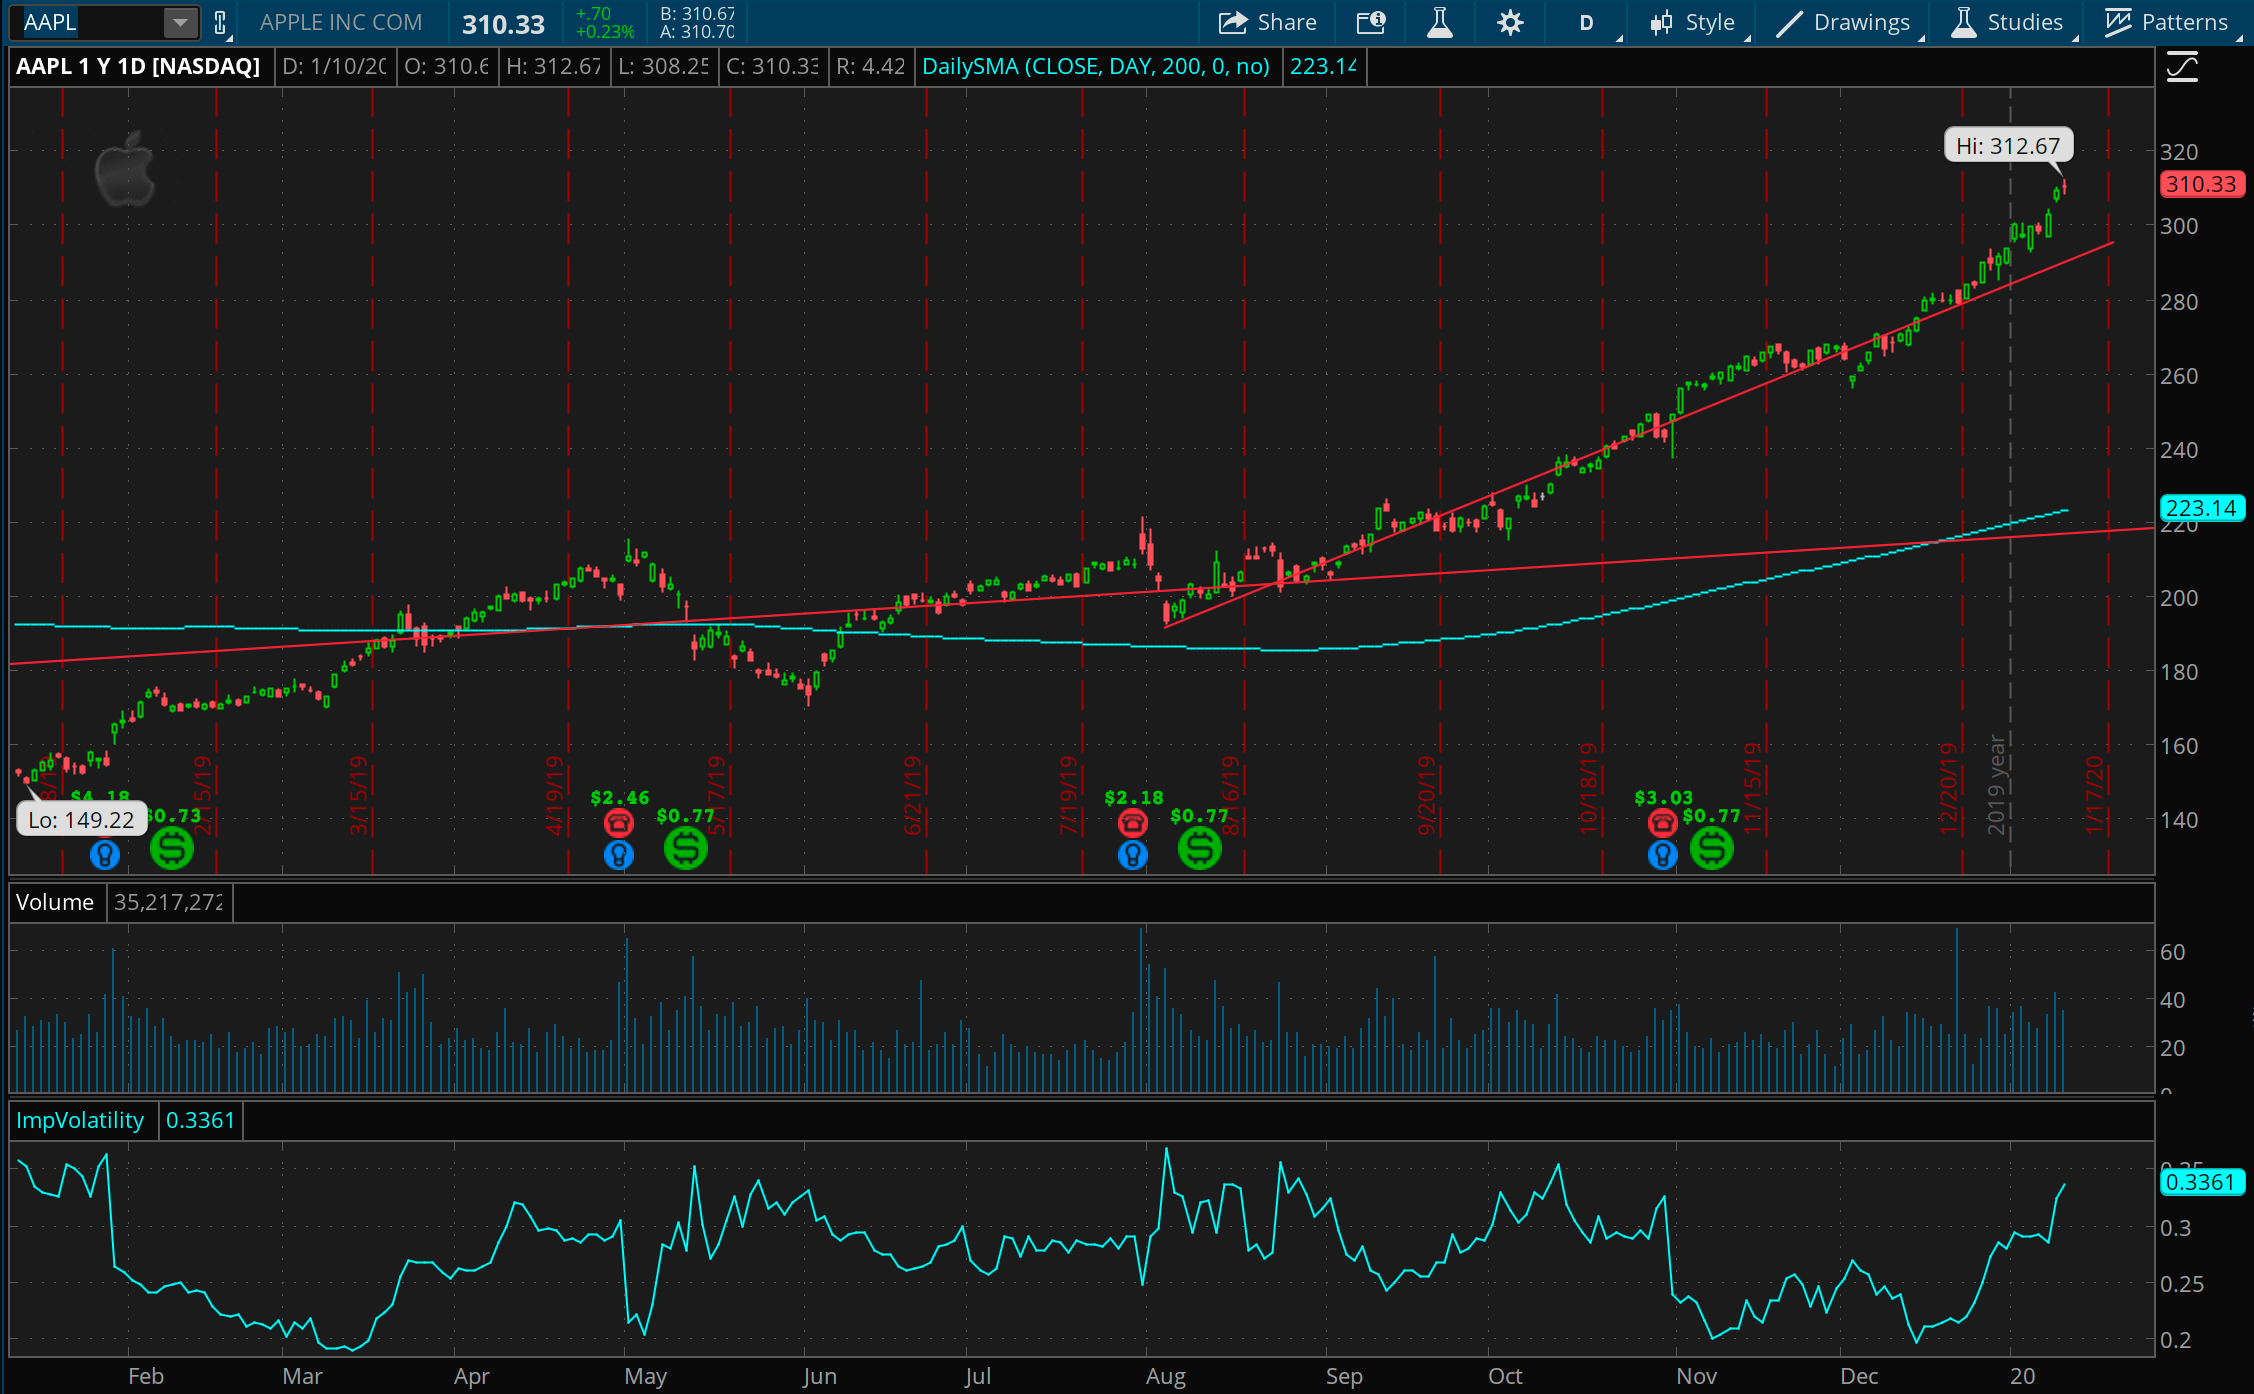
It’s been an incredible, consistent, and relentless path upward for Apple ever since June of last year. Since those lows, in just seven and a half months, it’s risen around 82%. It has nearly doubled. And the question is: is it really twice the business it was seven and half months ago? This could be a good short opportunity going forward.
Now, look at TSLA
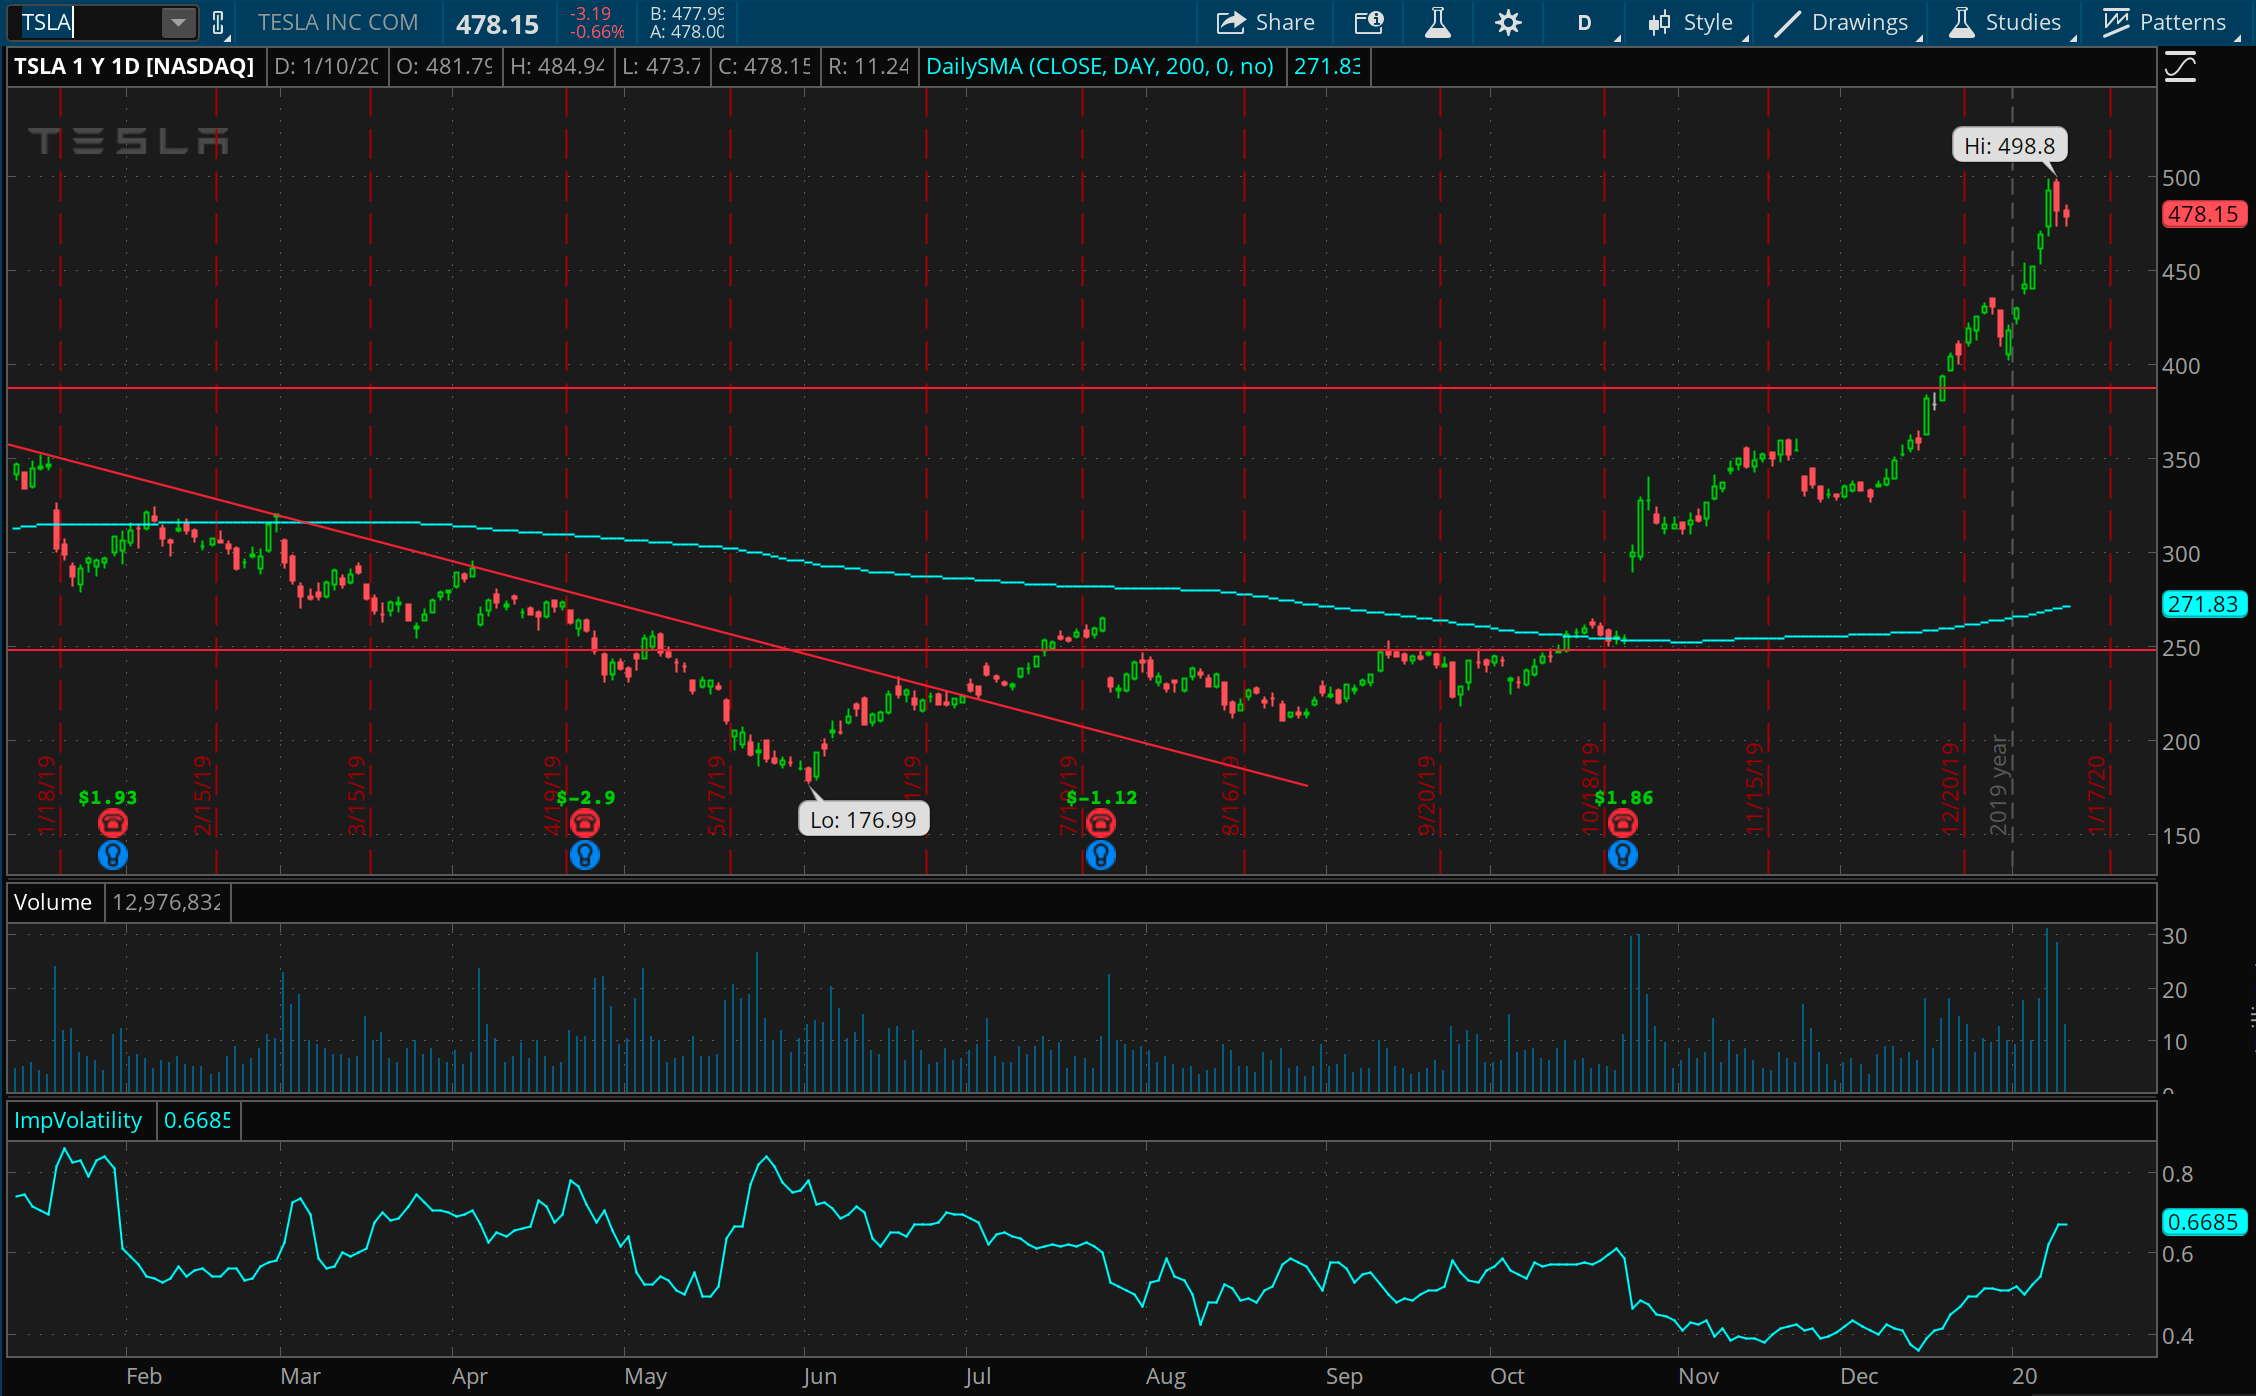
In an even shorter time span, Tesla has risen even further. It’s actually doubled since October of last year, in just three and half months. Is Tesla really twice as valuable as it was? This looks much more like a short squeeze to me, for a stock that is notoriously shorted. I could easily see this unwind back down to 400 in a hurry.
The chart of the week
I watch the market, the prices, and the trends. Sometimes the economics. Rarely the news. But this week’s chart of the week comes from Bloomberg’s market wrap, showing a telling story of what this market might do with bad news.
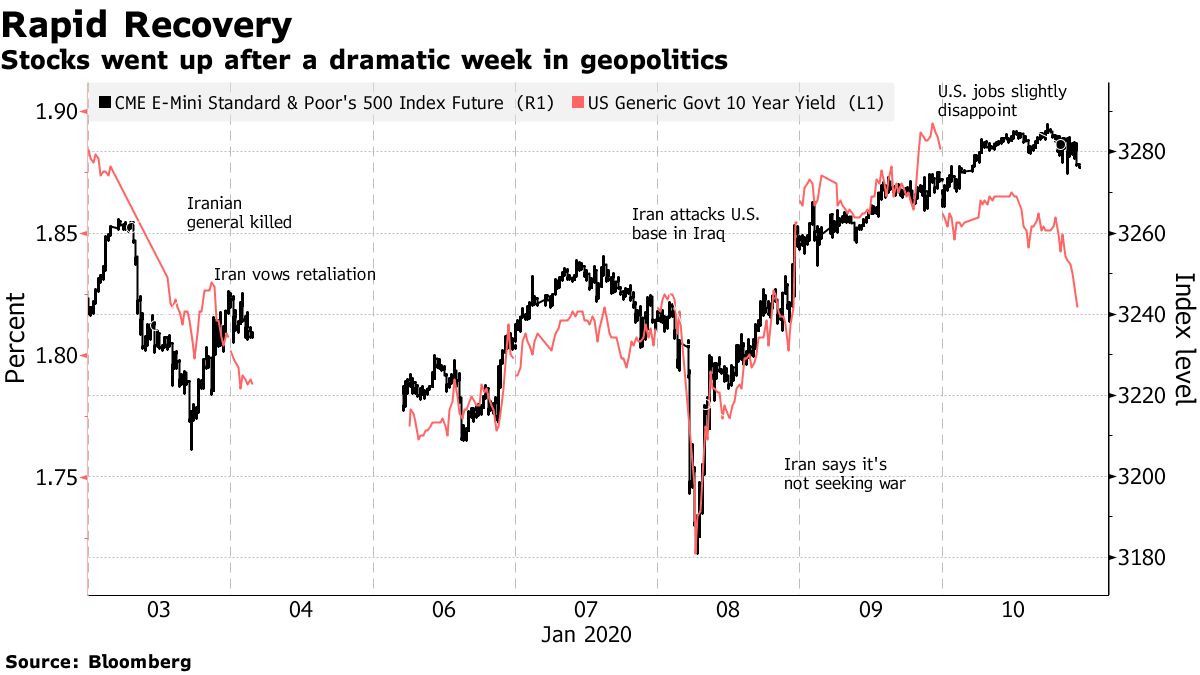
The biggest move in the market this week all happened in the overnight hours, as Iran made a strike against U.S. bases in Iraq. By the time the market opened on Wednesday morning, the whole attack was seen as symbolic and saving face, with no U.S. casualties and leading quickly to de-escalation of the confrontation. But it was a 2% drop in the matter of a few hours. In a market this outstretched, and with participants nervously aware of it, you can bet that any bad news won’t be well tolerated in this market.