SPY deflection
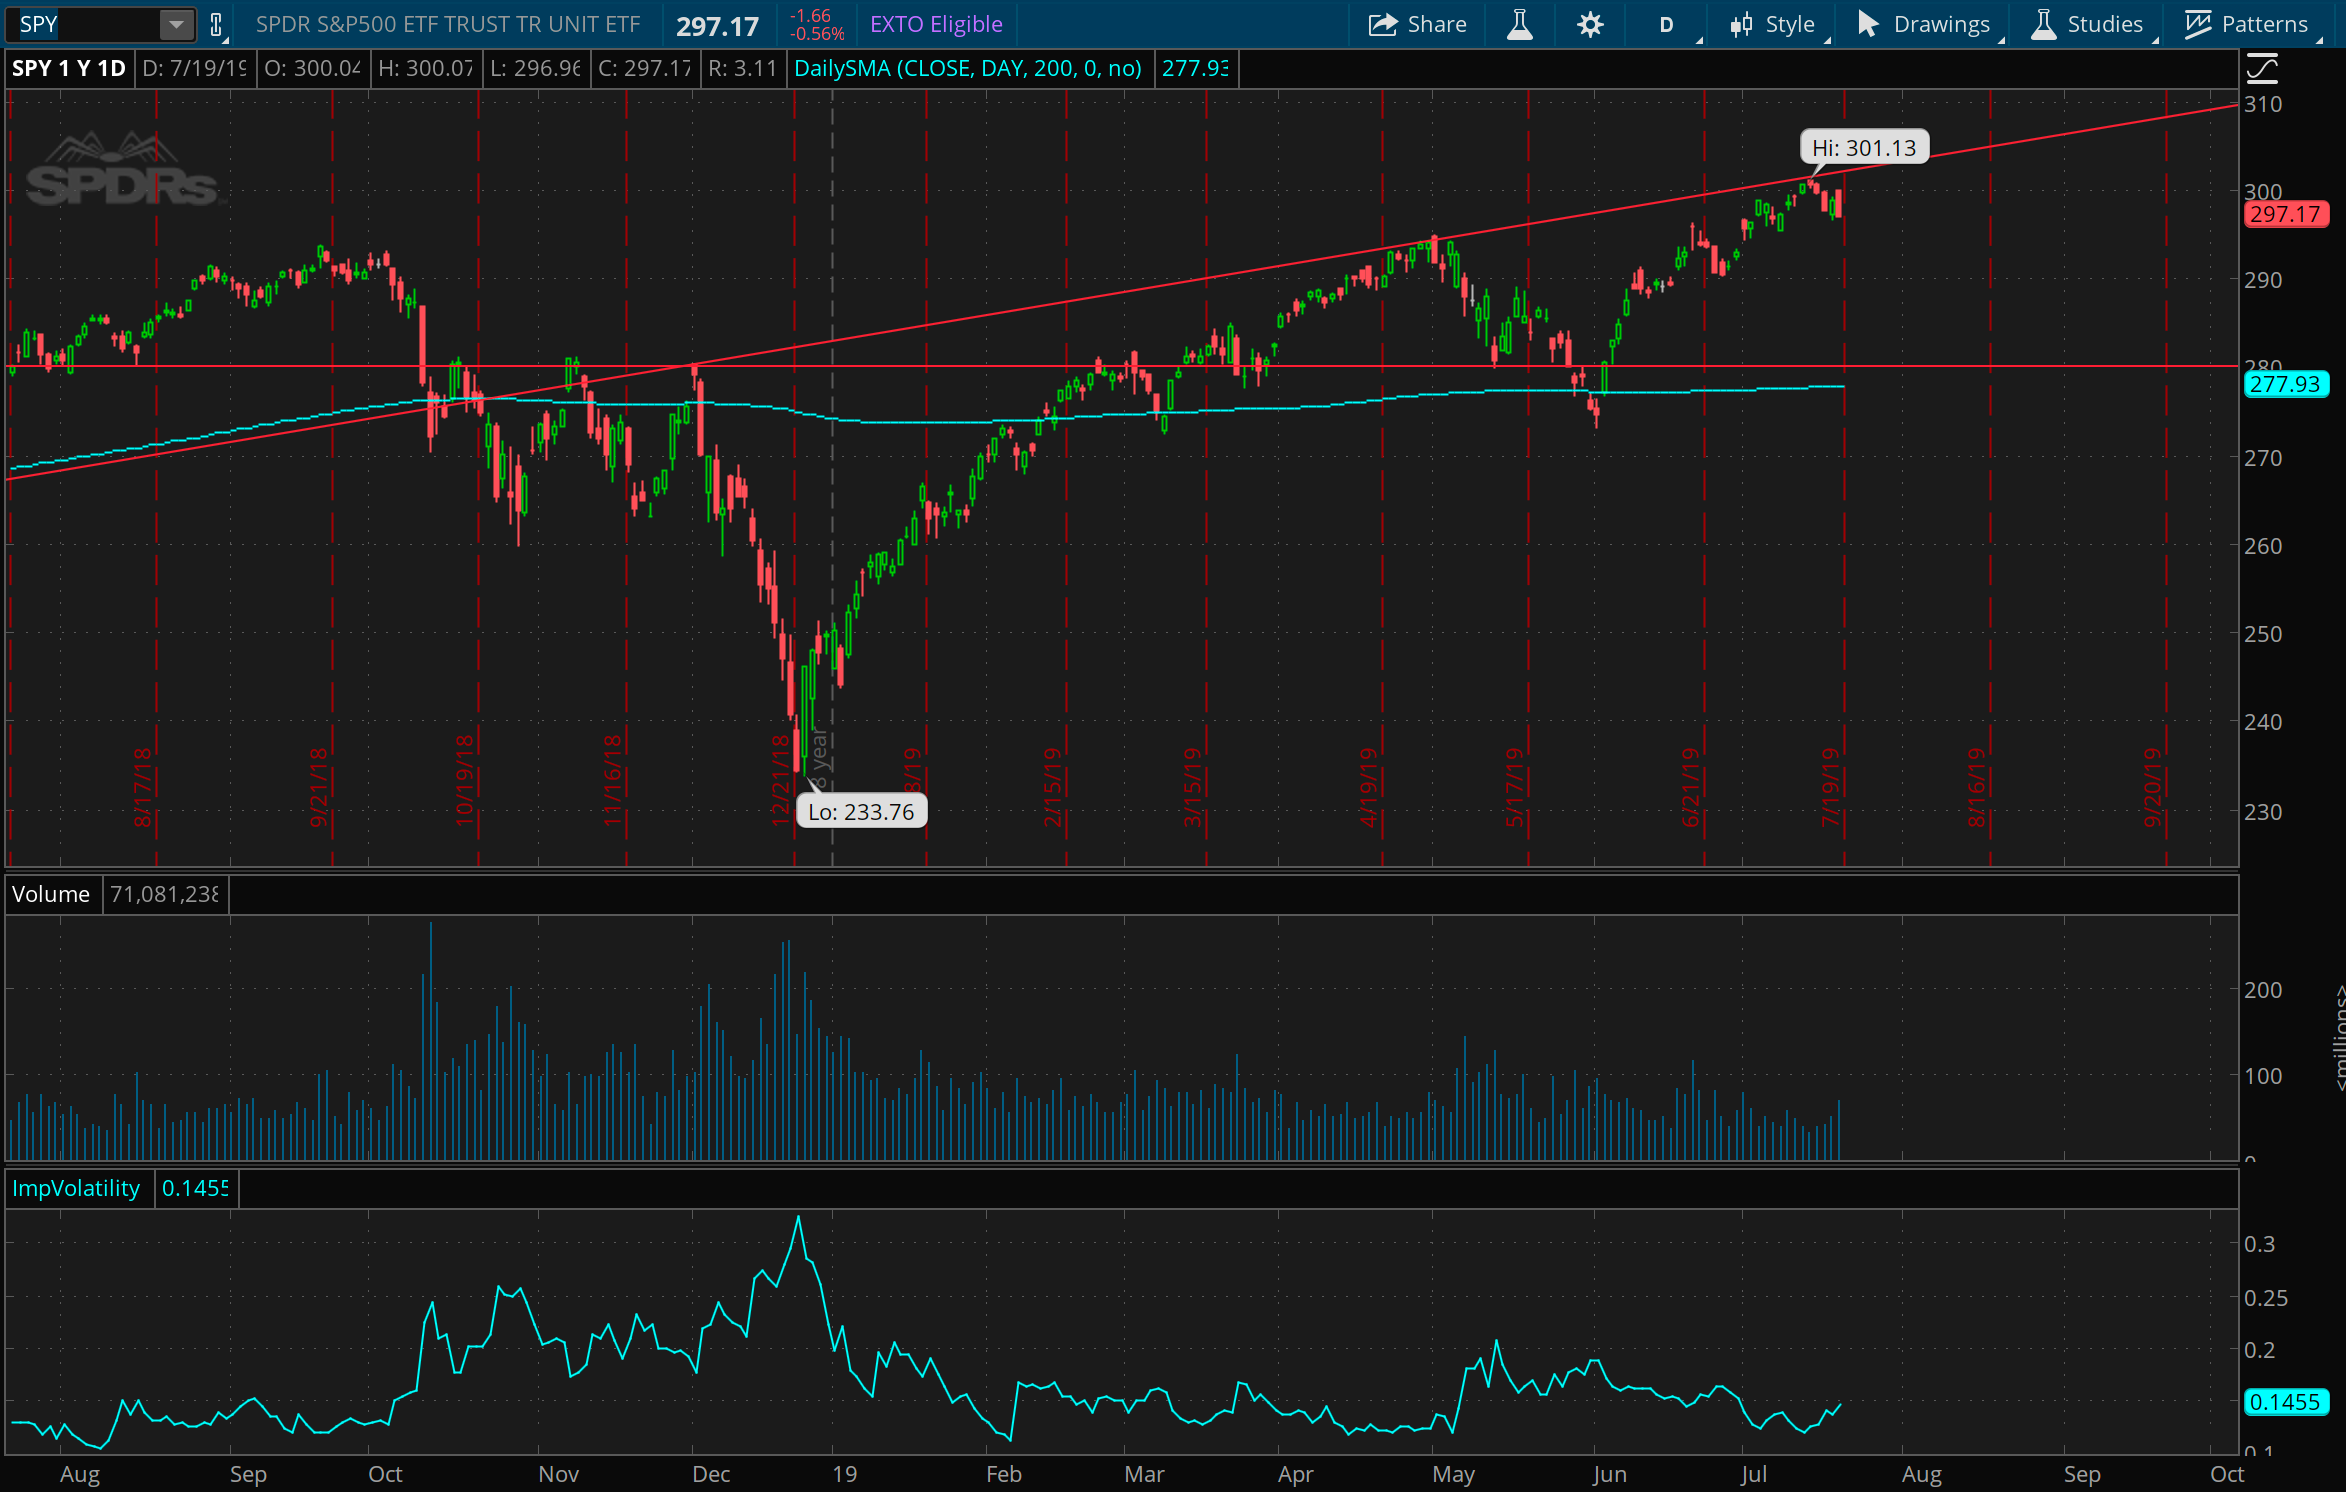
The market deflected quite beautifully off of this overhead resistance line, and it’s watching these sort of price reactions that give one some belief that the right trend lines can have some predictive power. Of course, how they are drawn and where they are anchored are very subjective, and they are more or less impossible to prove as mathematically predictive, but I do absolutely believe they can ultimately summarize sentiment. Trends reflect the life and momentum of sentiment as prices rise or fall, and trend lines can help mark where the bounds of that sentiment ought to stay within, and mark potential places where sentiment has changed. Anyway, the market is staying in it’s bounds. A down week, but could very well continue grinding higher from here, with a lot of room to tumble downward.
A dramatic win on NFLX
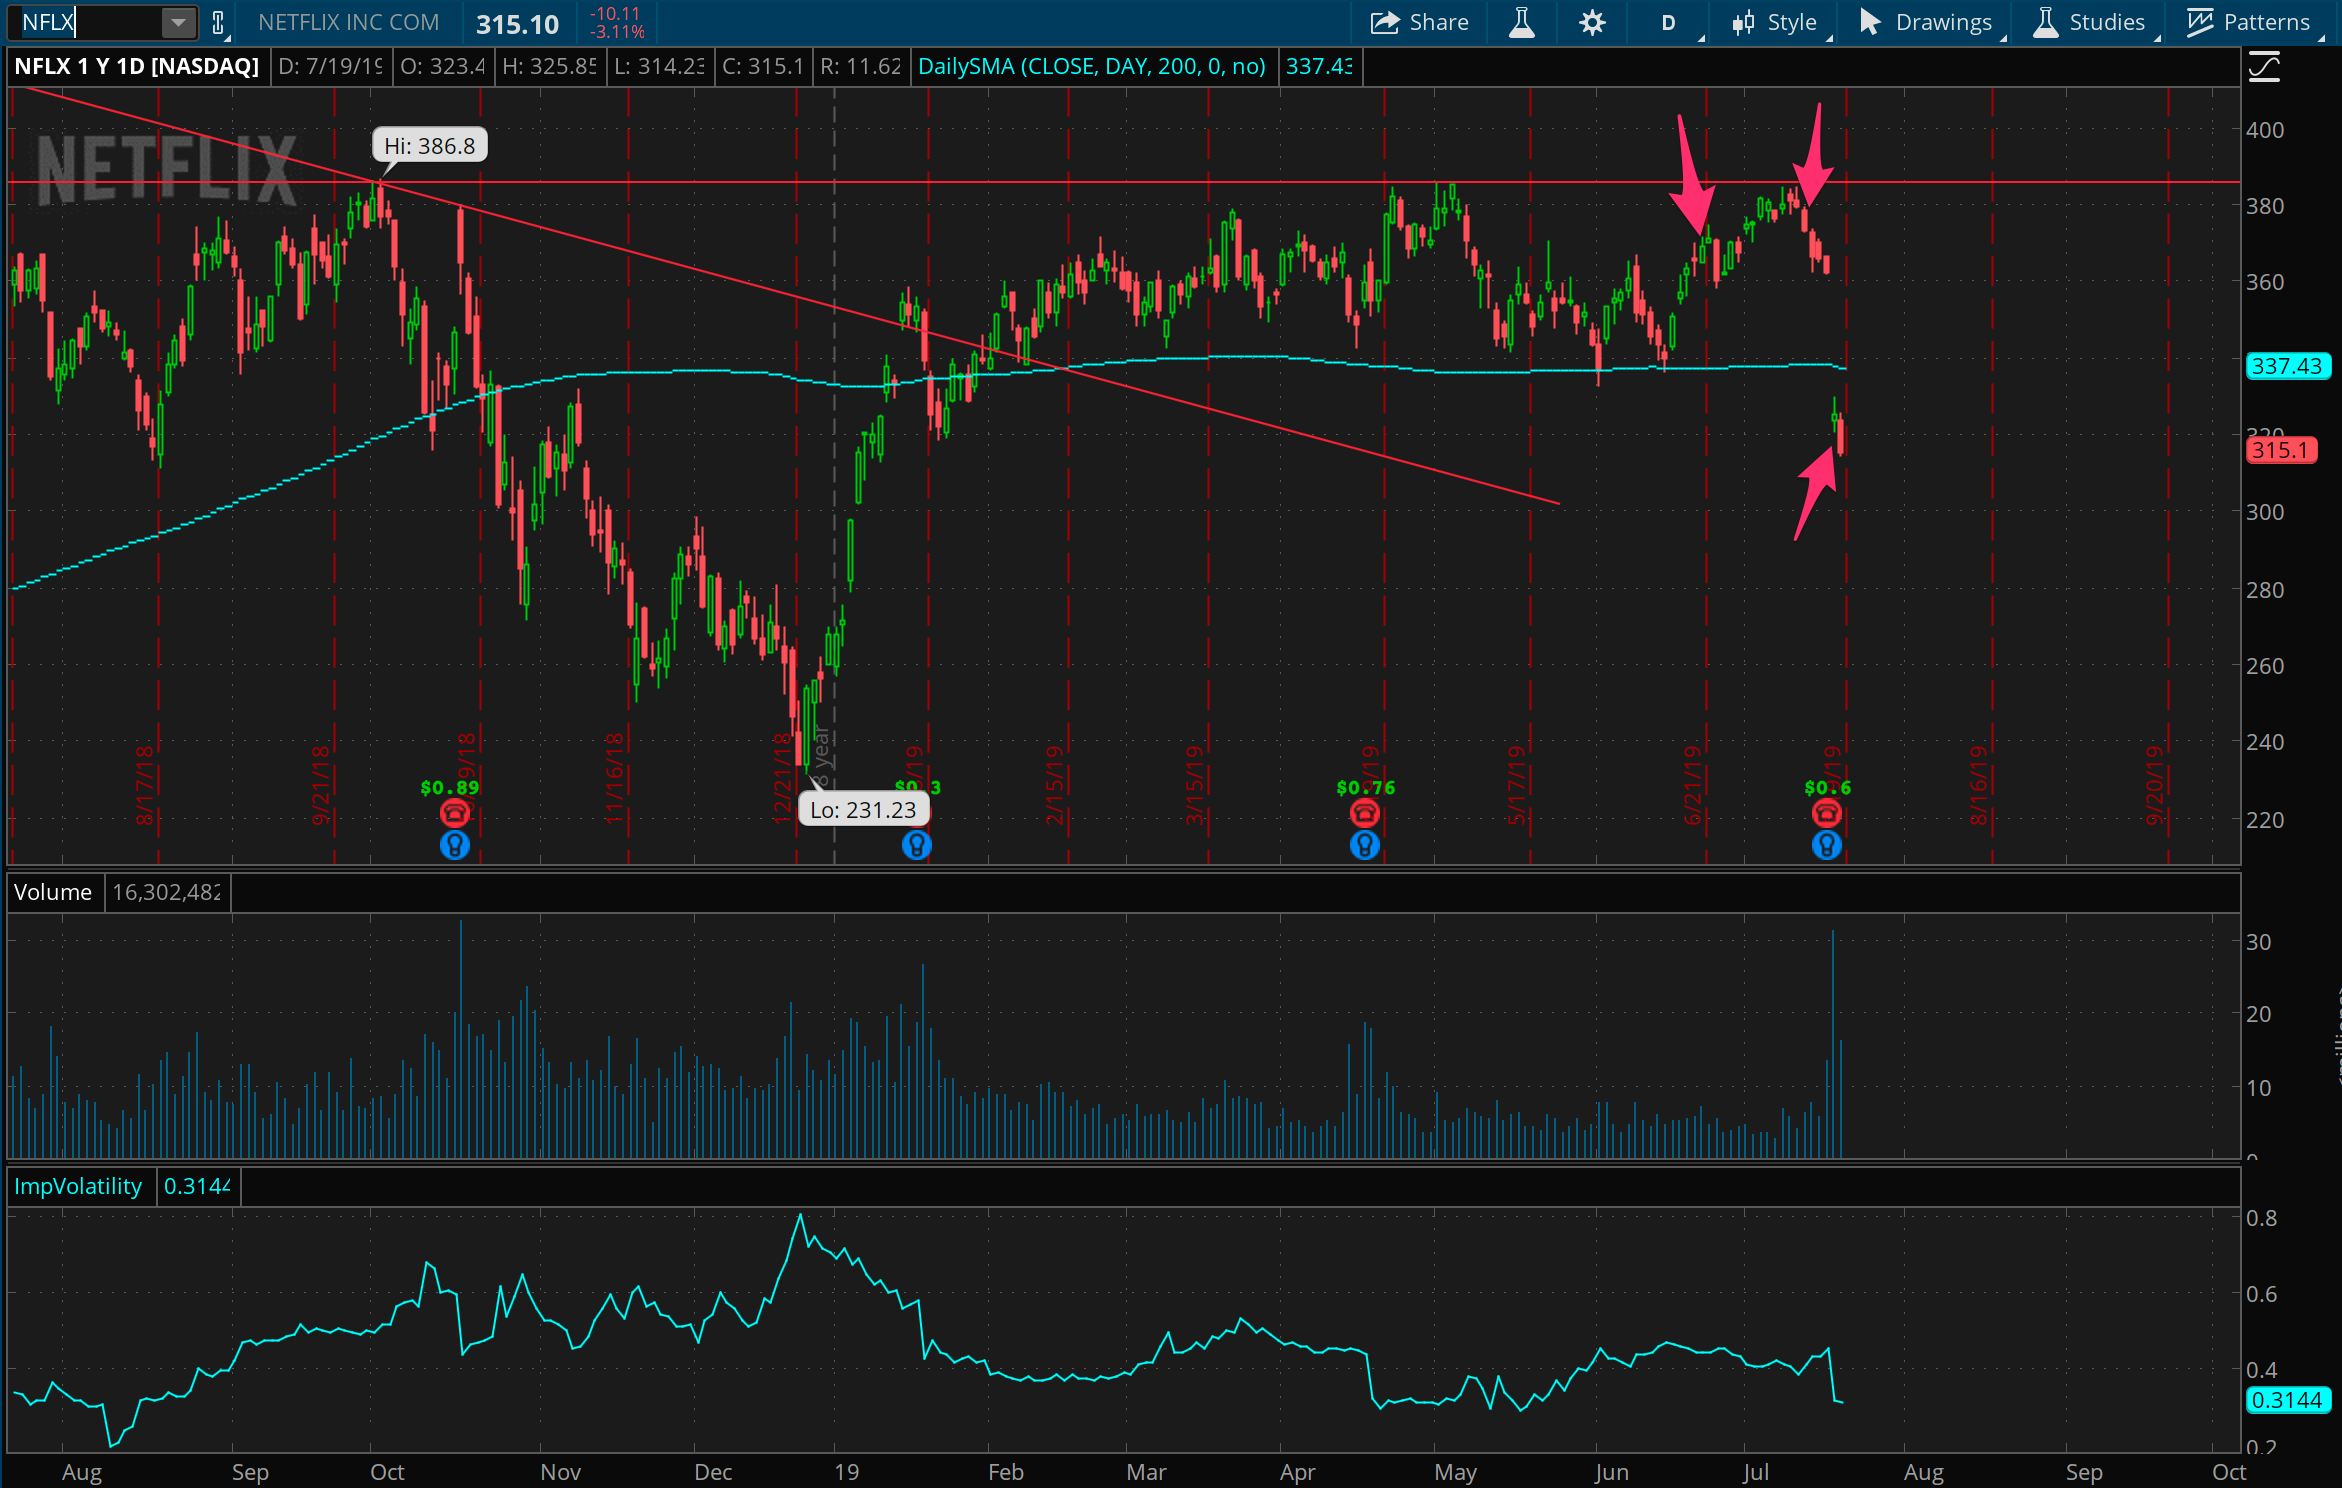
That 385 level in NFLX was sweet as sugar, wasn’t it? Last week, I noted prices were really holding under that level. Apparently a lot of investors have been eager to get out around this level as a break even point prior to the blood bath at the end of last year. So, also last week, I supposed that upcoming earnings could take NFLX out of this range we’ve watched it in for months. And look here. Netflix had a bad report and it gapped down by 10%, getting me out of the 385 call spread I had added to at the end of last week, for a strong winner.
Dare to square
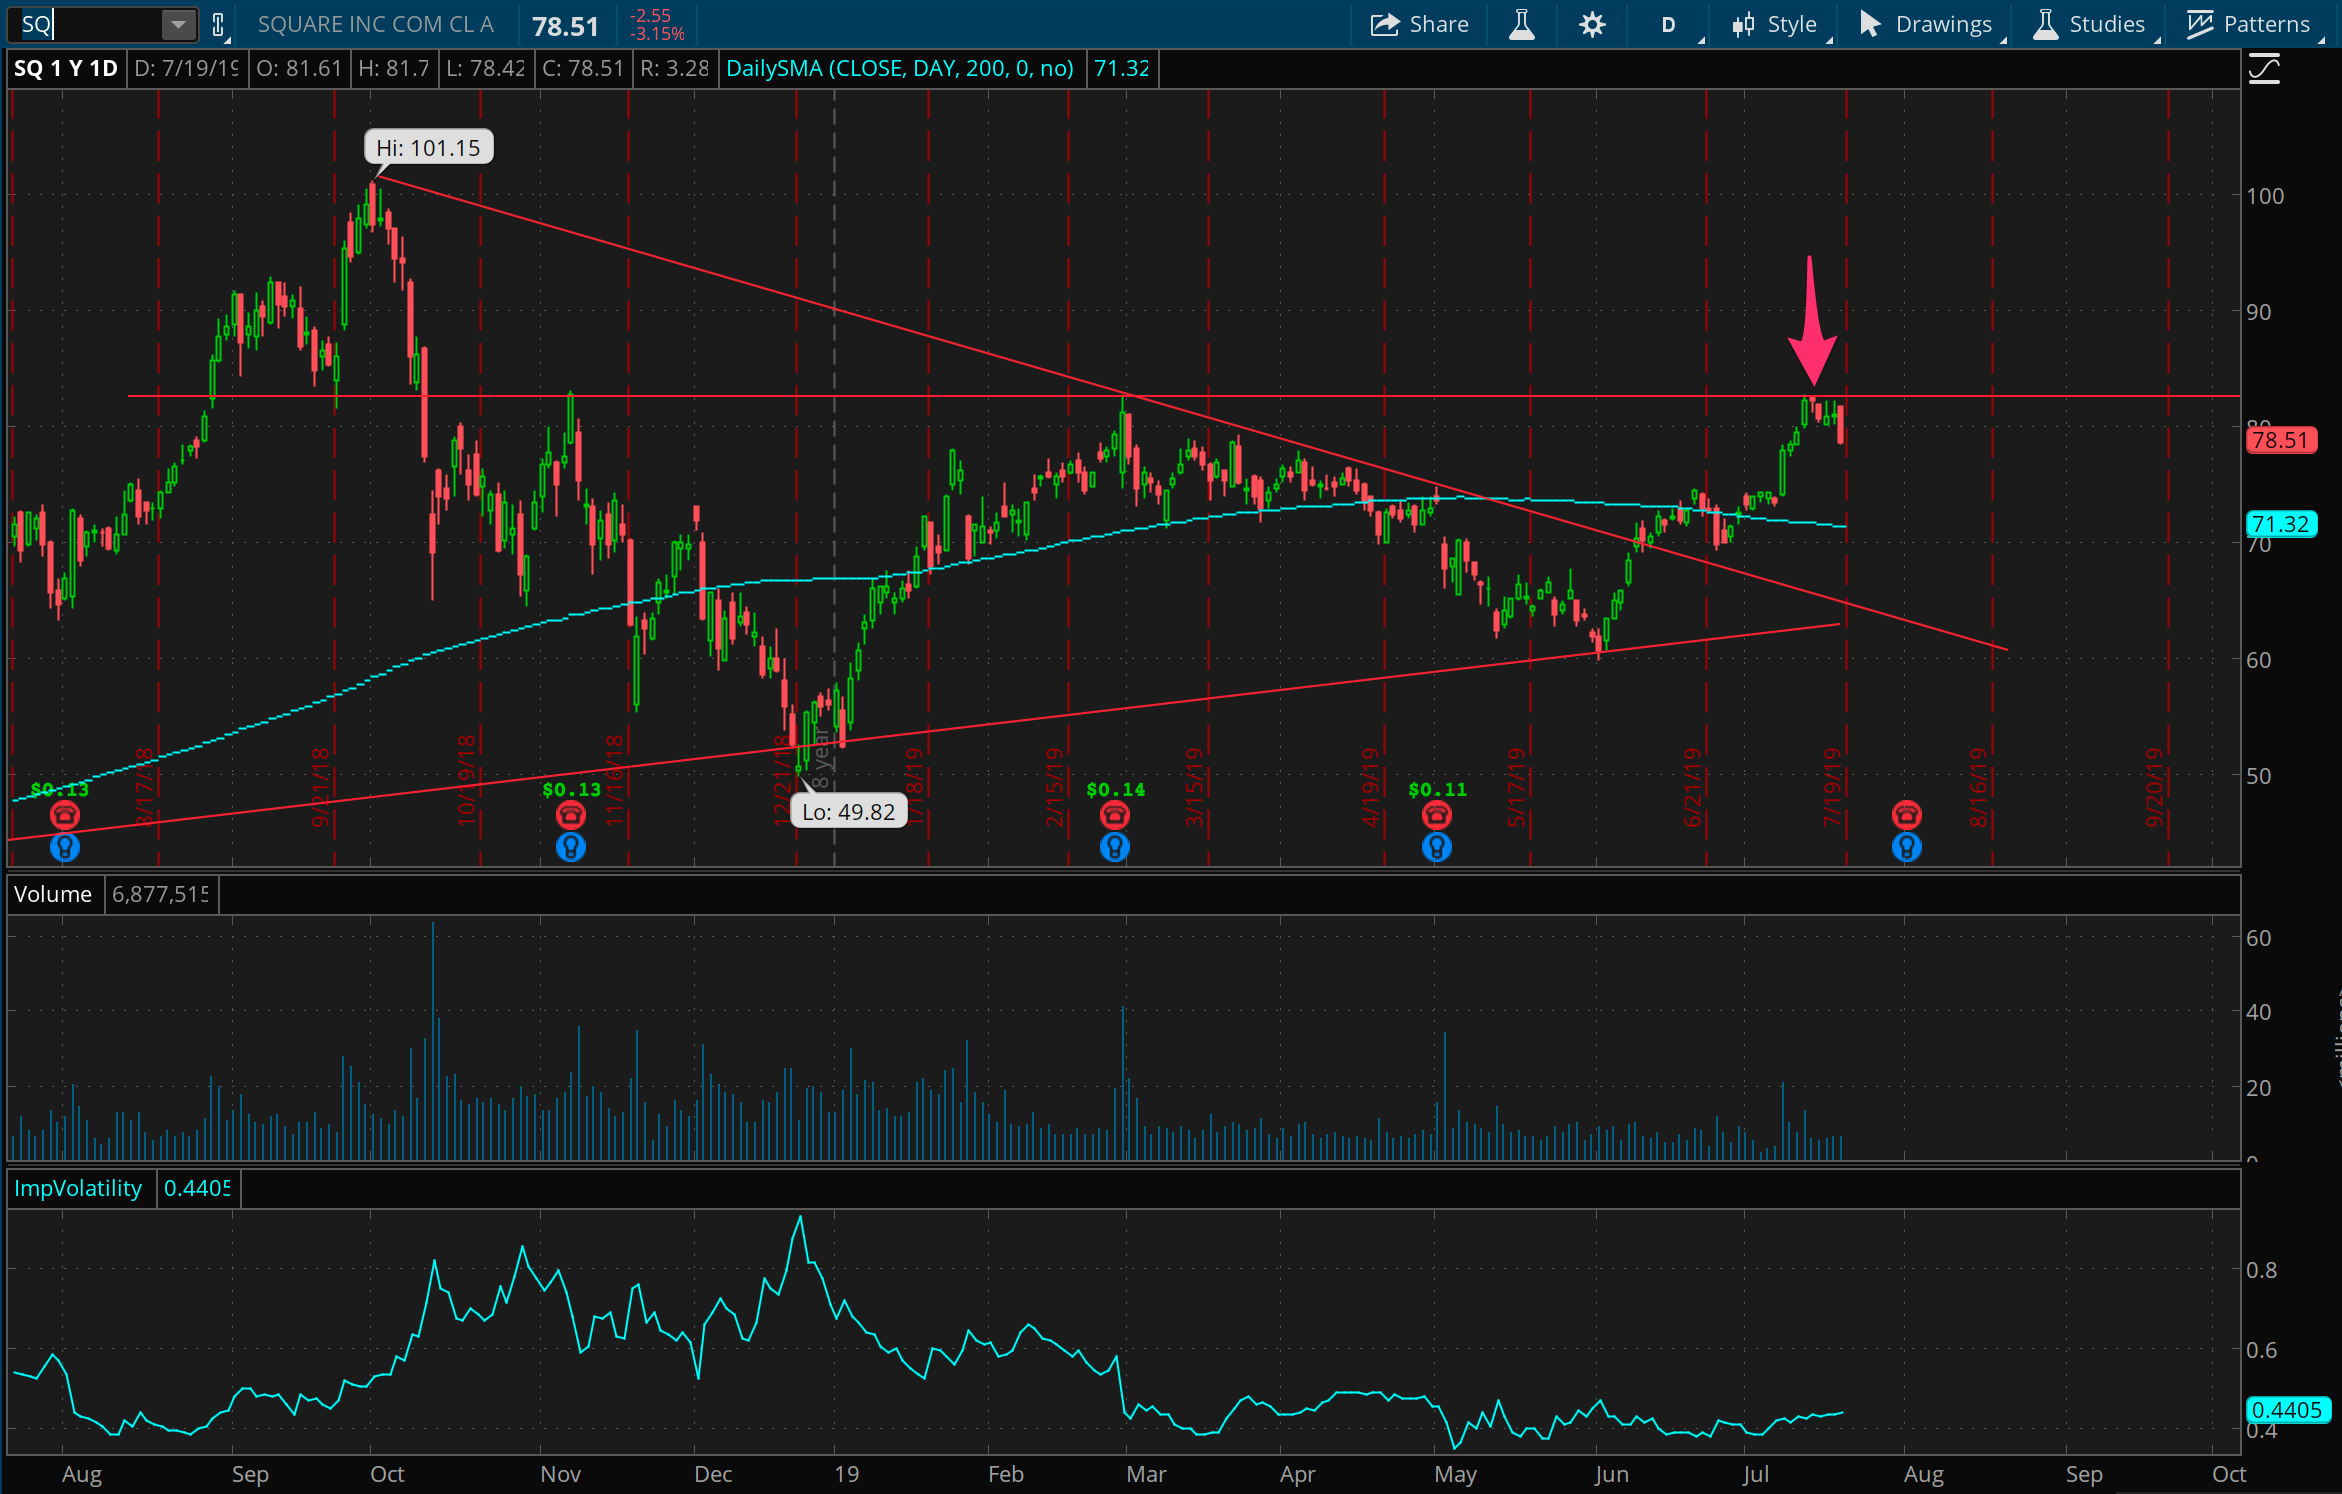
After watching a crazy move upward in Square last week, I thought it stopped pretty cleanly at an important level, there around 83 or so. This has been an important and fairly high volume price area several times over the past year, so it would make sense as a resistance point where investors are wanting to get even and get out. It was an interesting trade to put on with a call spread at 85, as it felt like the reverse of catching a falling knife. But it turned out to hold, and the trade is working in my favor for now.
CAT in check
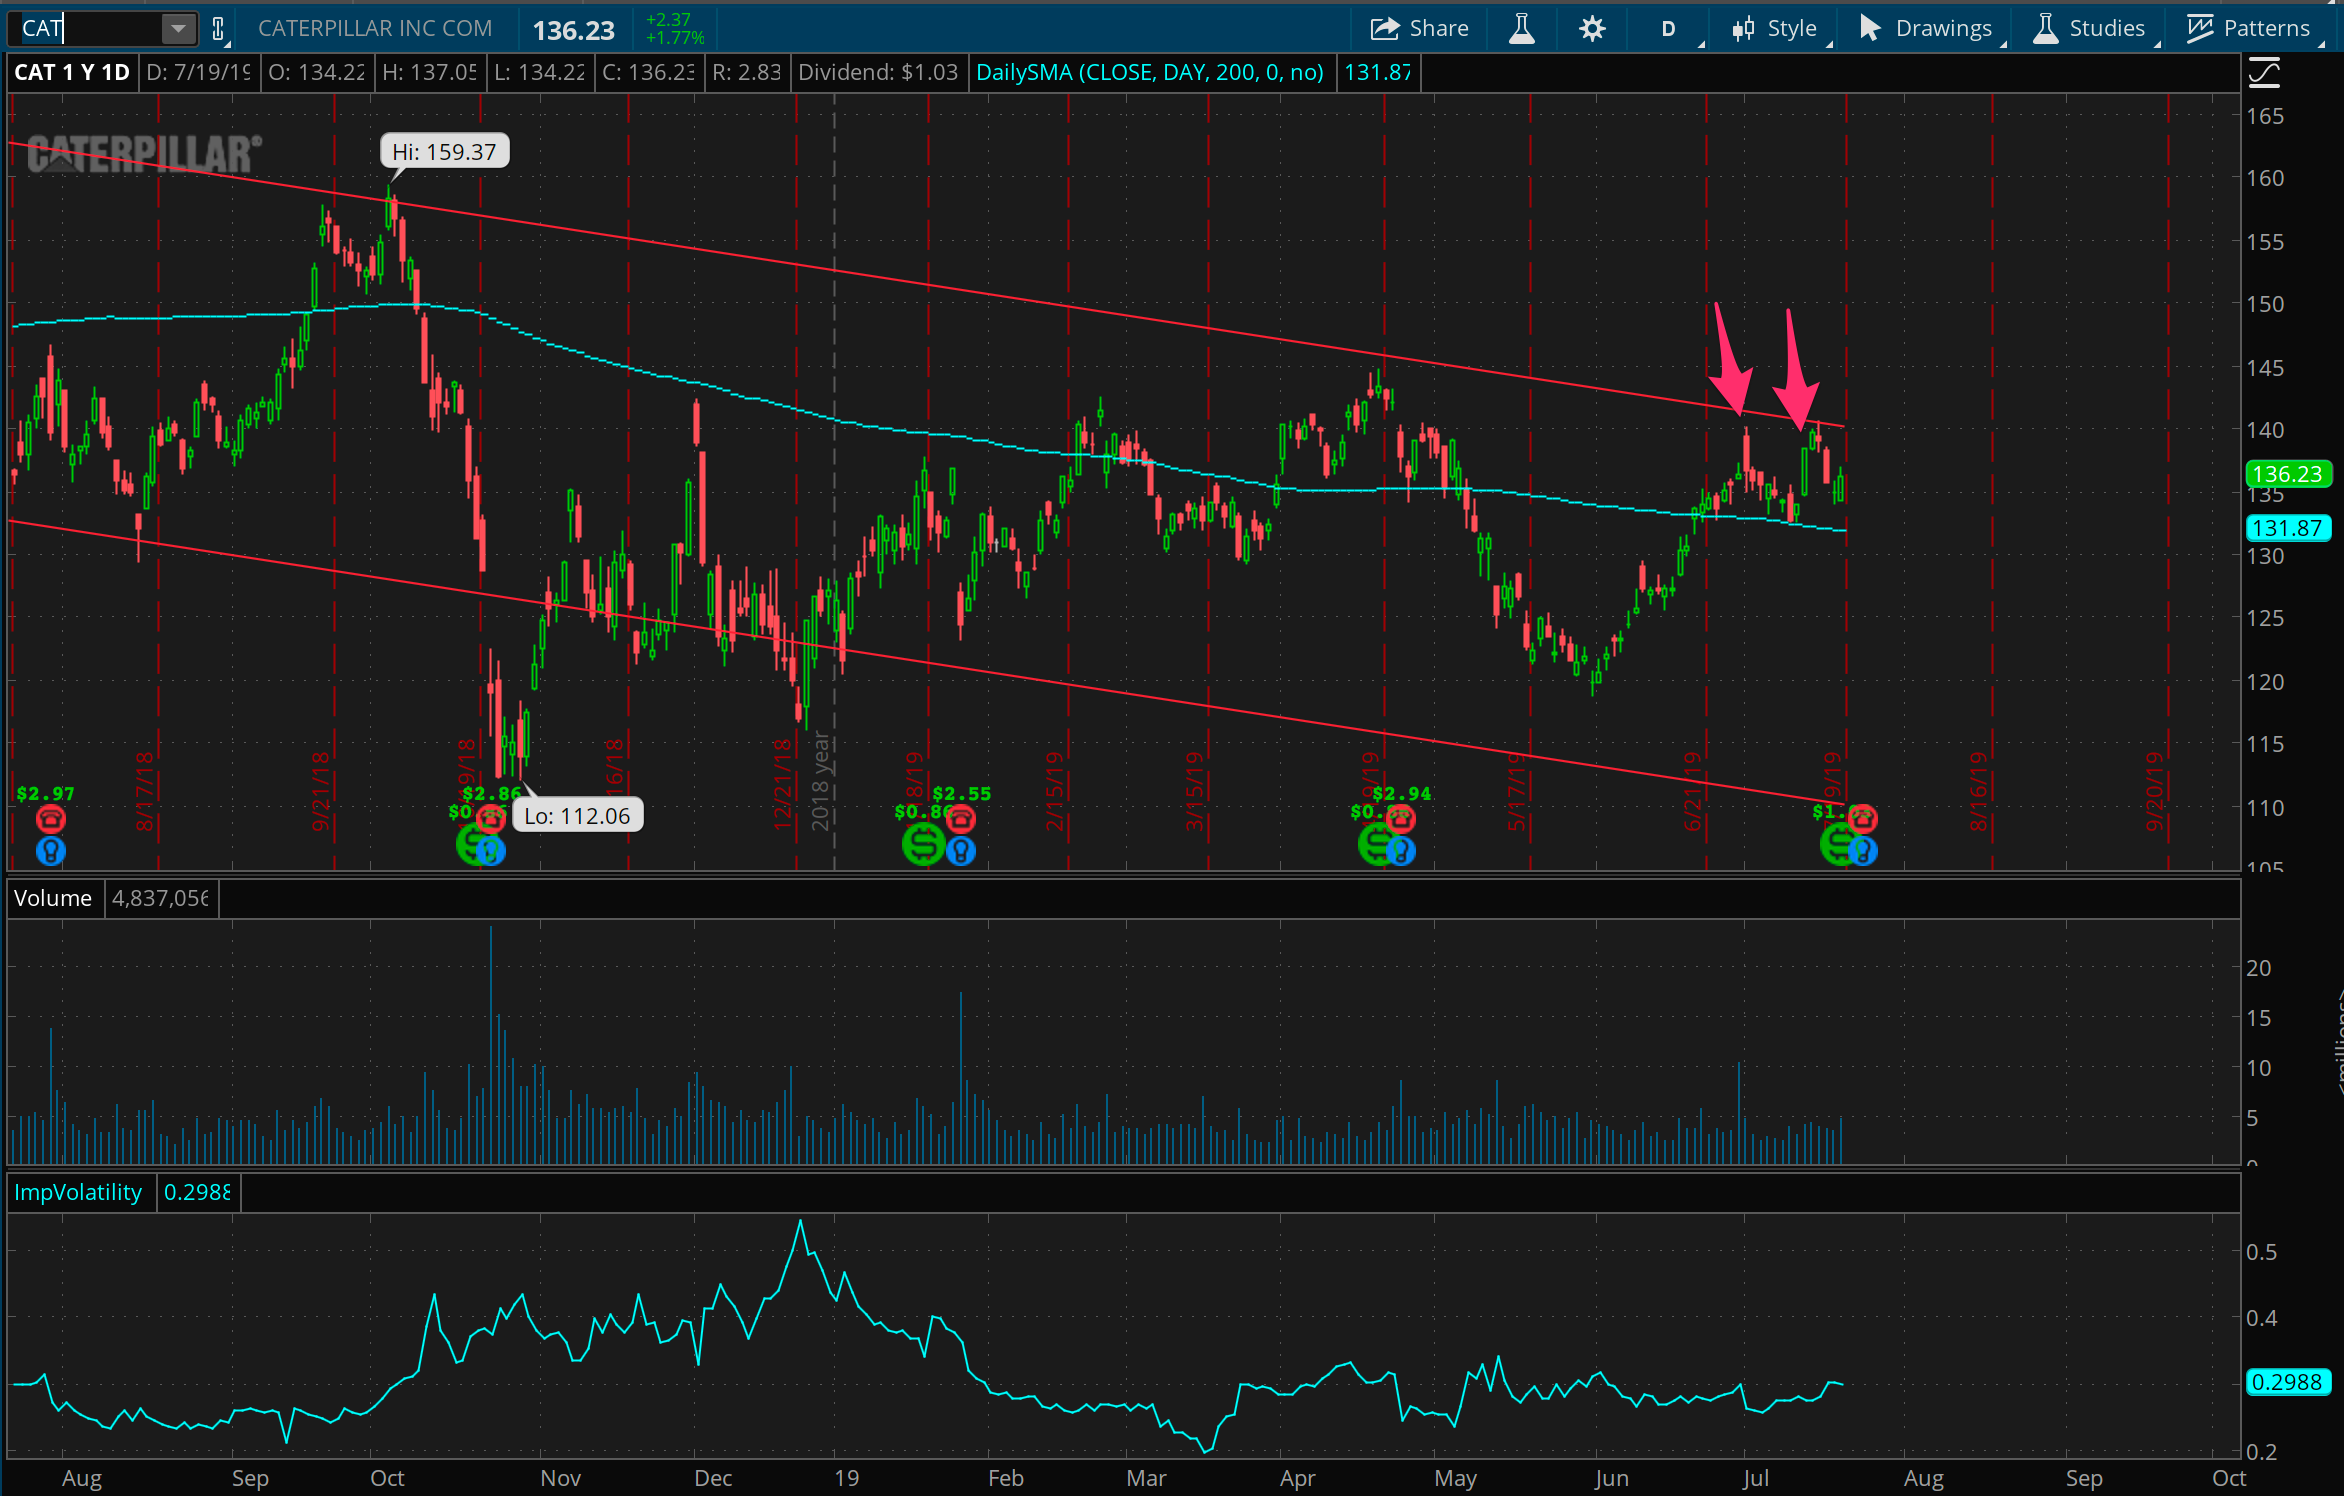
Meanwhile, it’s these trades like the one in CAT that I added to last week which will probably do me in, looking as clean as they do. (I thought the same thing weeks and weeks ago about XLB and XLF setups, which still haven’t worked in my favor.) Still though, for now CAT is holding steady and behaving as I hoped, staying under 140 and taking a small spill downward this week. Will carry this one forward and hope to see it get under the 200 day MA there around 132.
Shorting out on energy
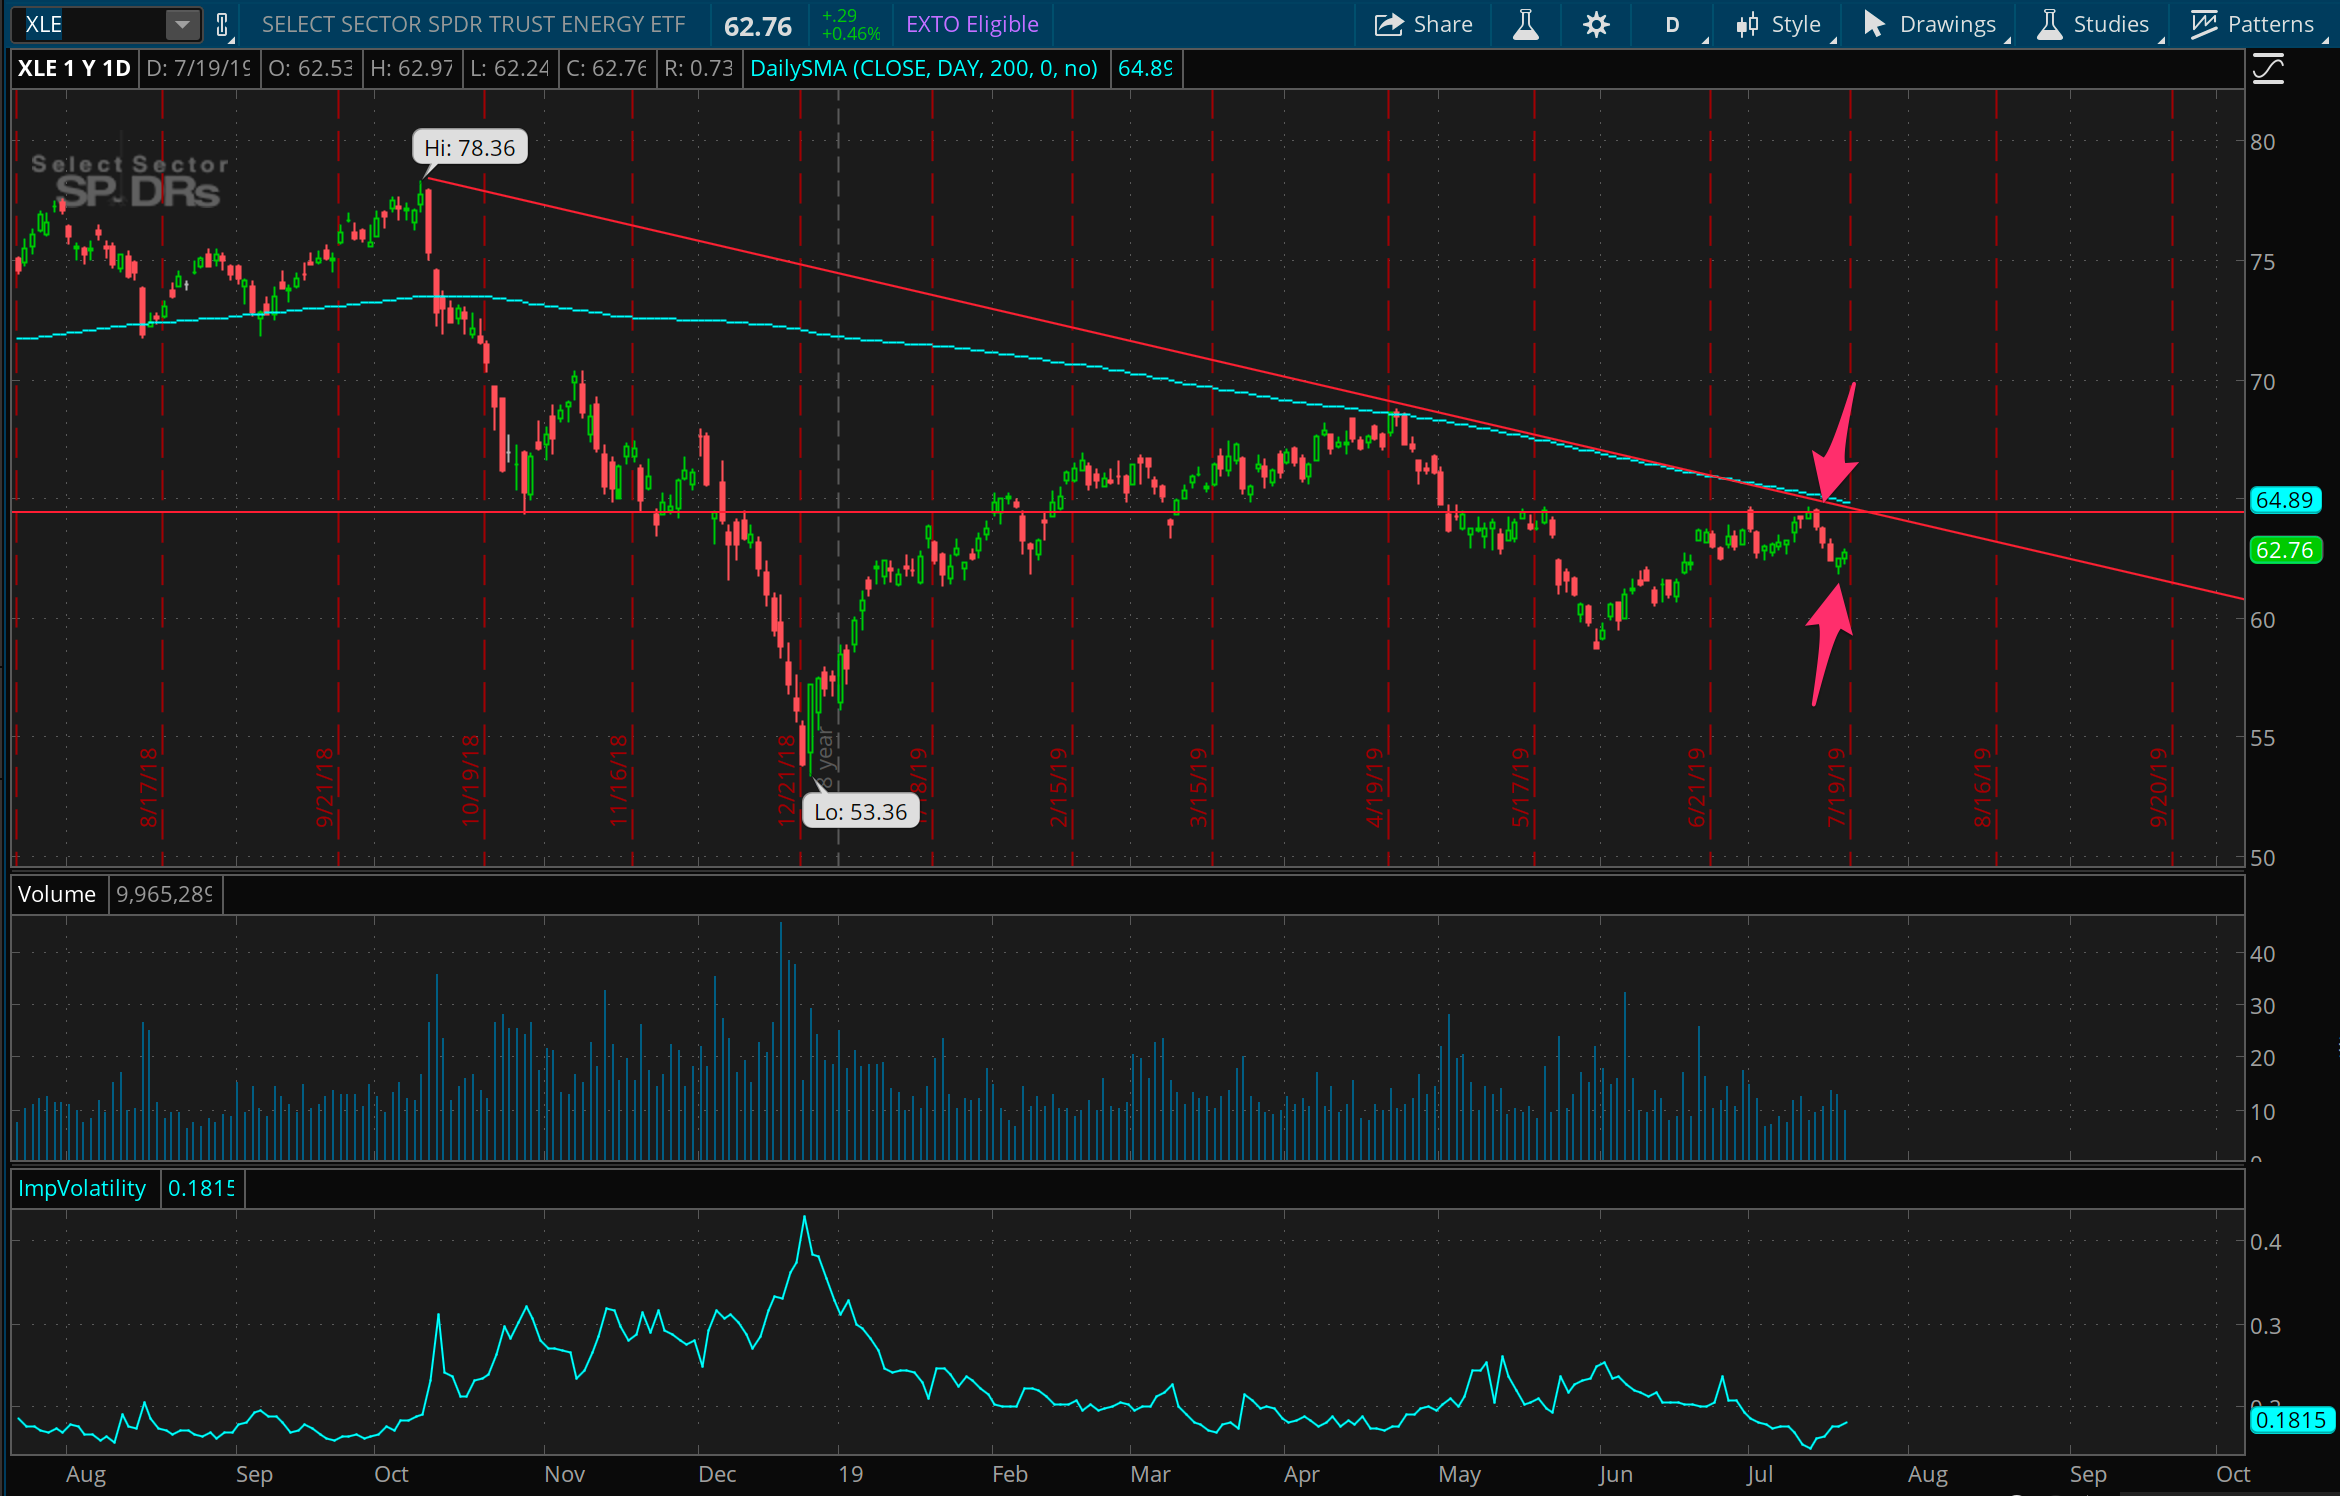
Last week, XLE looked like it was facing resistance for multiple reasons, and so I jumped in on a pretty directional short, buying puts early this week. This was a small but speculative bet that turned into a quick double over the next couple days. That said, I think there’s more to be had here, and will likely take another swing if it gets back up towards 64 or so.
Oil prices are still… fun
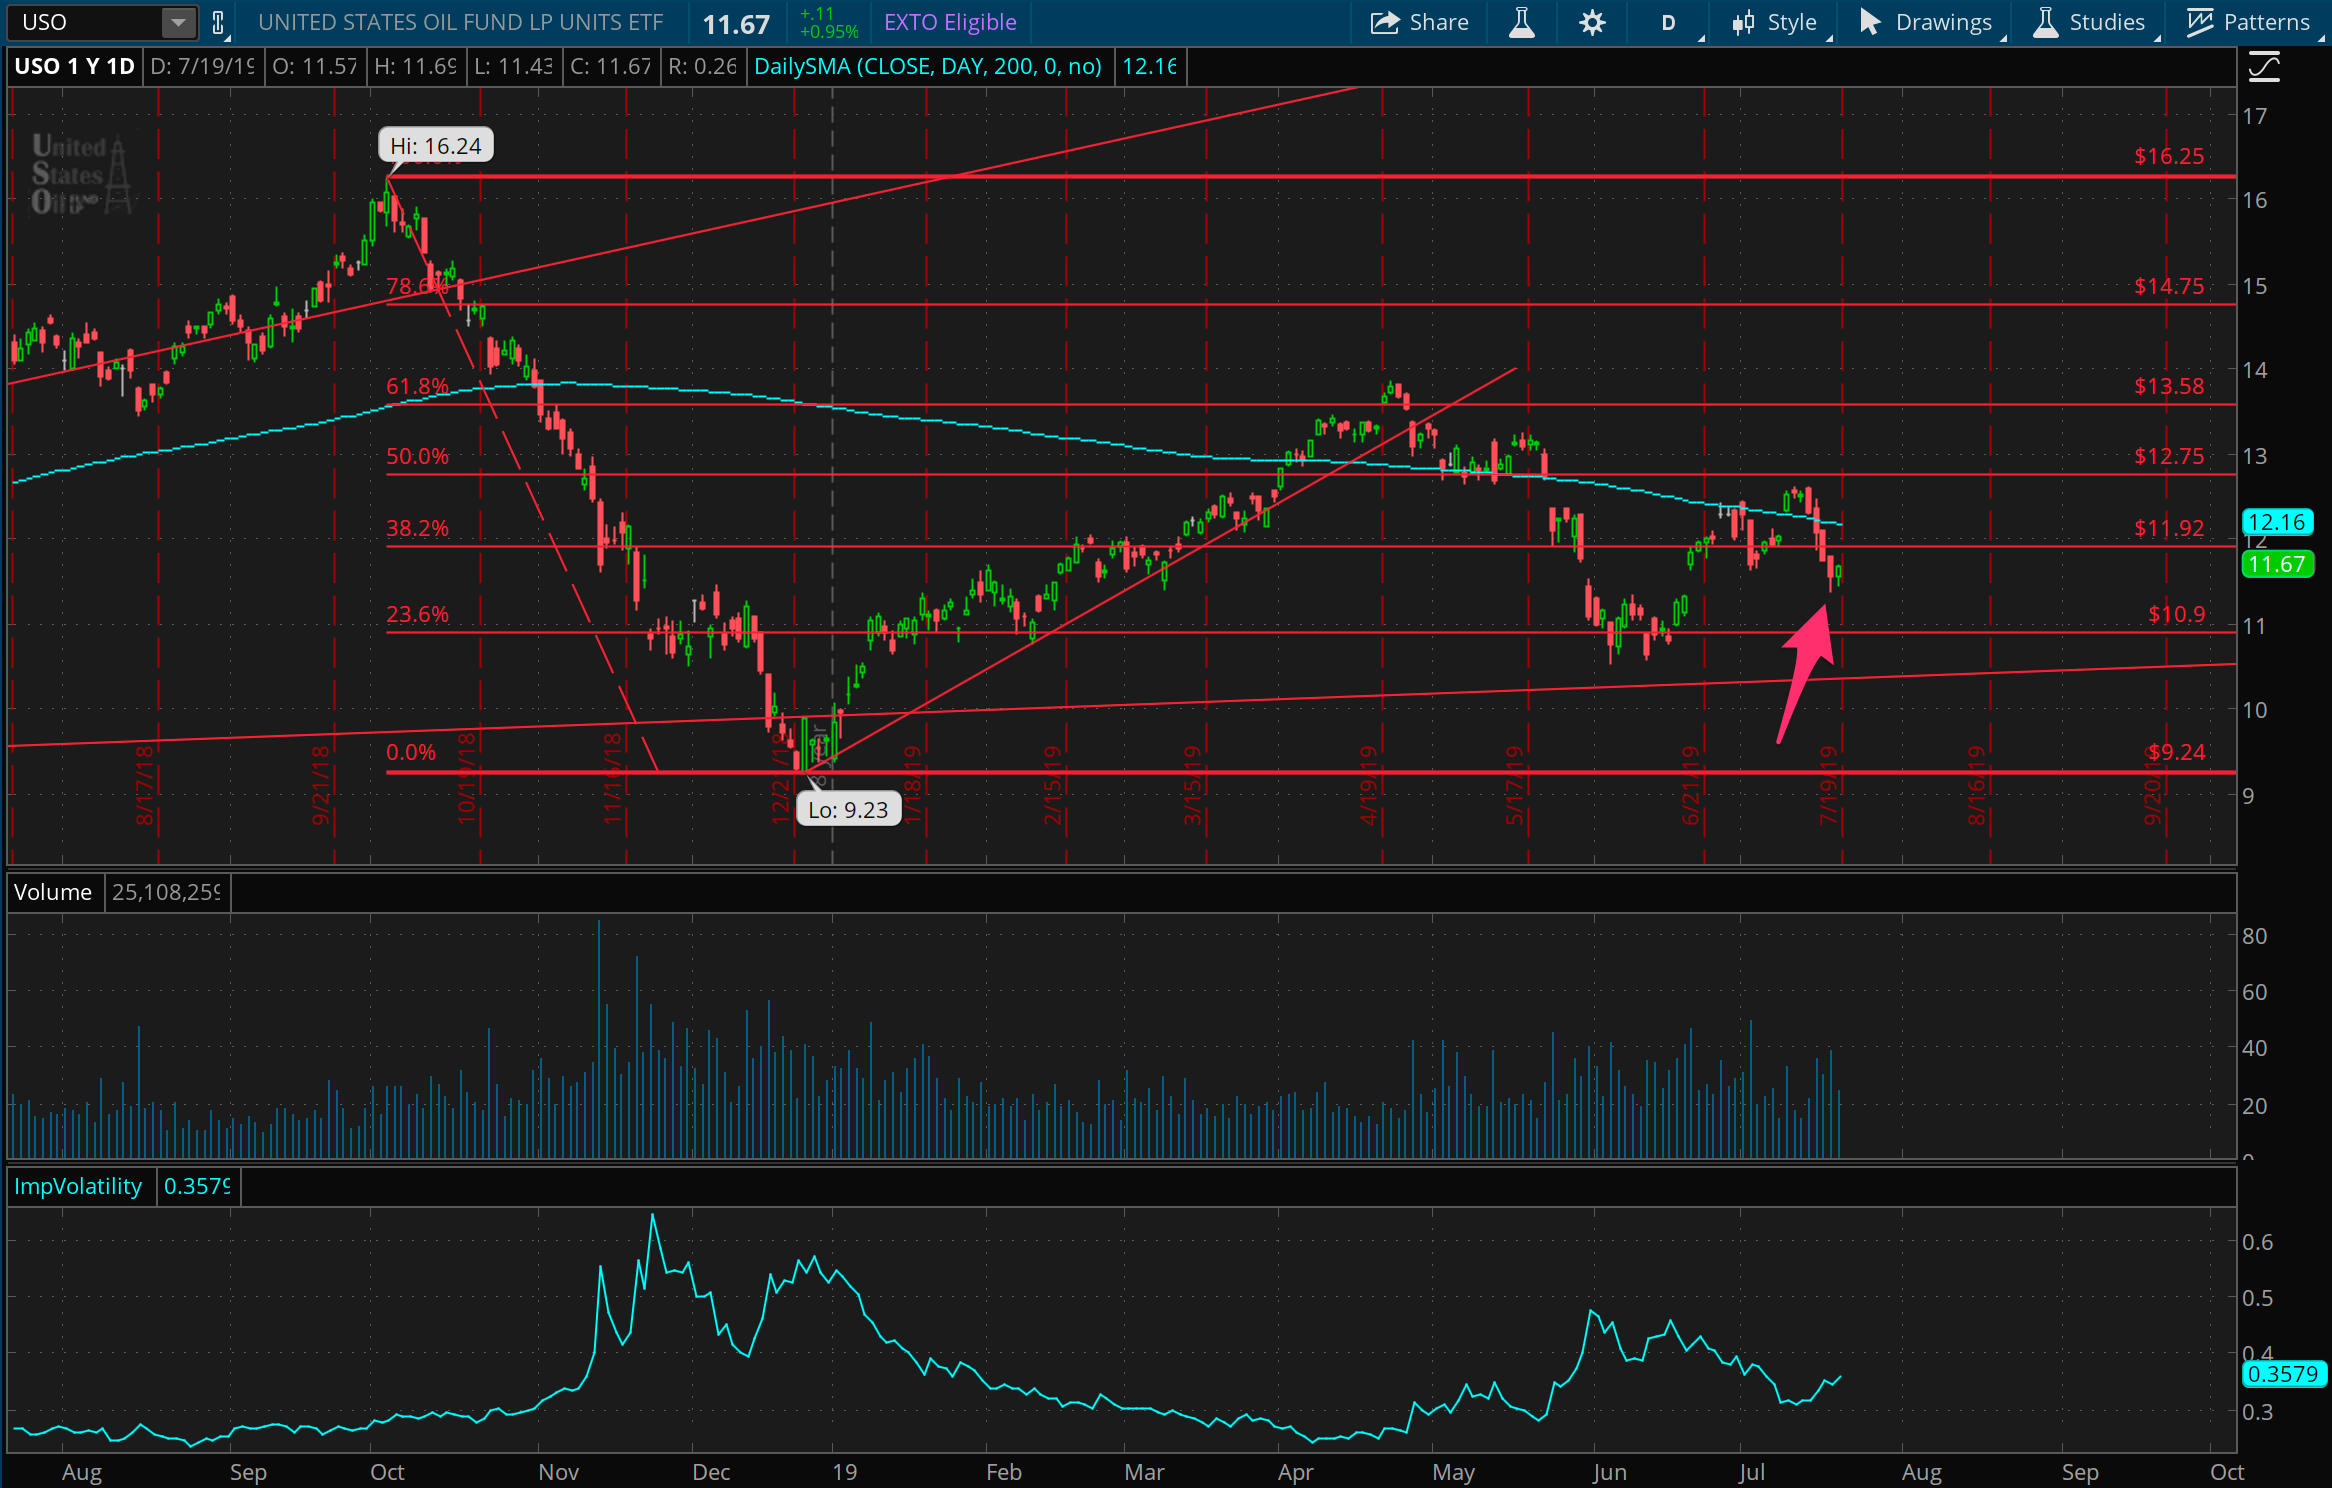
Jumping back into oil here because it’s a good training vehicle for learning how to manage “undefined risk” options trades, as it’s a low priced underlying hanging around 12 dollars per share right now for this oil ETF. It is continuing to swing around between 11 and 13, and I decided to get in late this week to play the bottom of what looks like a range here. Will probably build more of a long position if it heads lower from here, or else an overhead call at 13 if it heads upwards instead.
Gold volatility
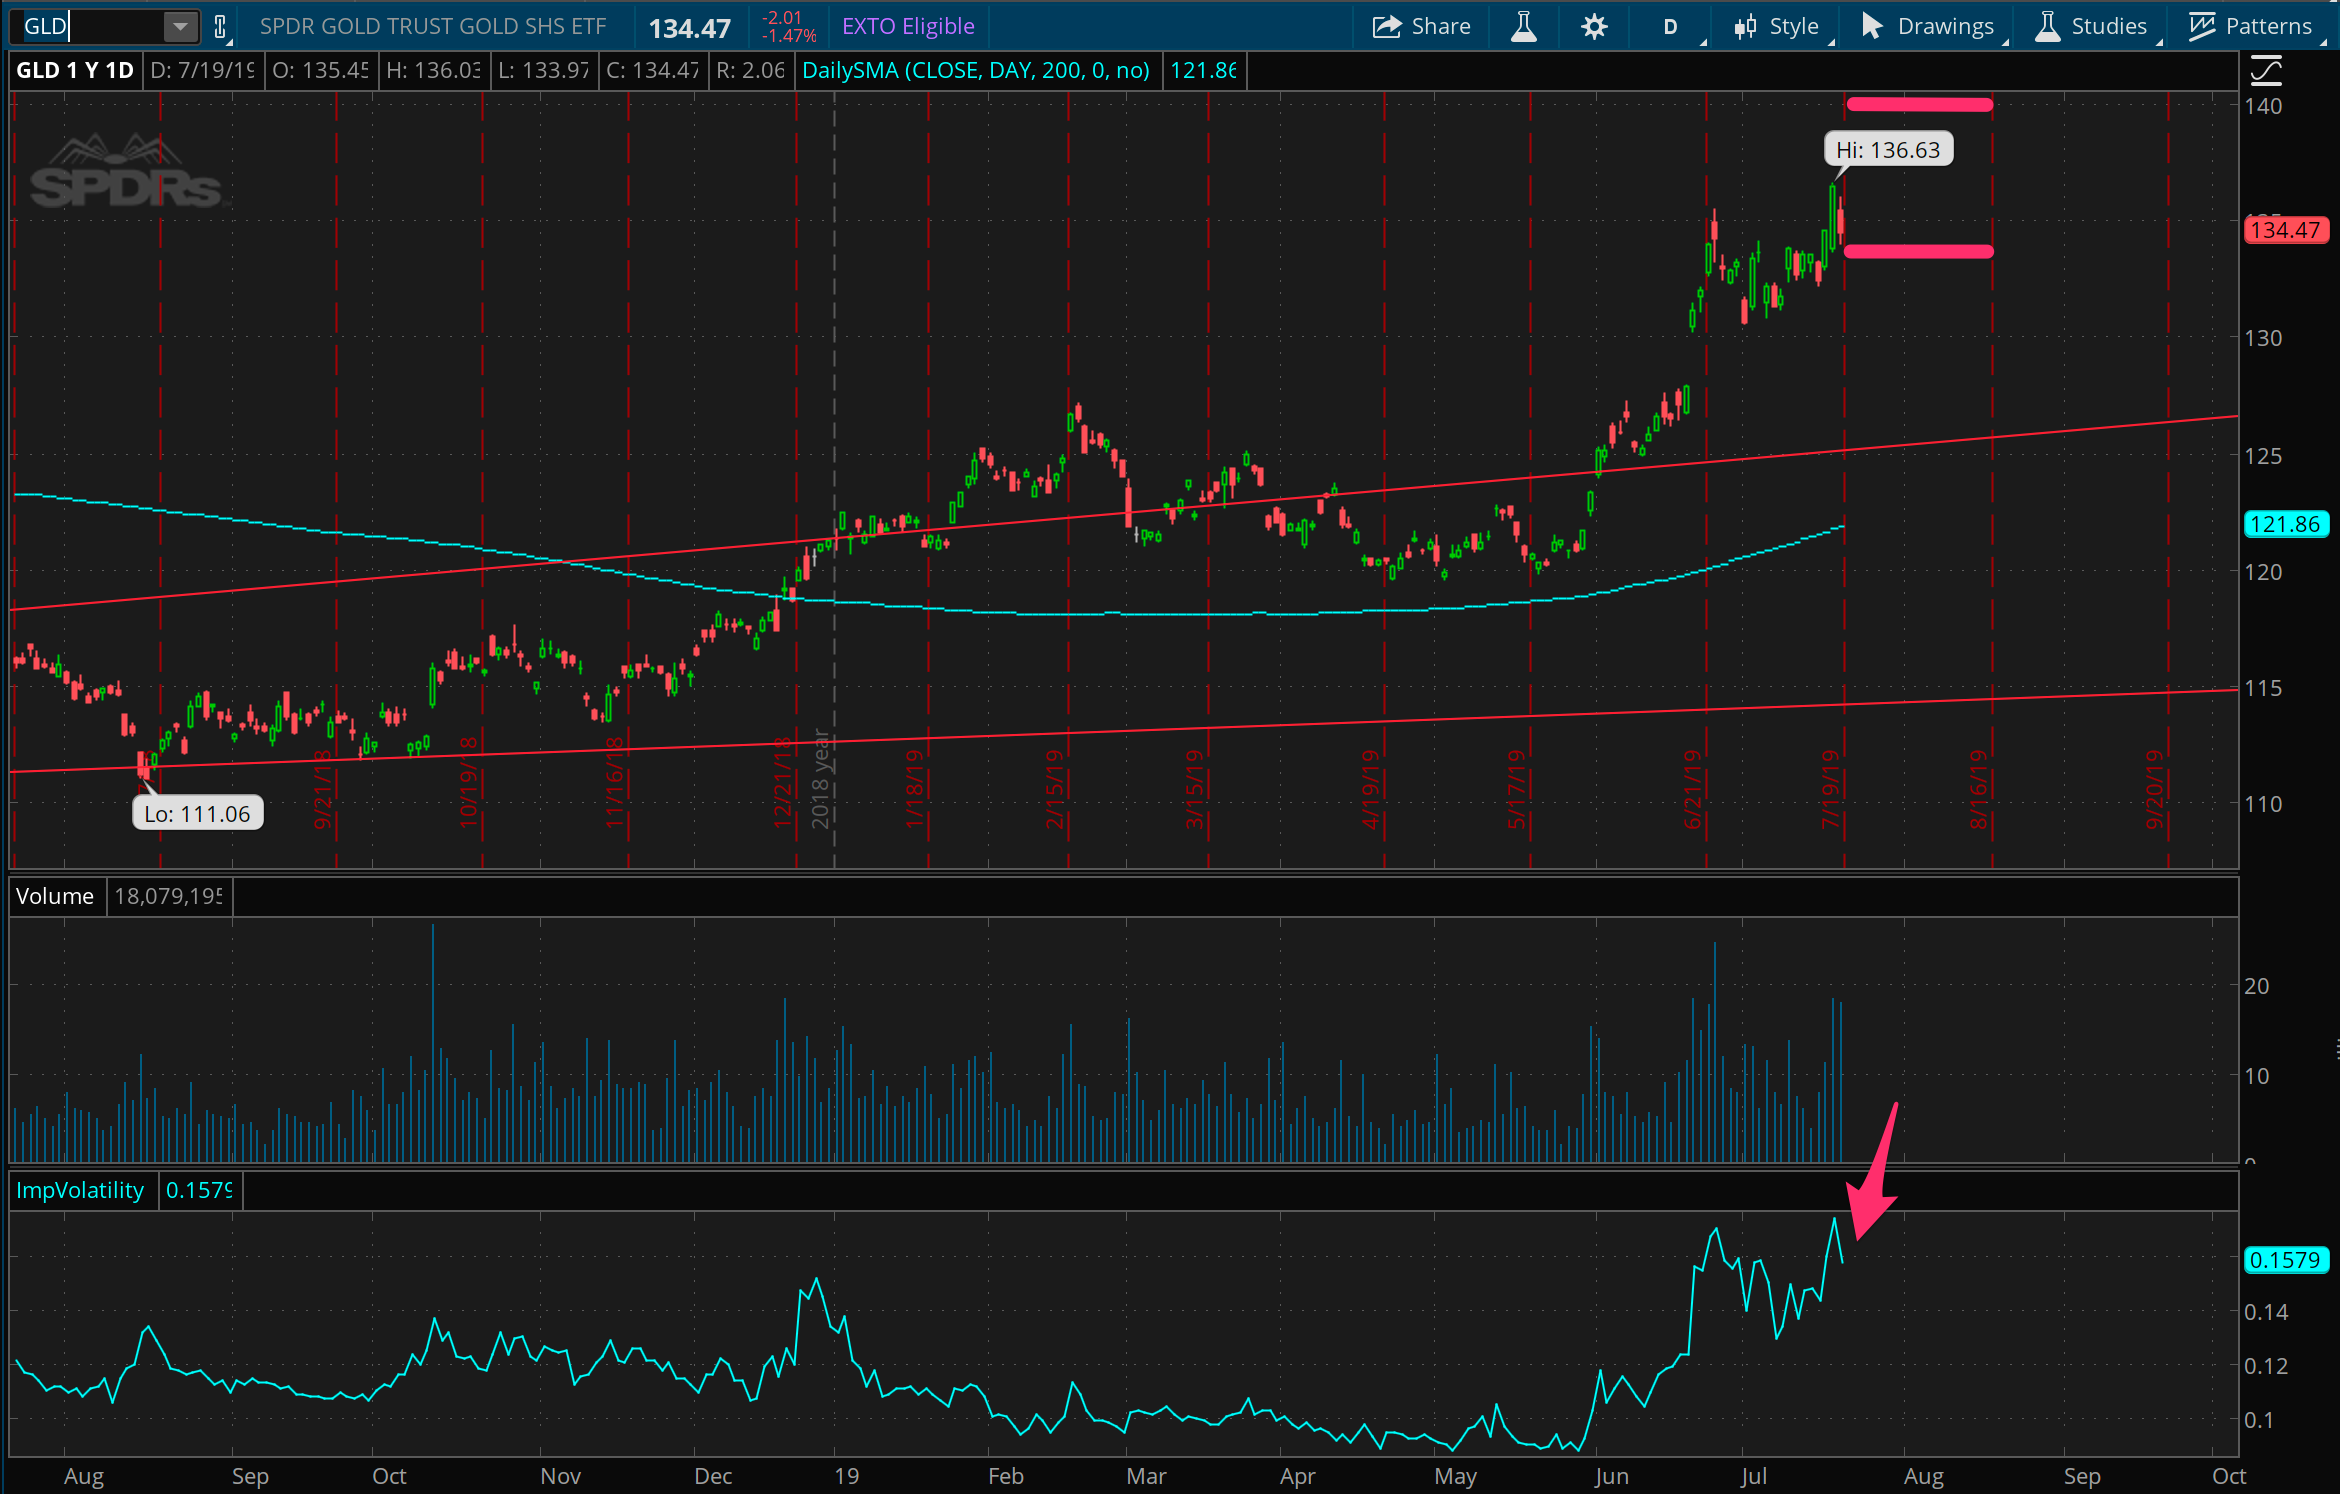
Trying out a slightly different kind of trade with GLD here, focusing on something less directional that’s playing more strictly off of the implied volatility here. Hence the arrow pointed downward on the implied volatility line at the bottom of the above chart. The horizontal lines in the chart show where I want the price to stay within as volatility falls. Where I’m often looking for directional bets, here I want to bet on the direction of volatility rather than the ETF itself, so I’ve put on an iron condor position that’s a little out of my wheelhouse but something I’m trying out to learn to work with.
Qualified to Qualcomm
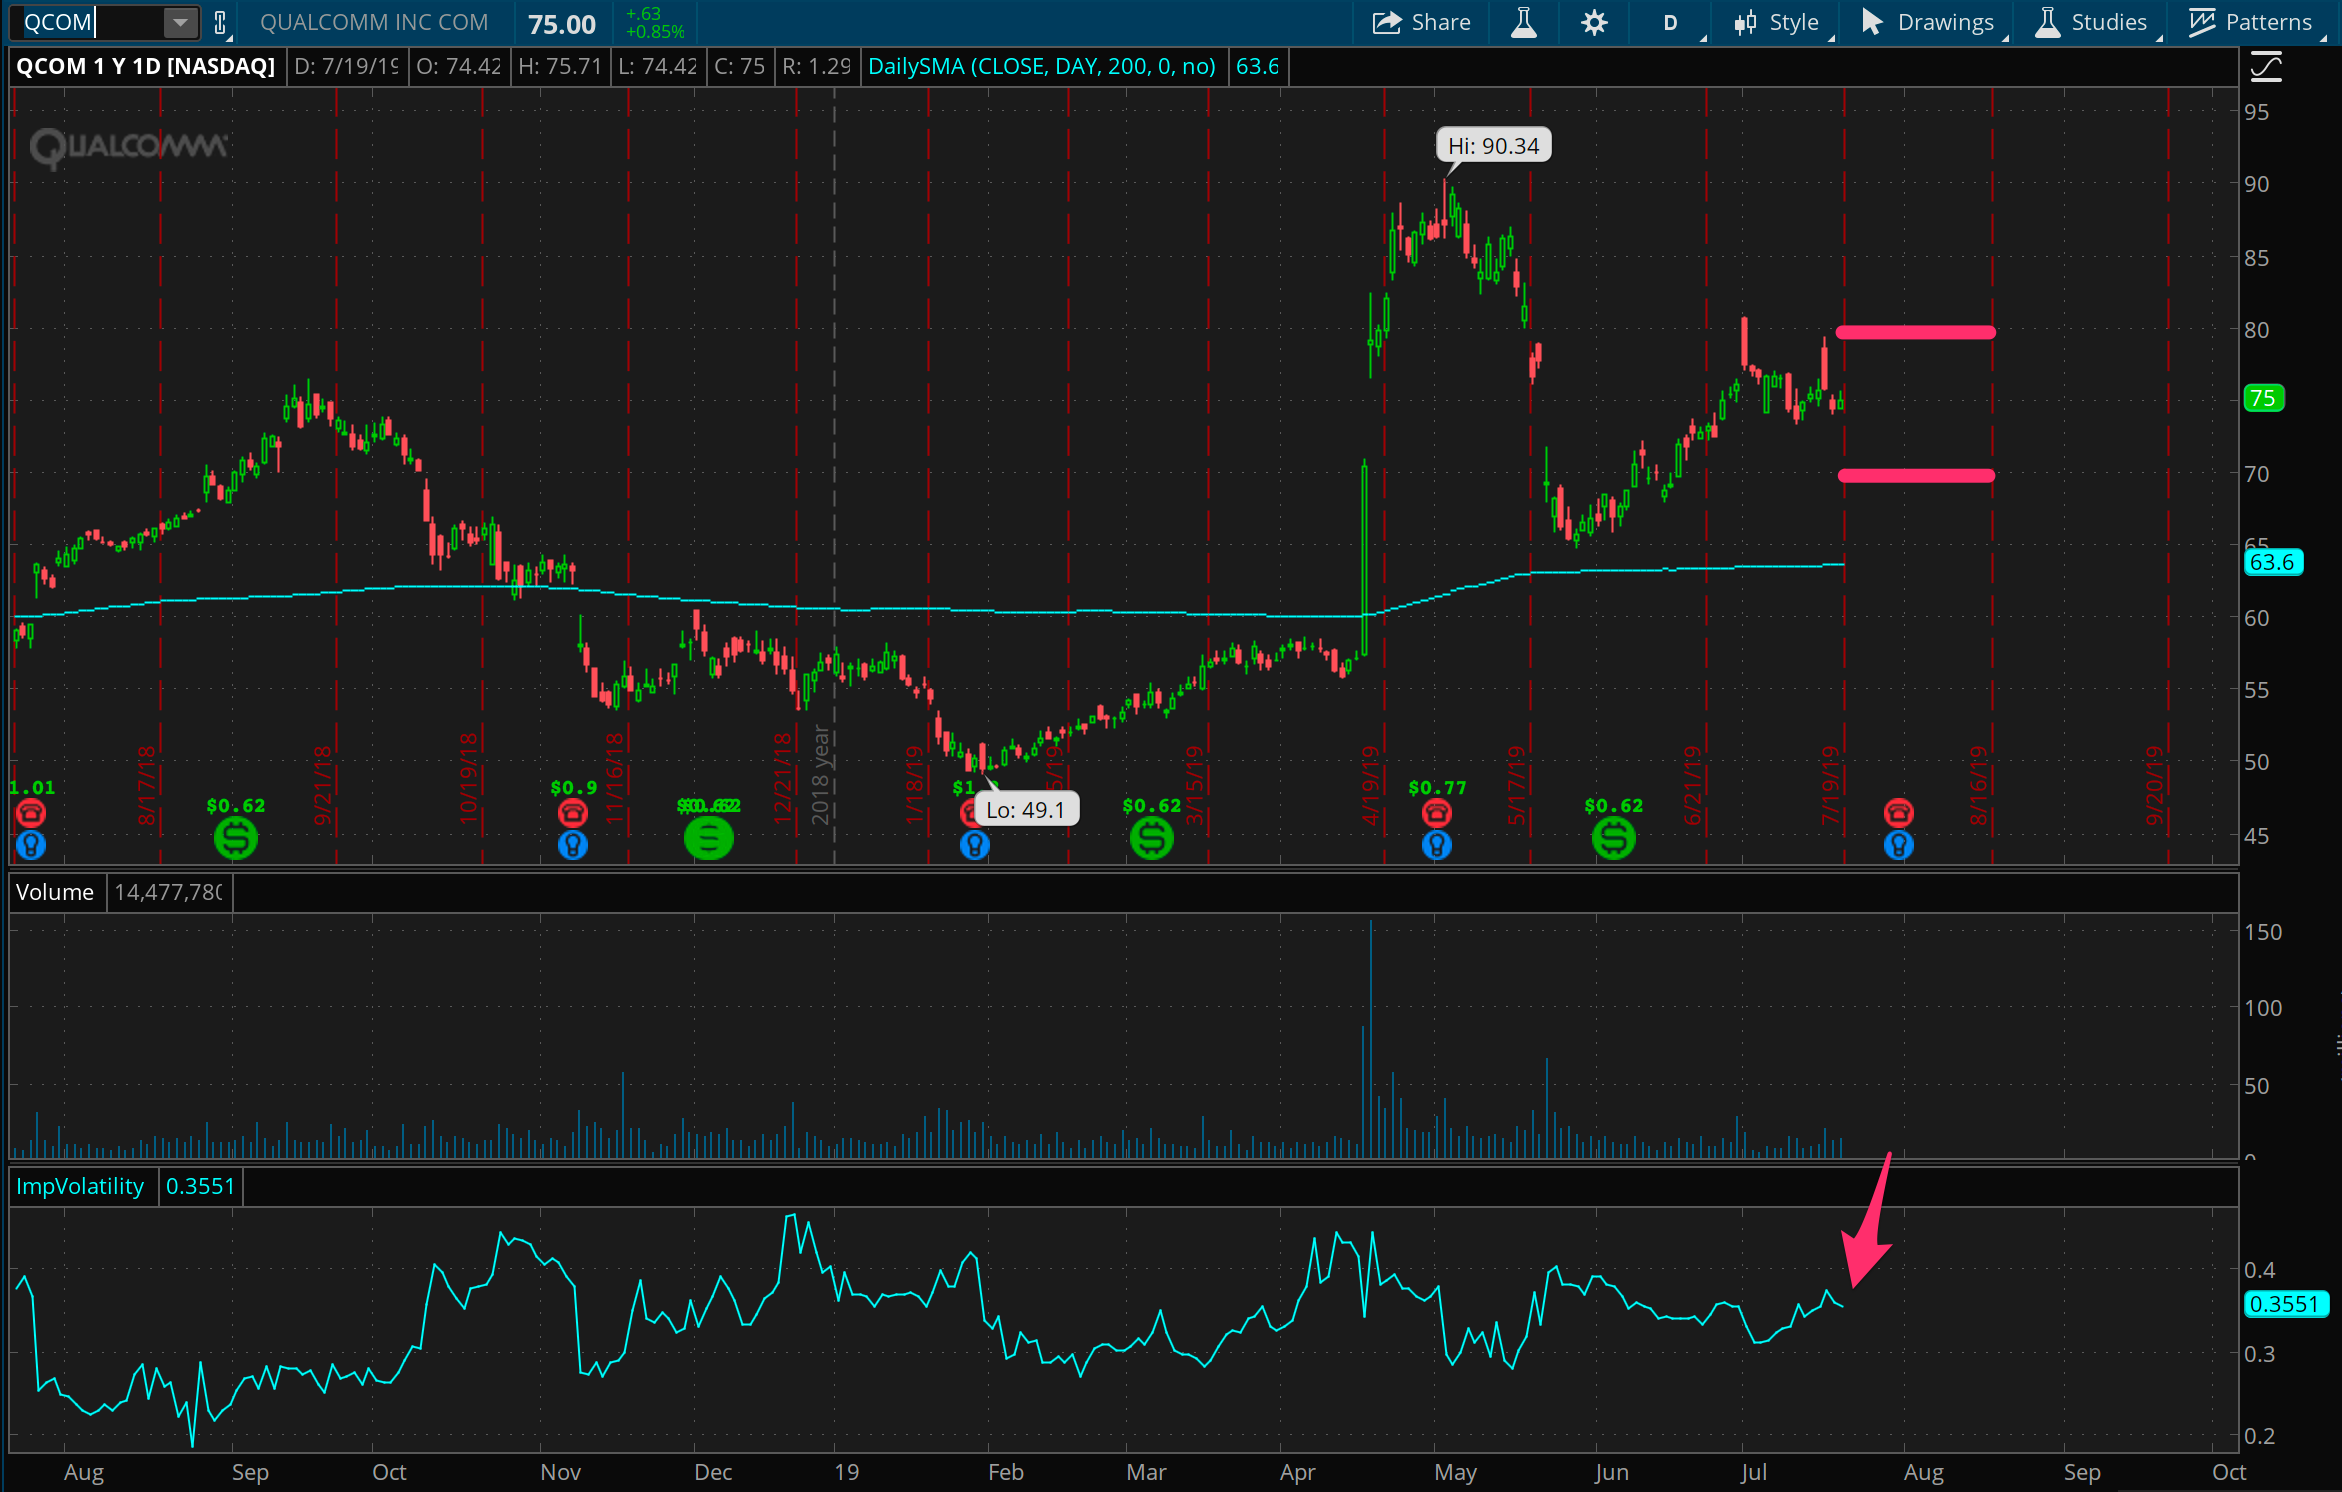
Same as the GLD trade above, I’ve put on a direction neutral trade in QCOM as well, to bet against the high implied volatility here. As with GLD, this is a defined risk play that I’m doing to test out playing with these types of positions, and I’ll keep you updated with how it goes.