Mystery Science SPX 3000
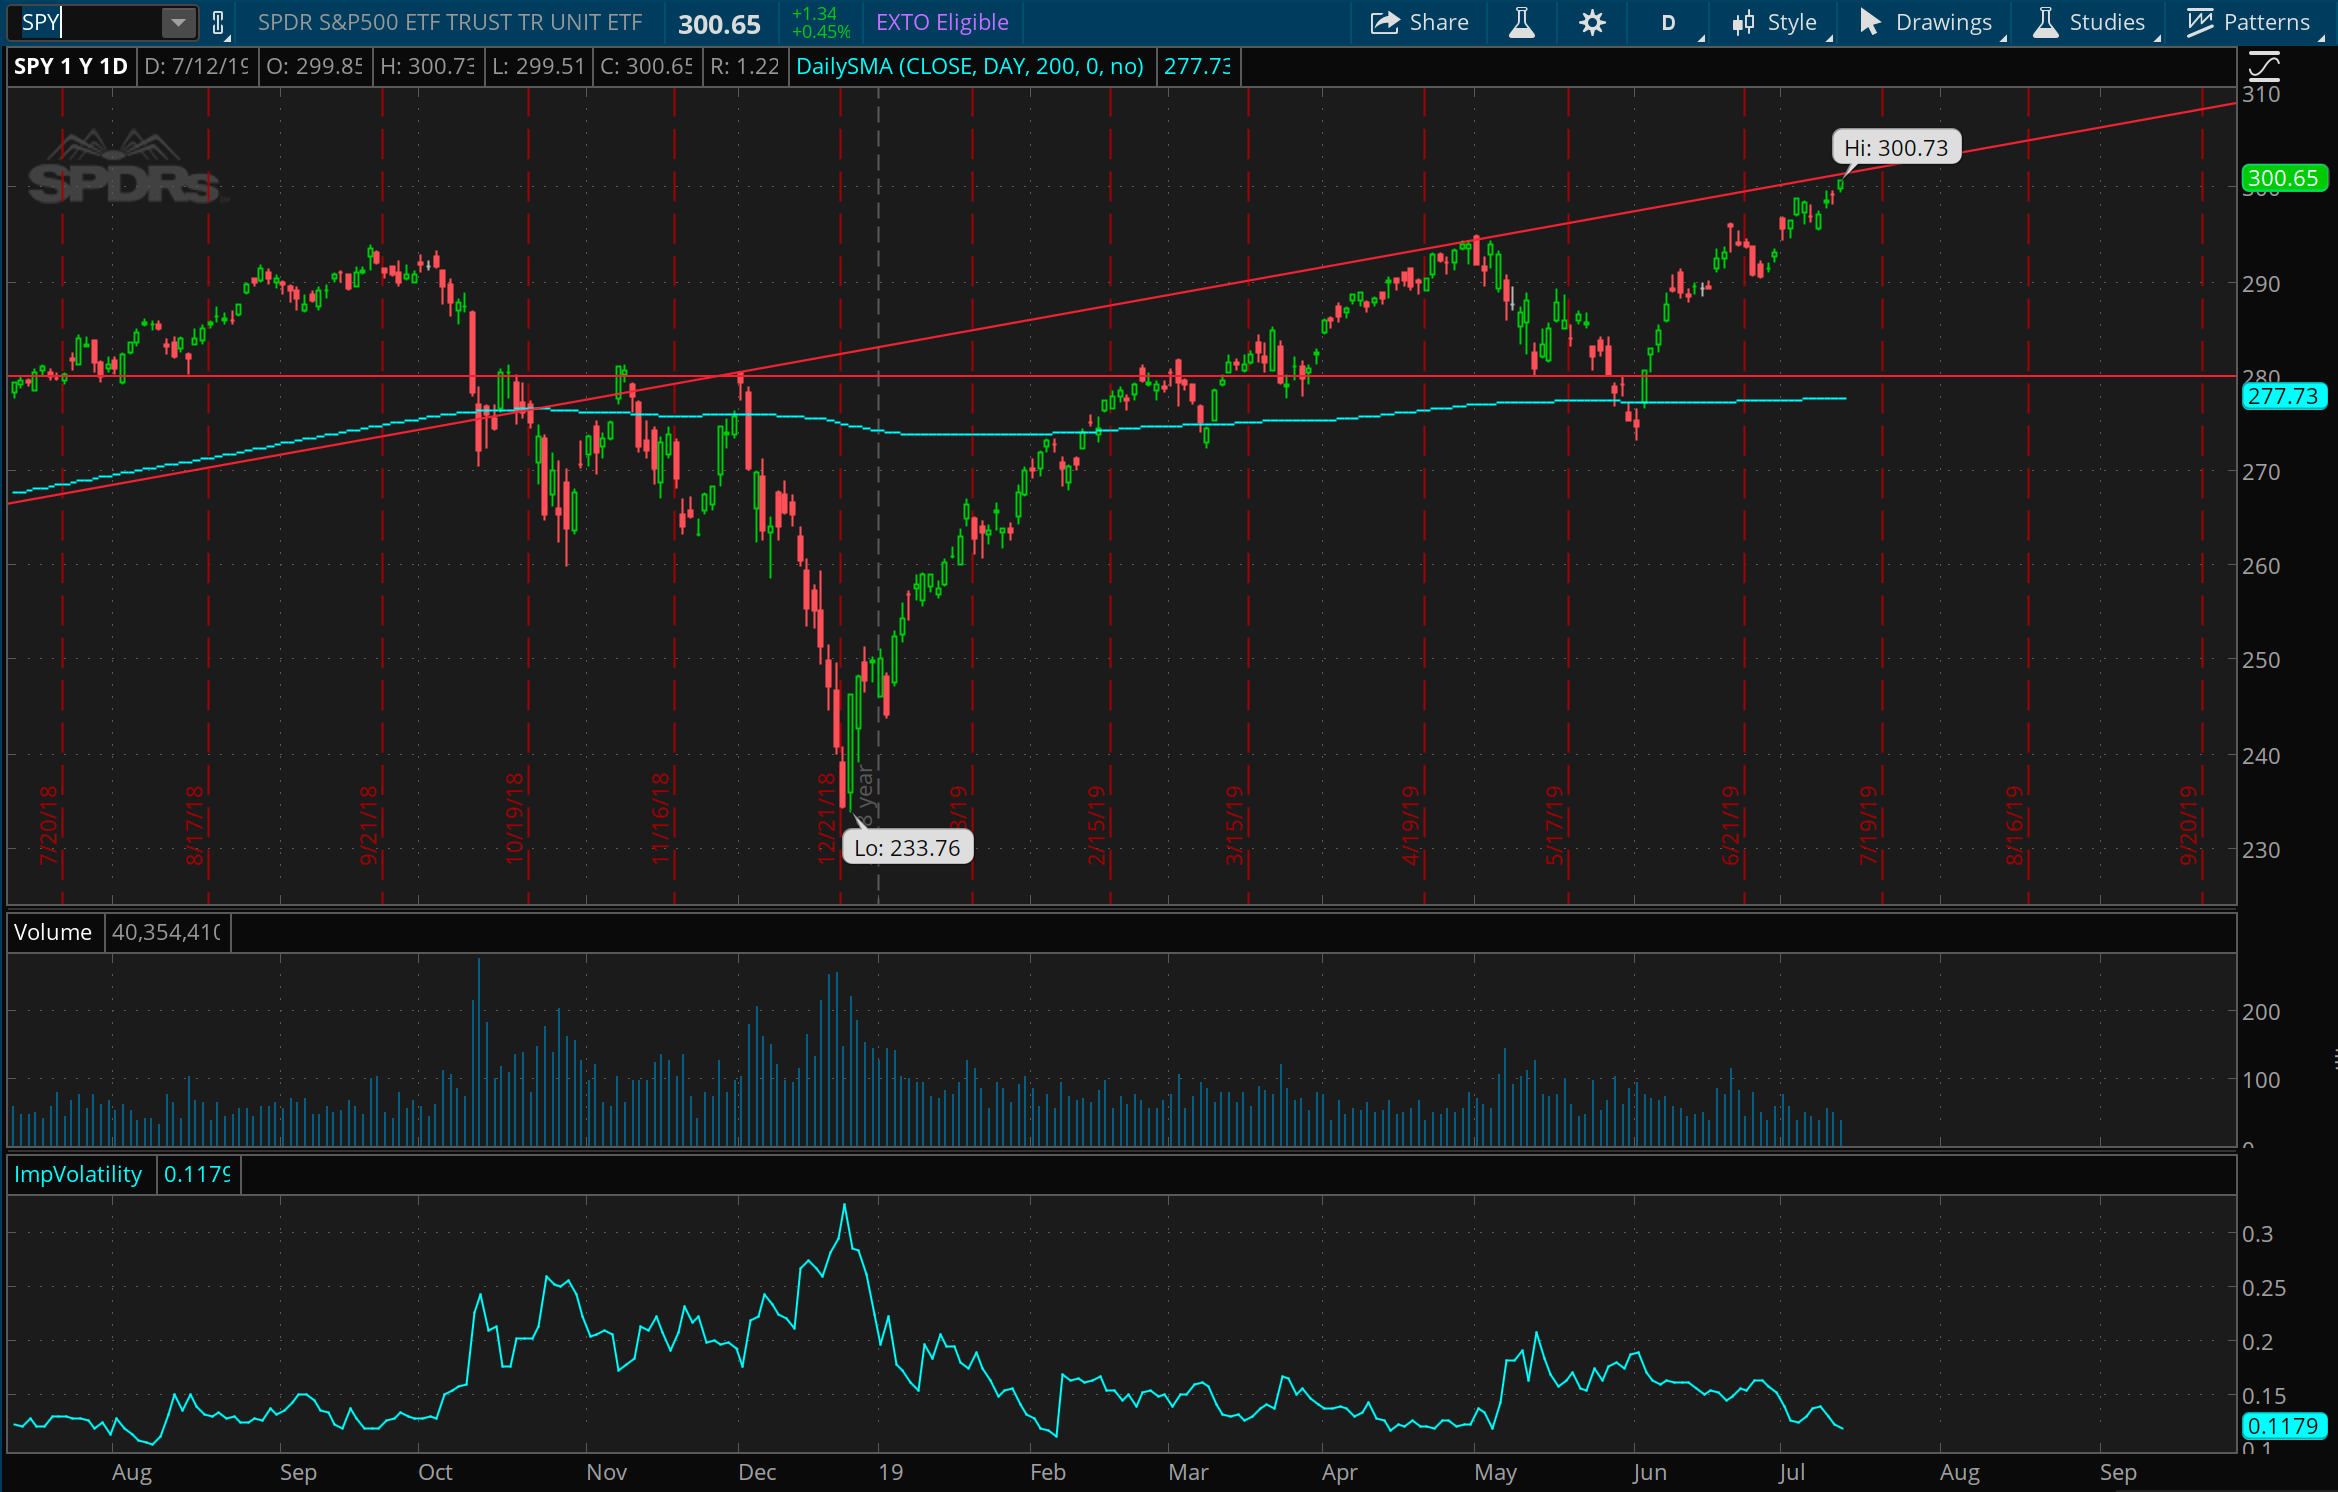
Prices love round numbers. They just do. If you’ve ever wondered whether markets were perfectly efficient or had something to do with psychology, just watch the behavior of prices near big round numbers. That said, we made it to 3000 in the S&P cash index, and consequently 300 here in the SPY. Look at this big stretch right up to the upper end of the channel. Looks very far from it’s moving average now. It could keep grinding higher, but I’d bet on a slow grind up. At this level, we should see a lot more velocity to the downside if it heads lower from here.
The AAPL turn over
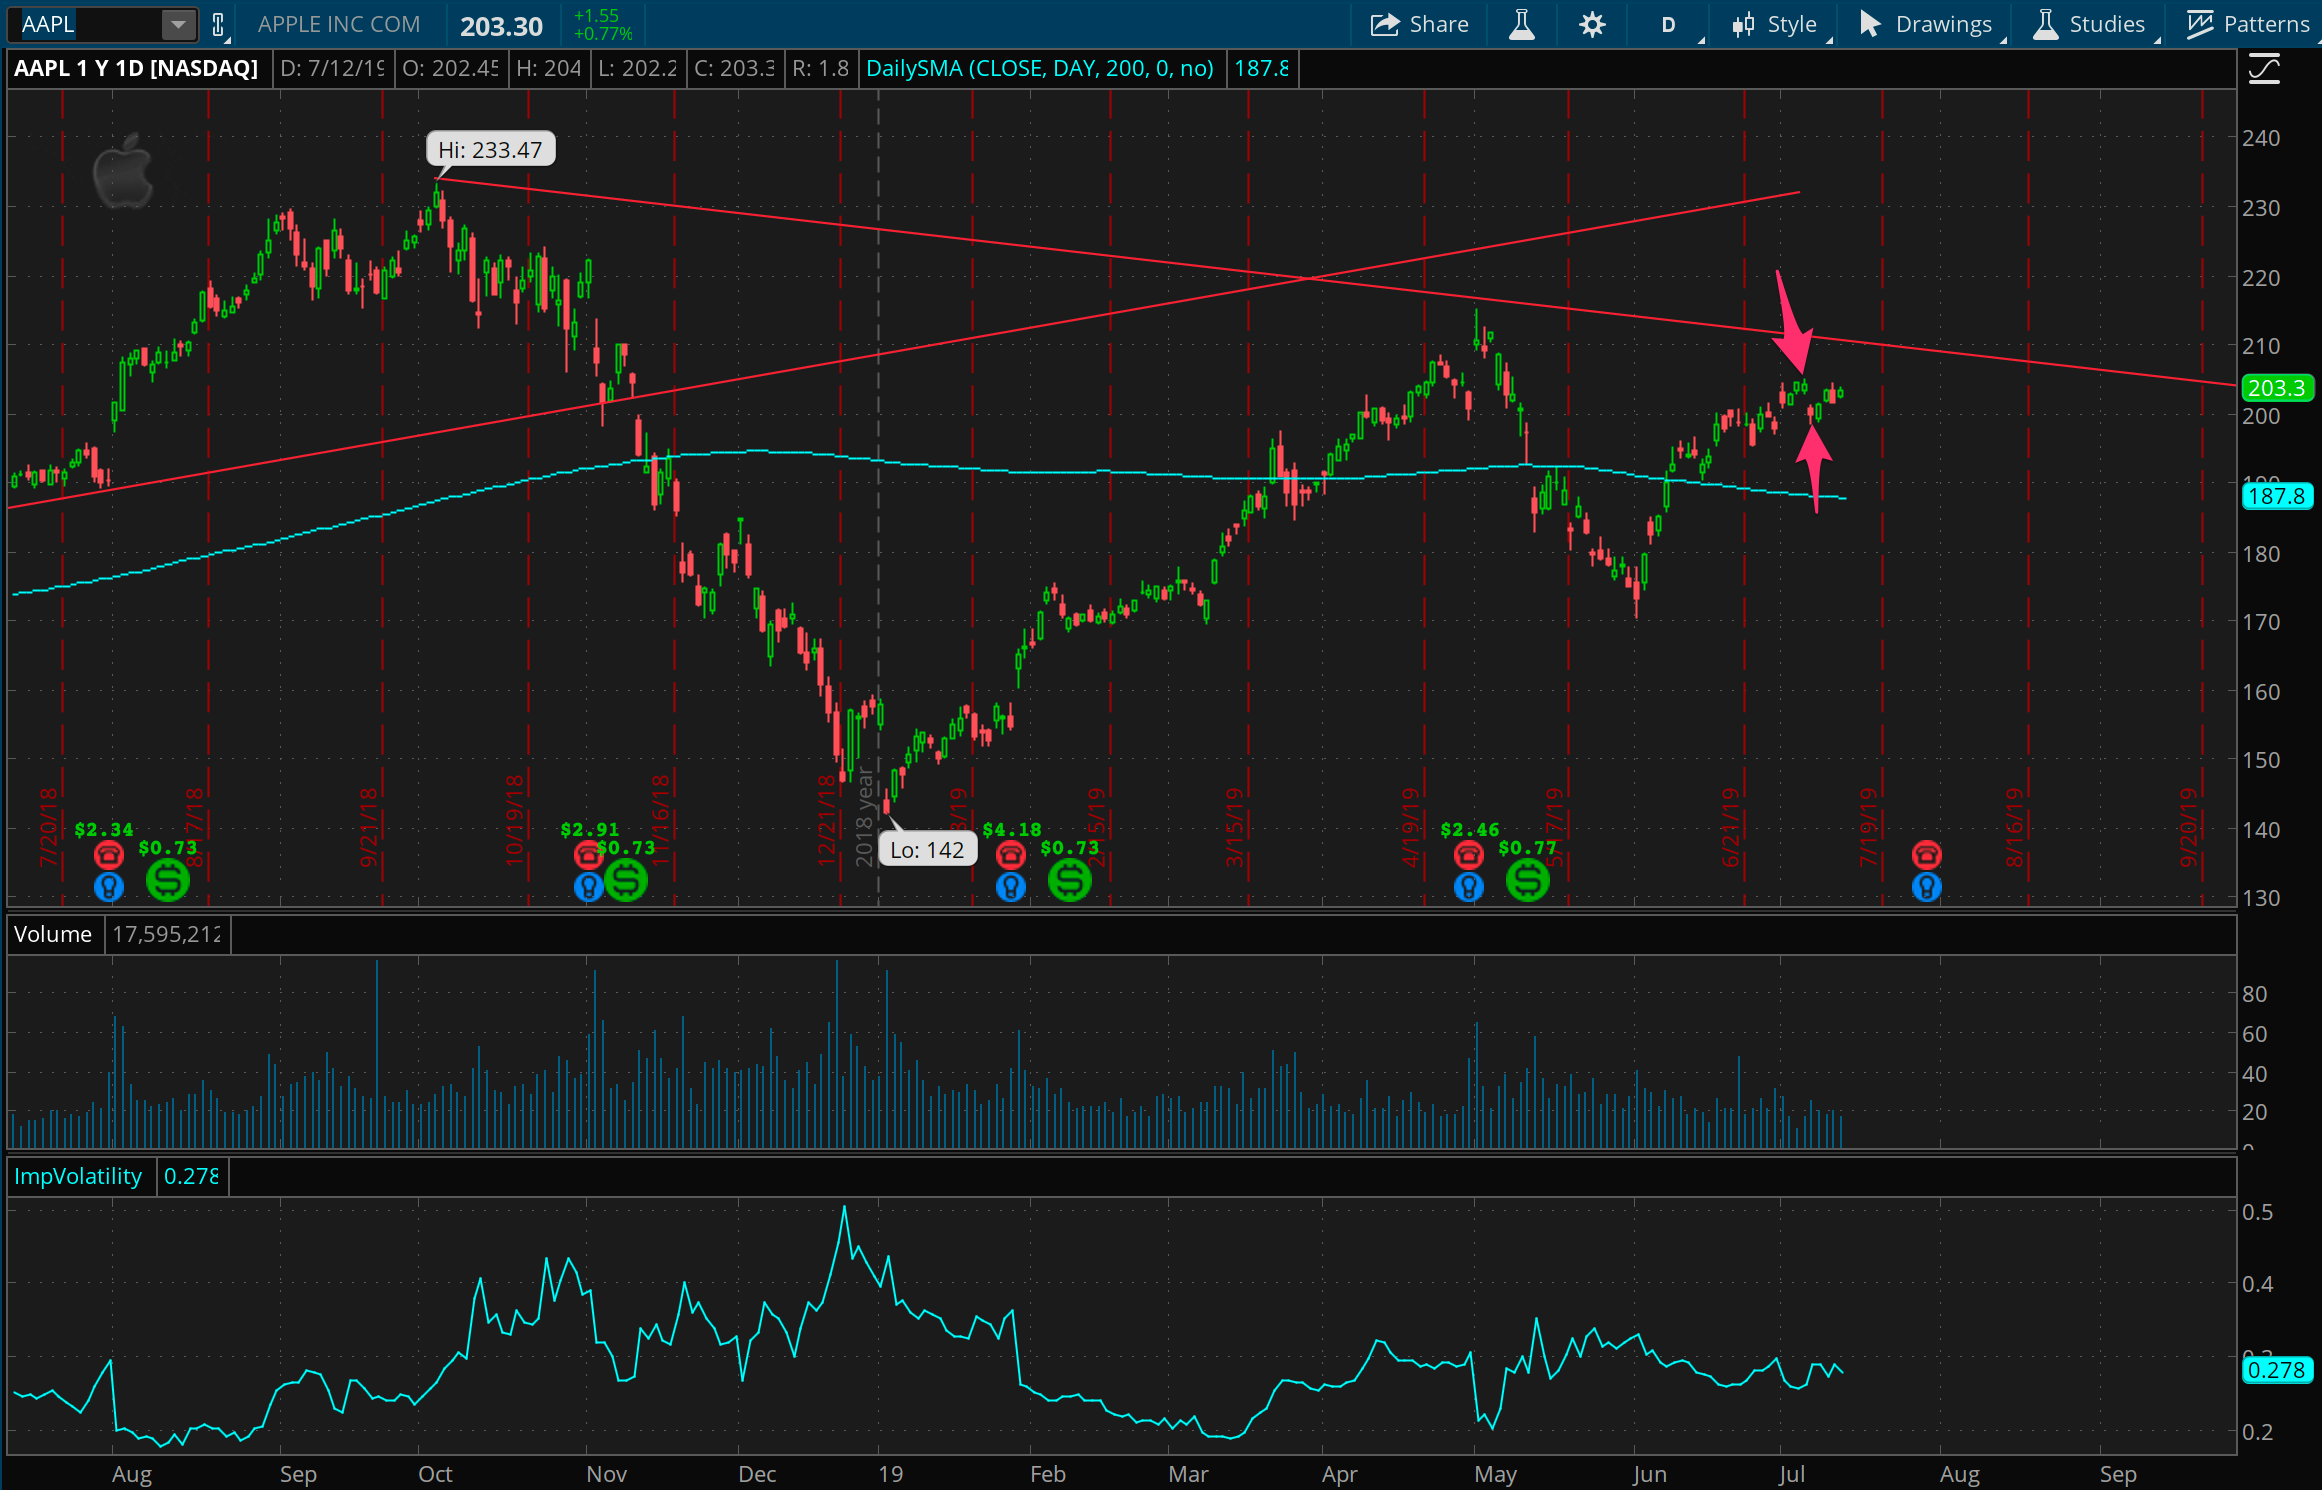
After a coule successful jumps in and out of AAPL over the last few weeks, I took a third swing at AAPL late last week with a call spread at 210. I continue to think that AAPL has more resistance than support at these levels, but this was a lucky break to get such a quick turn around on this trade. I’ll keep looking for another chance to reload, but noting that AAPL has earnings coming up which could shake it out of it’s pattern here.
The Brazilian breakout, for sure this time
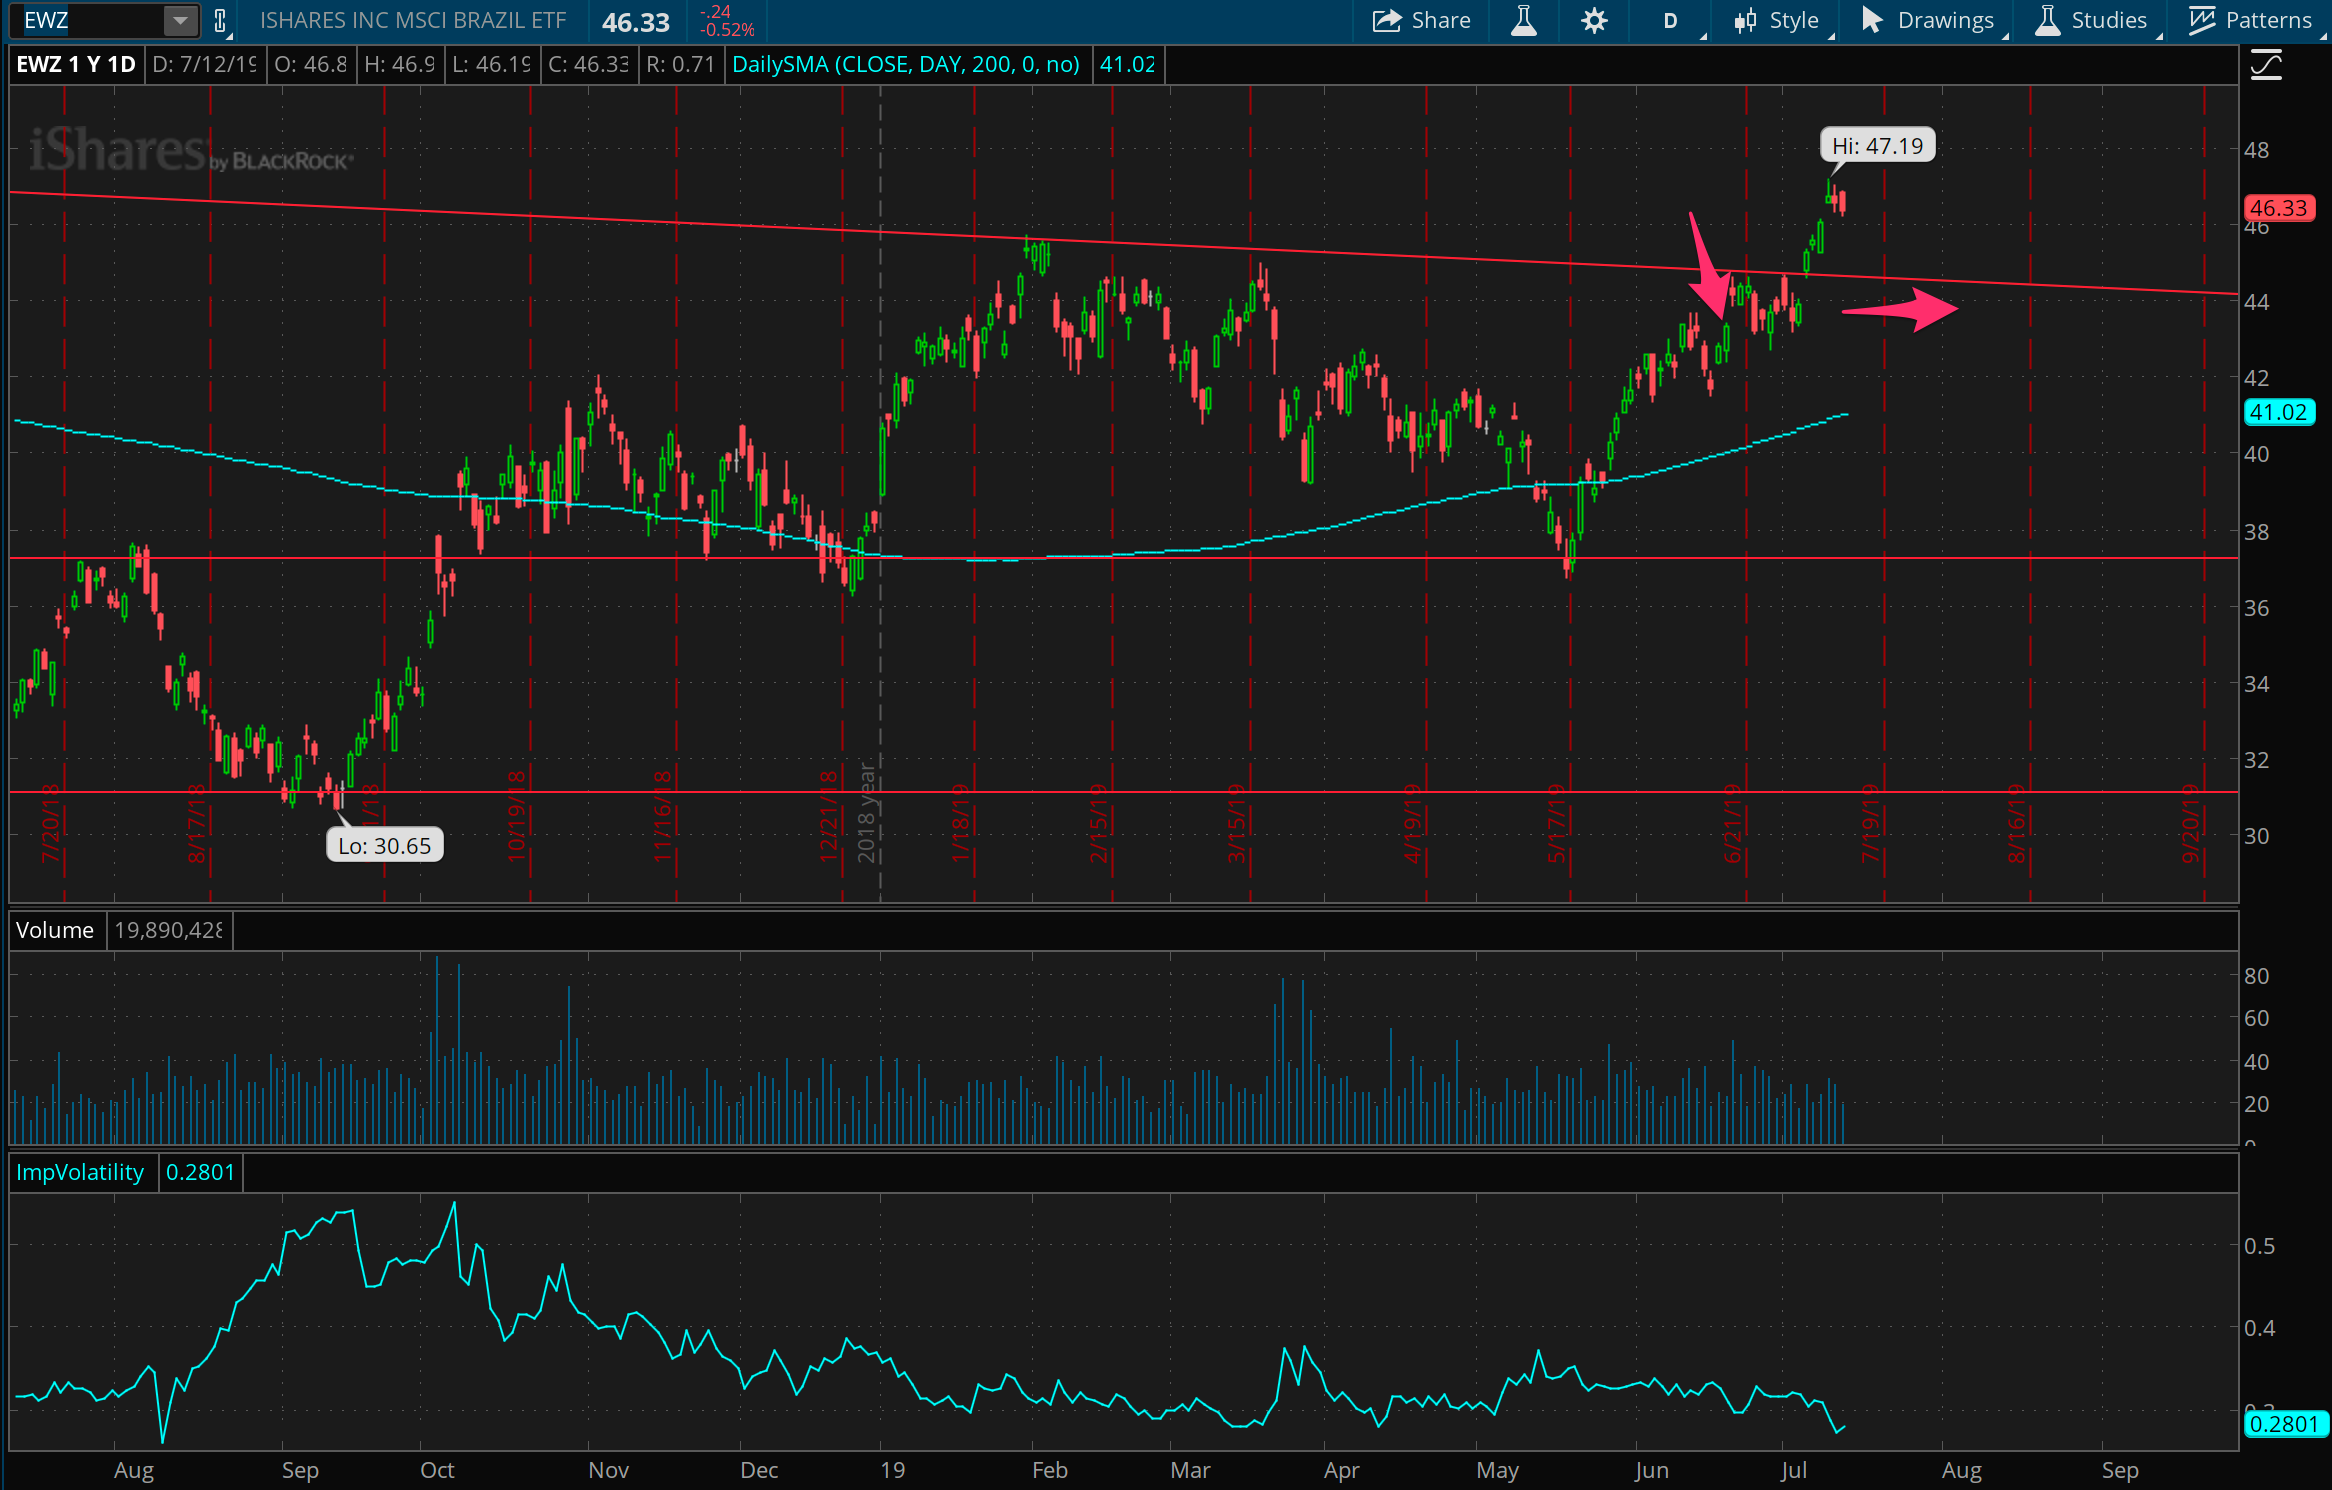
Ok, well, this looks like a failed trade. The general thesis of this trade, that this downward trendline would keep EWZ under 44, has been disproven with a huge jump over that resistance. The prior highs around 45 may very well likely become a place of support now, and generally I’m interested in getting out of this trade now. I rolled my call spread at 44 out to August to buy some time, thinking we may see prices return back to the 44 / 45 area before bouncing off and continuing upward.
Builders too
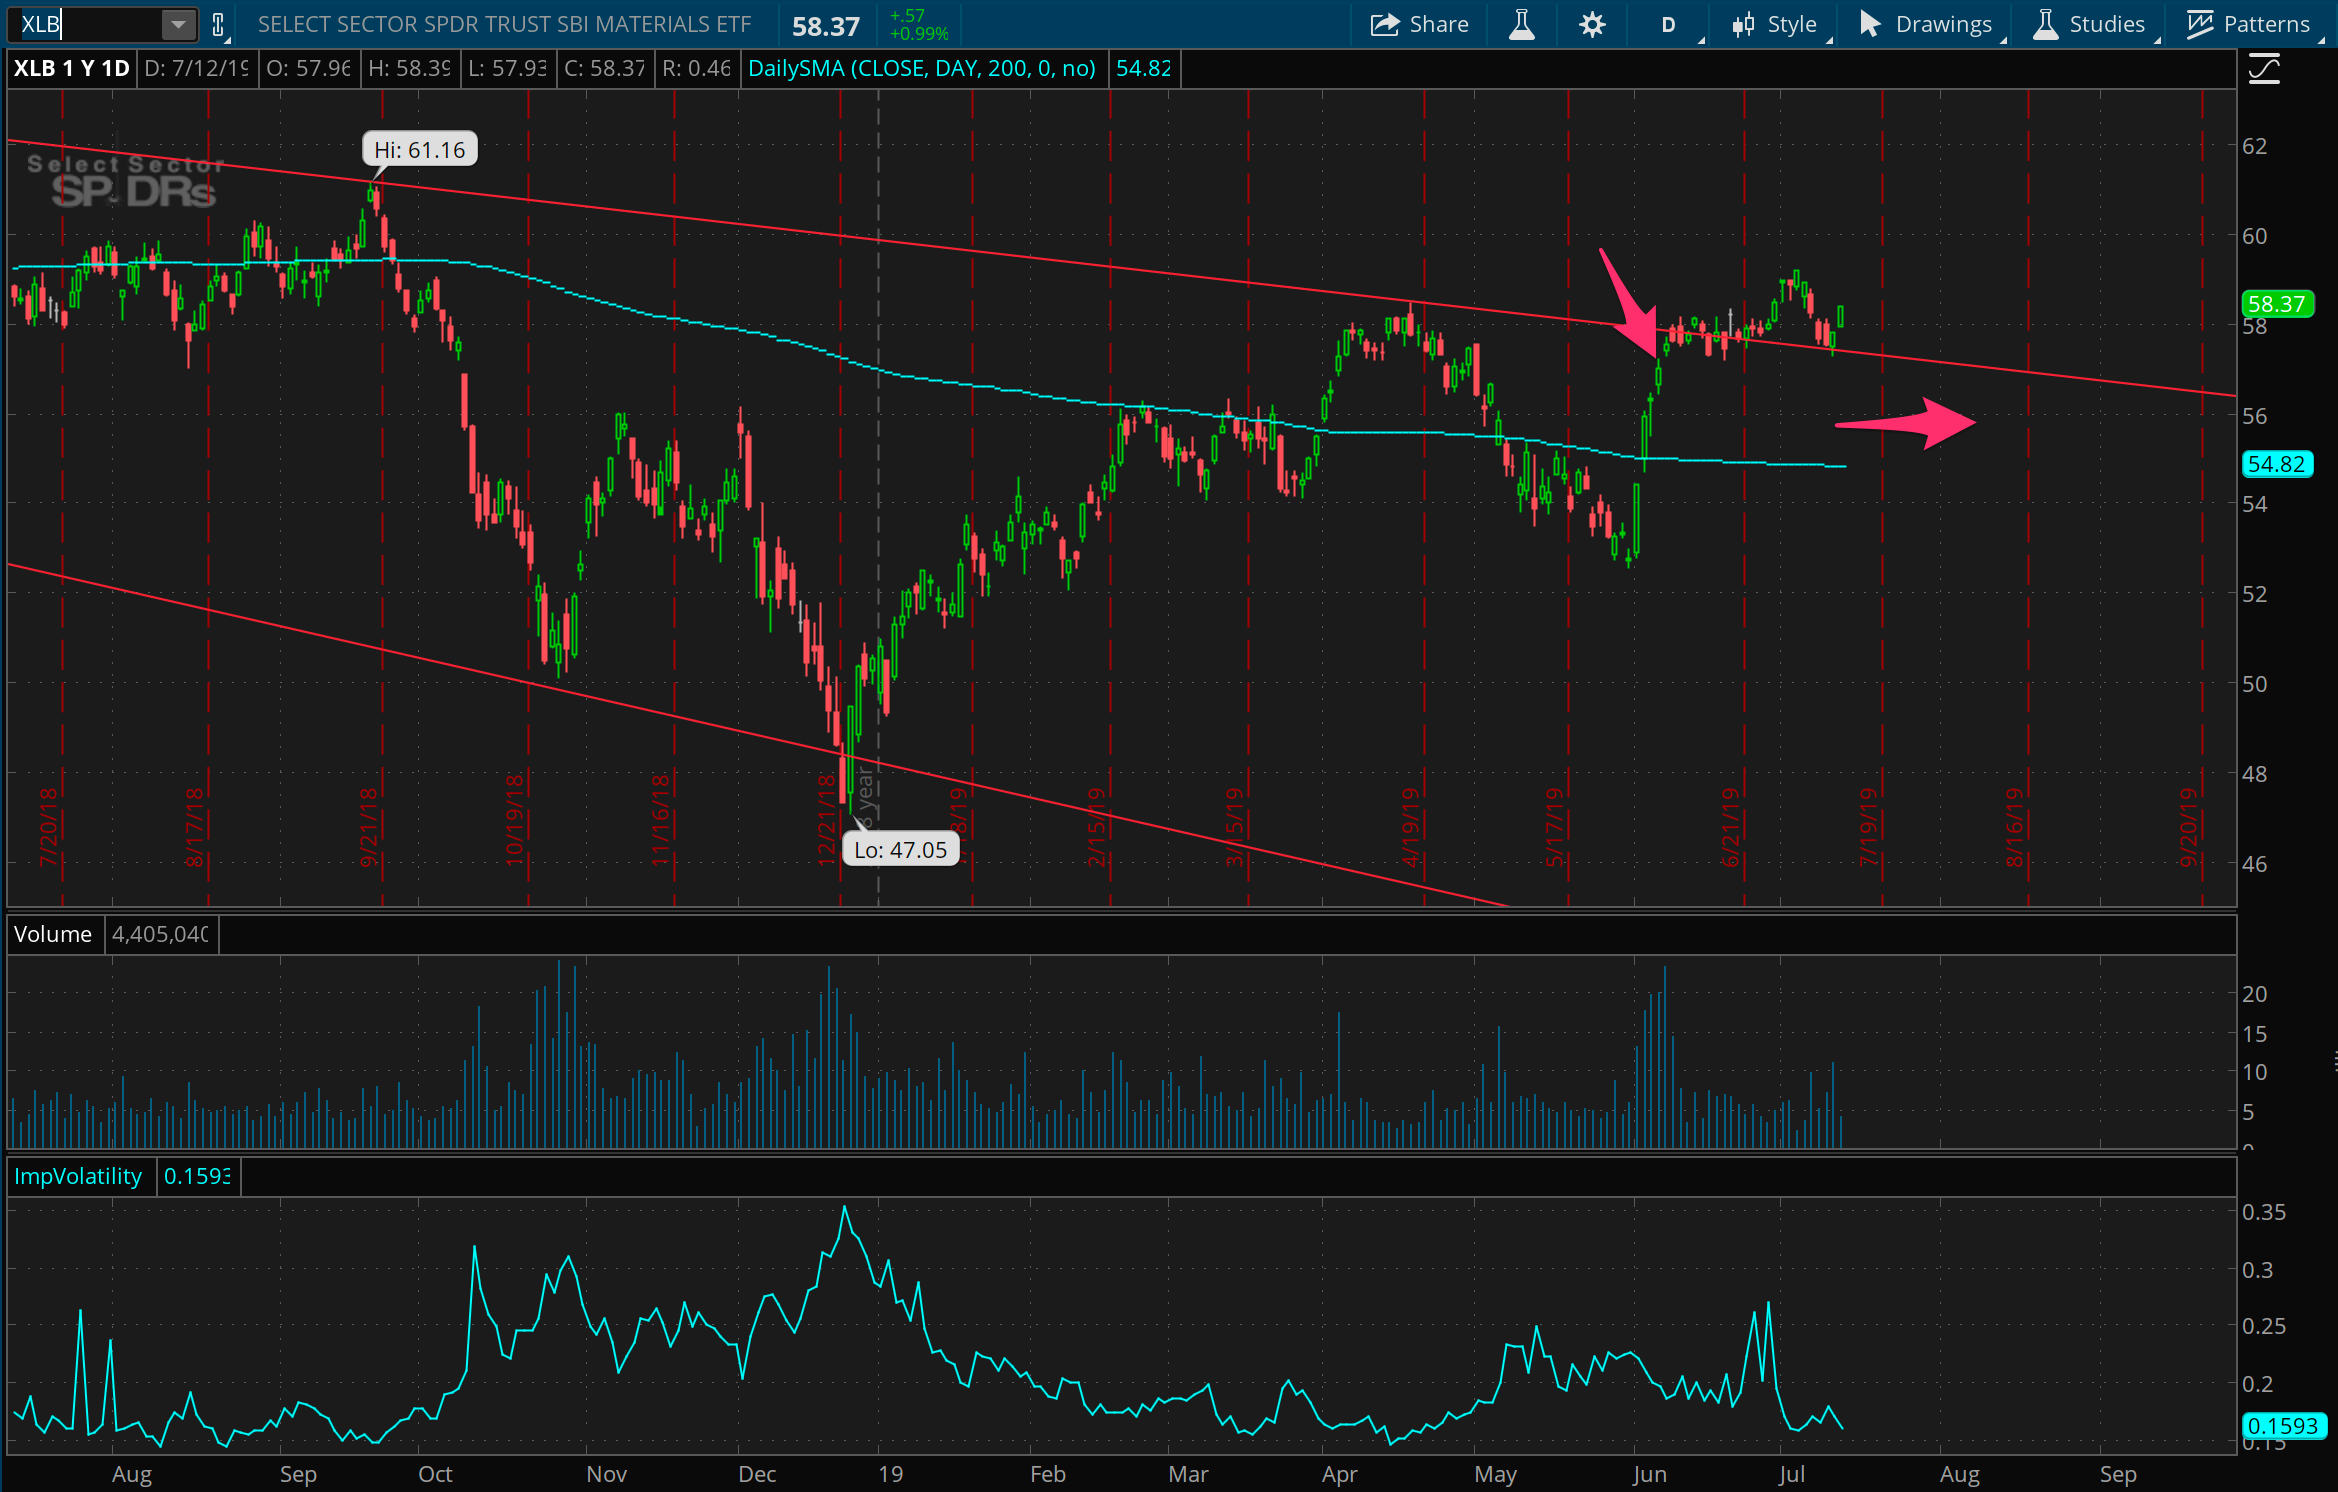
This builders ETF isn’t looking so good either in terms of broken trade thesis. After fighting against the overhead trendline for a couple weeks, it’s broken out above it and even bounced off of it now. I’ve rolled this trade forward in time, and will be watching intently to see how this acts in the event of a bigger market pull back. This still feels like it’s got some resistance around this 58 - 60 range, so we could see it head down after this monster rally it’s had.
Second verse same as the first
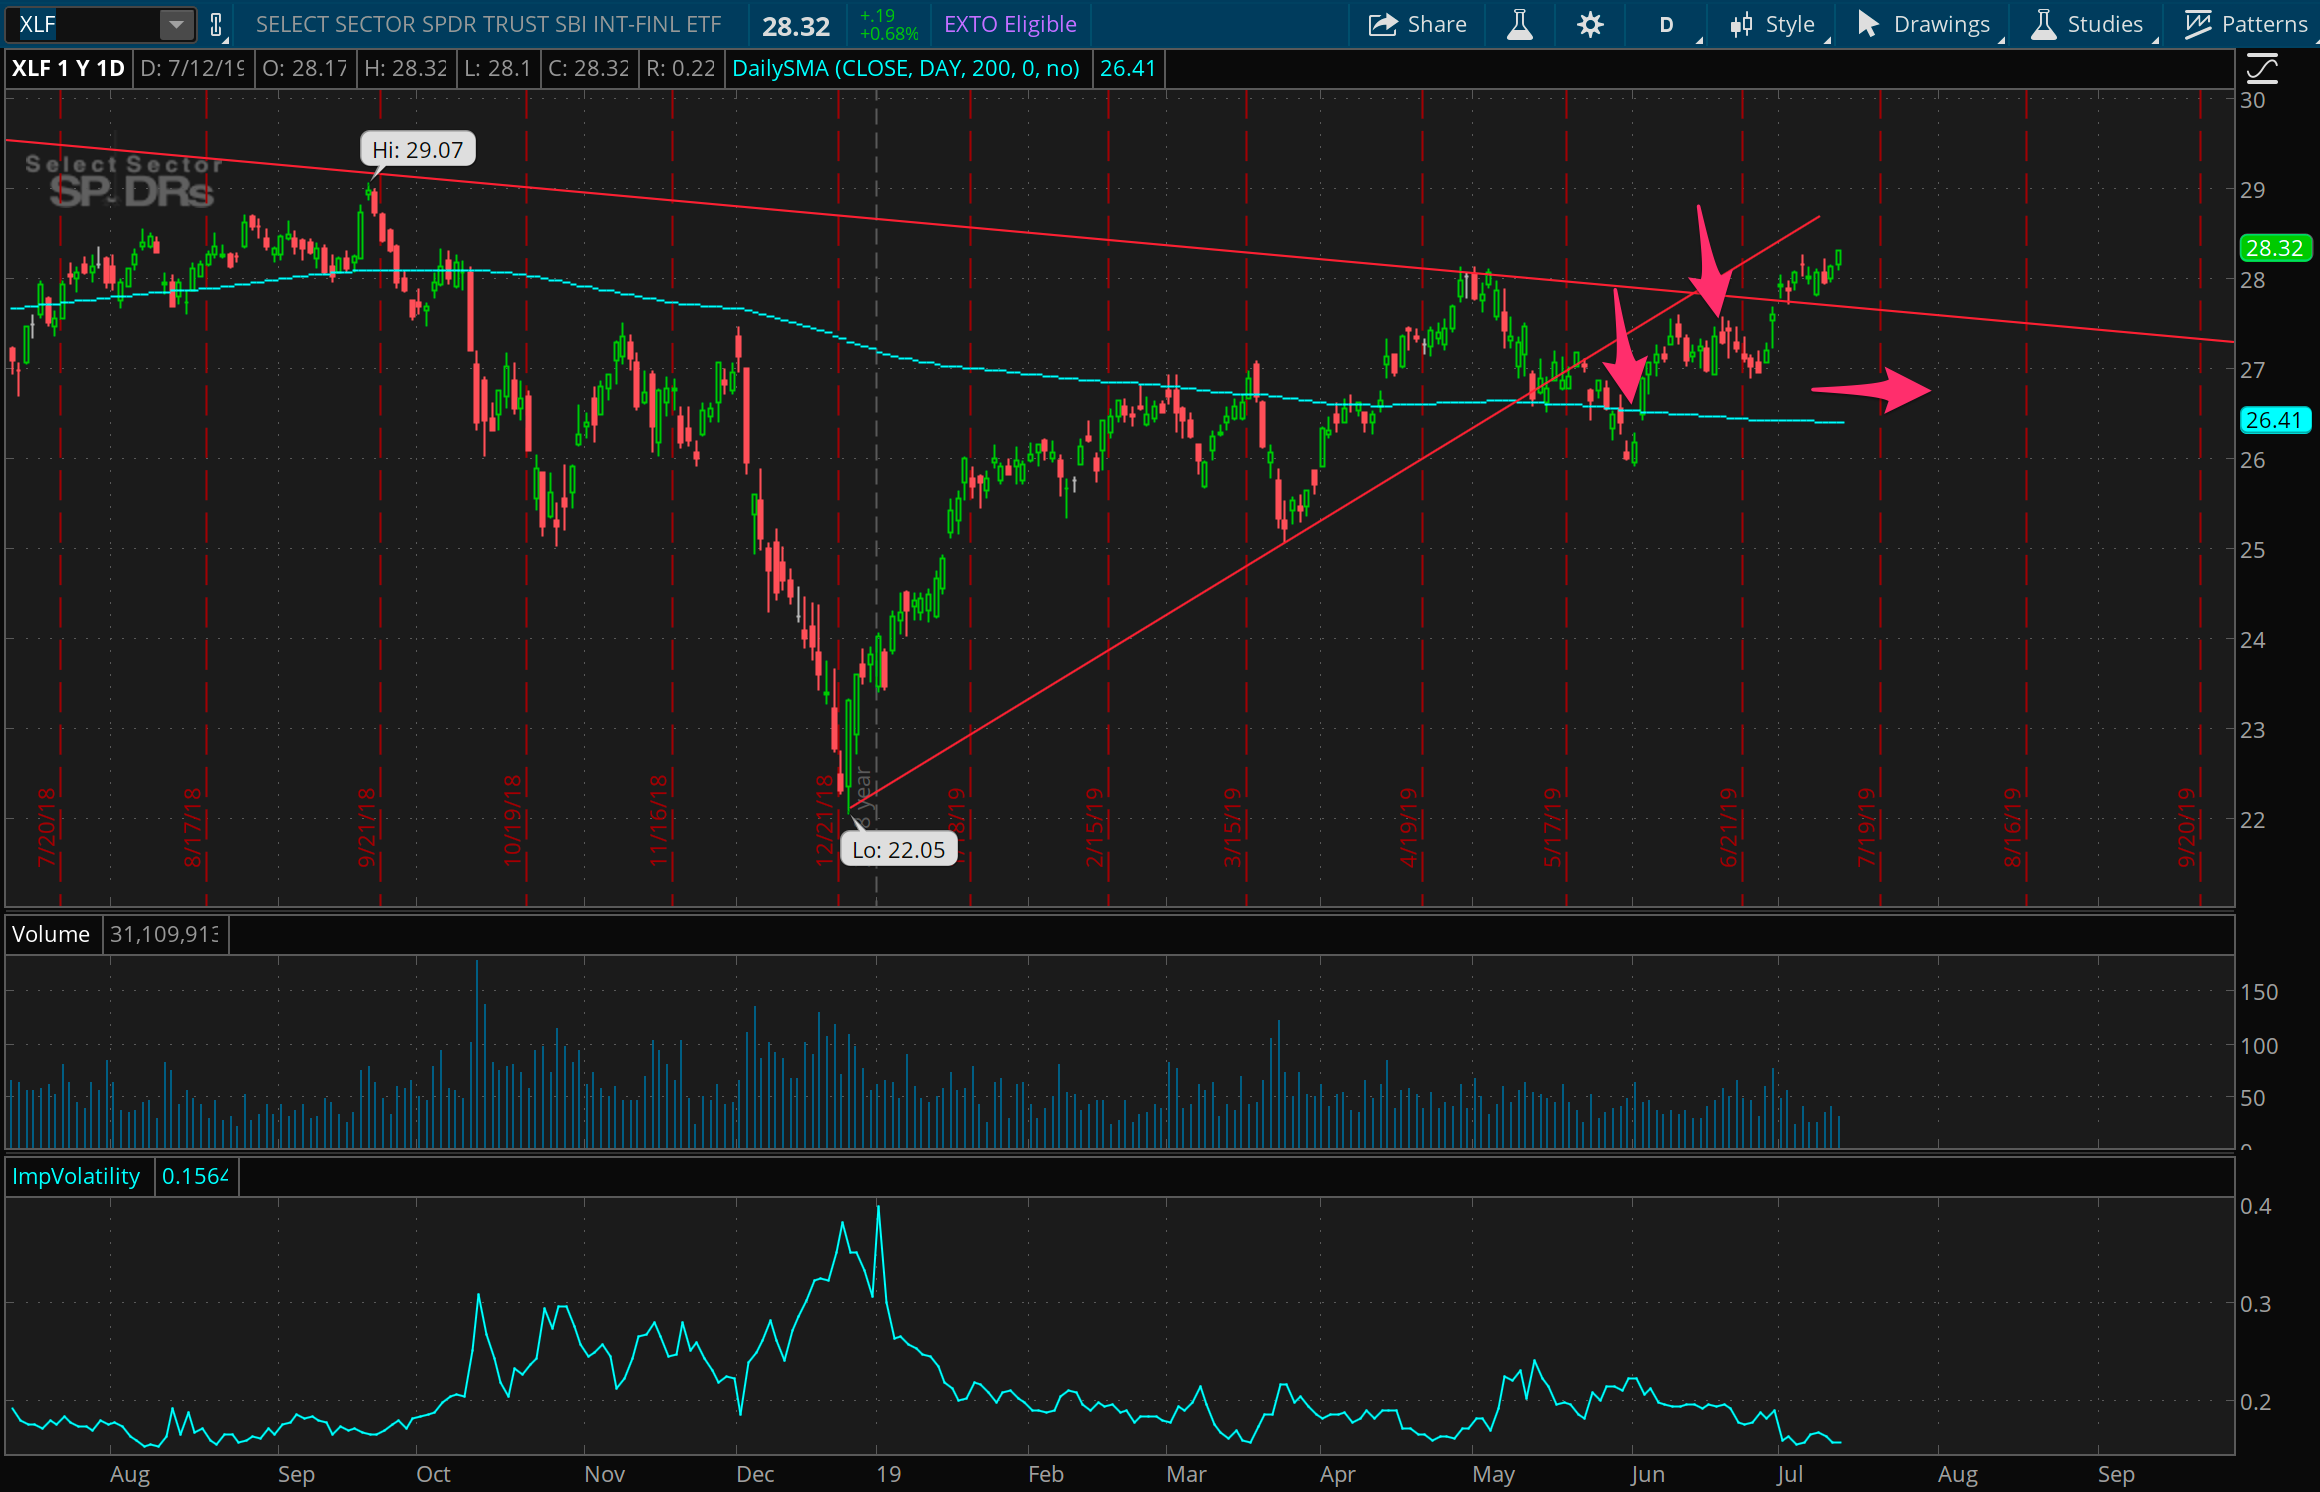
More rolling out in time for trades that are being tested. This short trade in XLF isn’t looking good, though it’s got nearly the same setup and behavior to it as the XLB trade above. It’s broken out of the overhead resistance line around 27.5, but still faces some resistance from previous highs in the 28 - 29 range. This, like XLB, is becoming a play on a general market downturn, with the hopes to just get out of this trade for a scratch.
NFLX resistance

Where the overhead resistance trade thesis in XLB and XLF are being disproven, the overhead top of the range in NFLX is instead being proven. Look at how prices pushed up and were deflected right at the 385 level for now the fourth time after the price level was defined a year ago from a big gap down after earnings. With earnings coming up again, the anniversary of this gap and definition of this major resistance level, will we see another swing down? Hard to say, but I’m betting on it, adding to this overhead resistance play (via a call spread at 380) and putting some time in it by rolling it out to August.
So nice do it twice
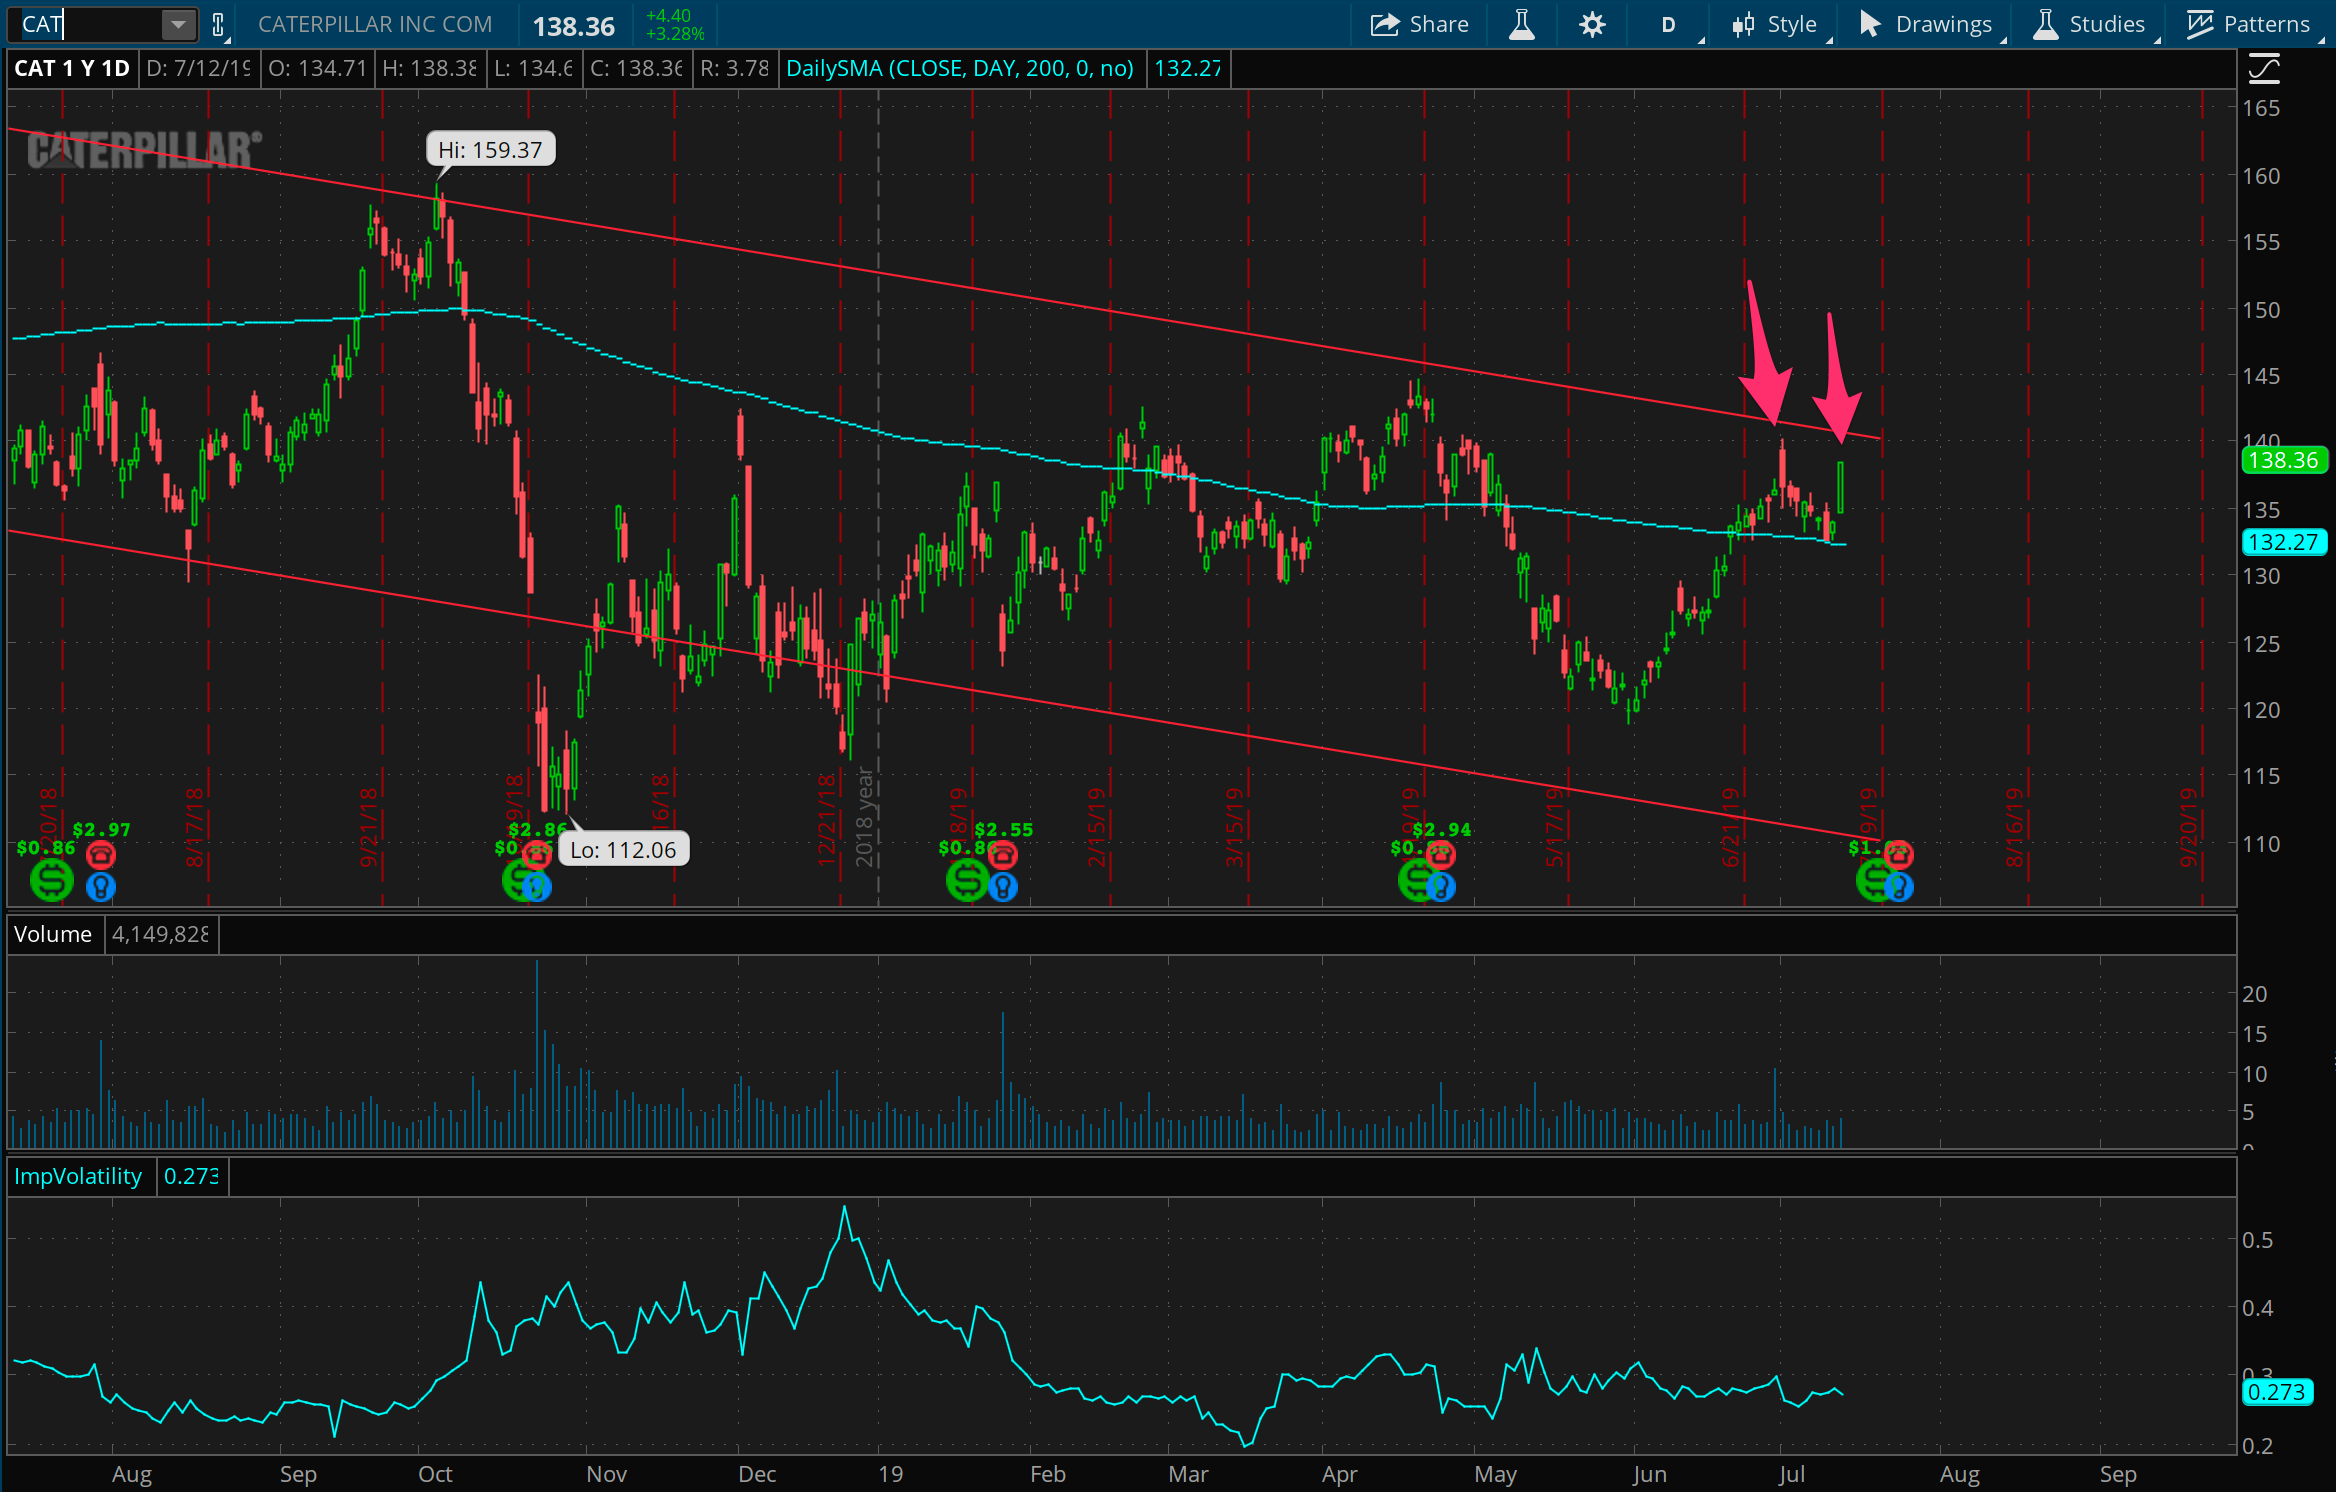
This CAT trade looked so good when I put it on early last week, running up to nearly the top of a major downward price channel that’s been in place for nearly two years. Since then it steadily complied, falling back from the overhead resistance. But then it bounced right off of the 200 day moving average and back up to this same resistance line again. Well, if the trade setup was good last week, it seems to be good this week too, so I added to this position, and put a bit more on to this call spread at 140. With earnings coming up, this could certainly break, but the past 4 earnings events have all been downward, and price has been up, so I like the odds.
Energy for a trade
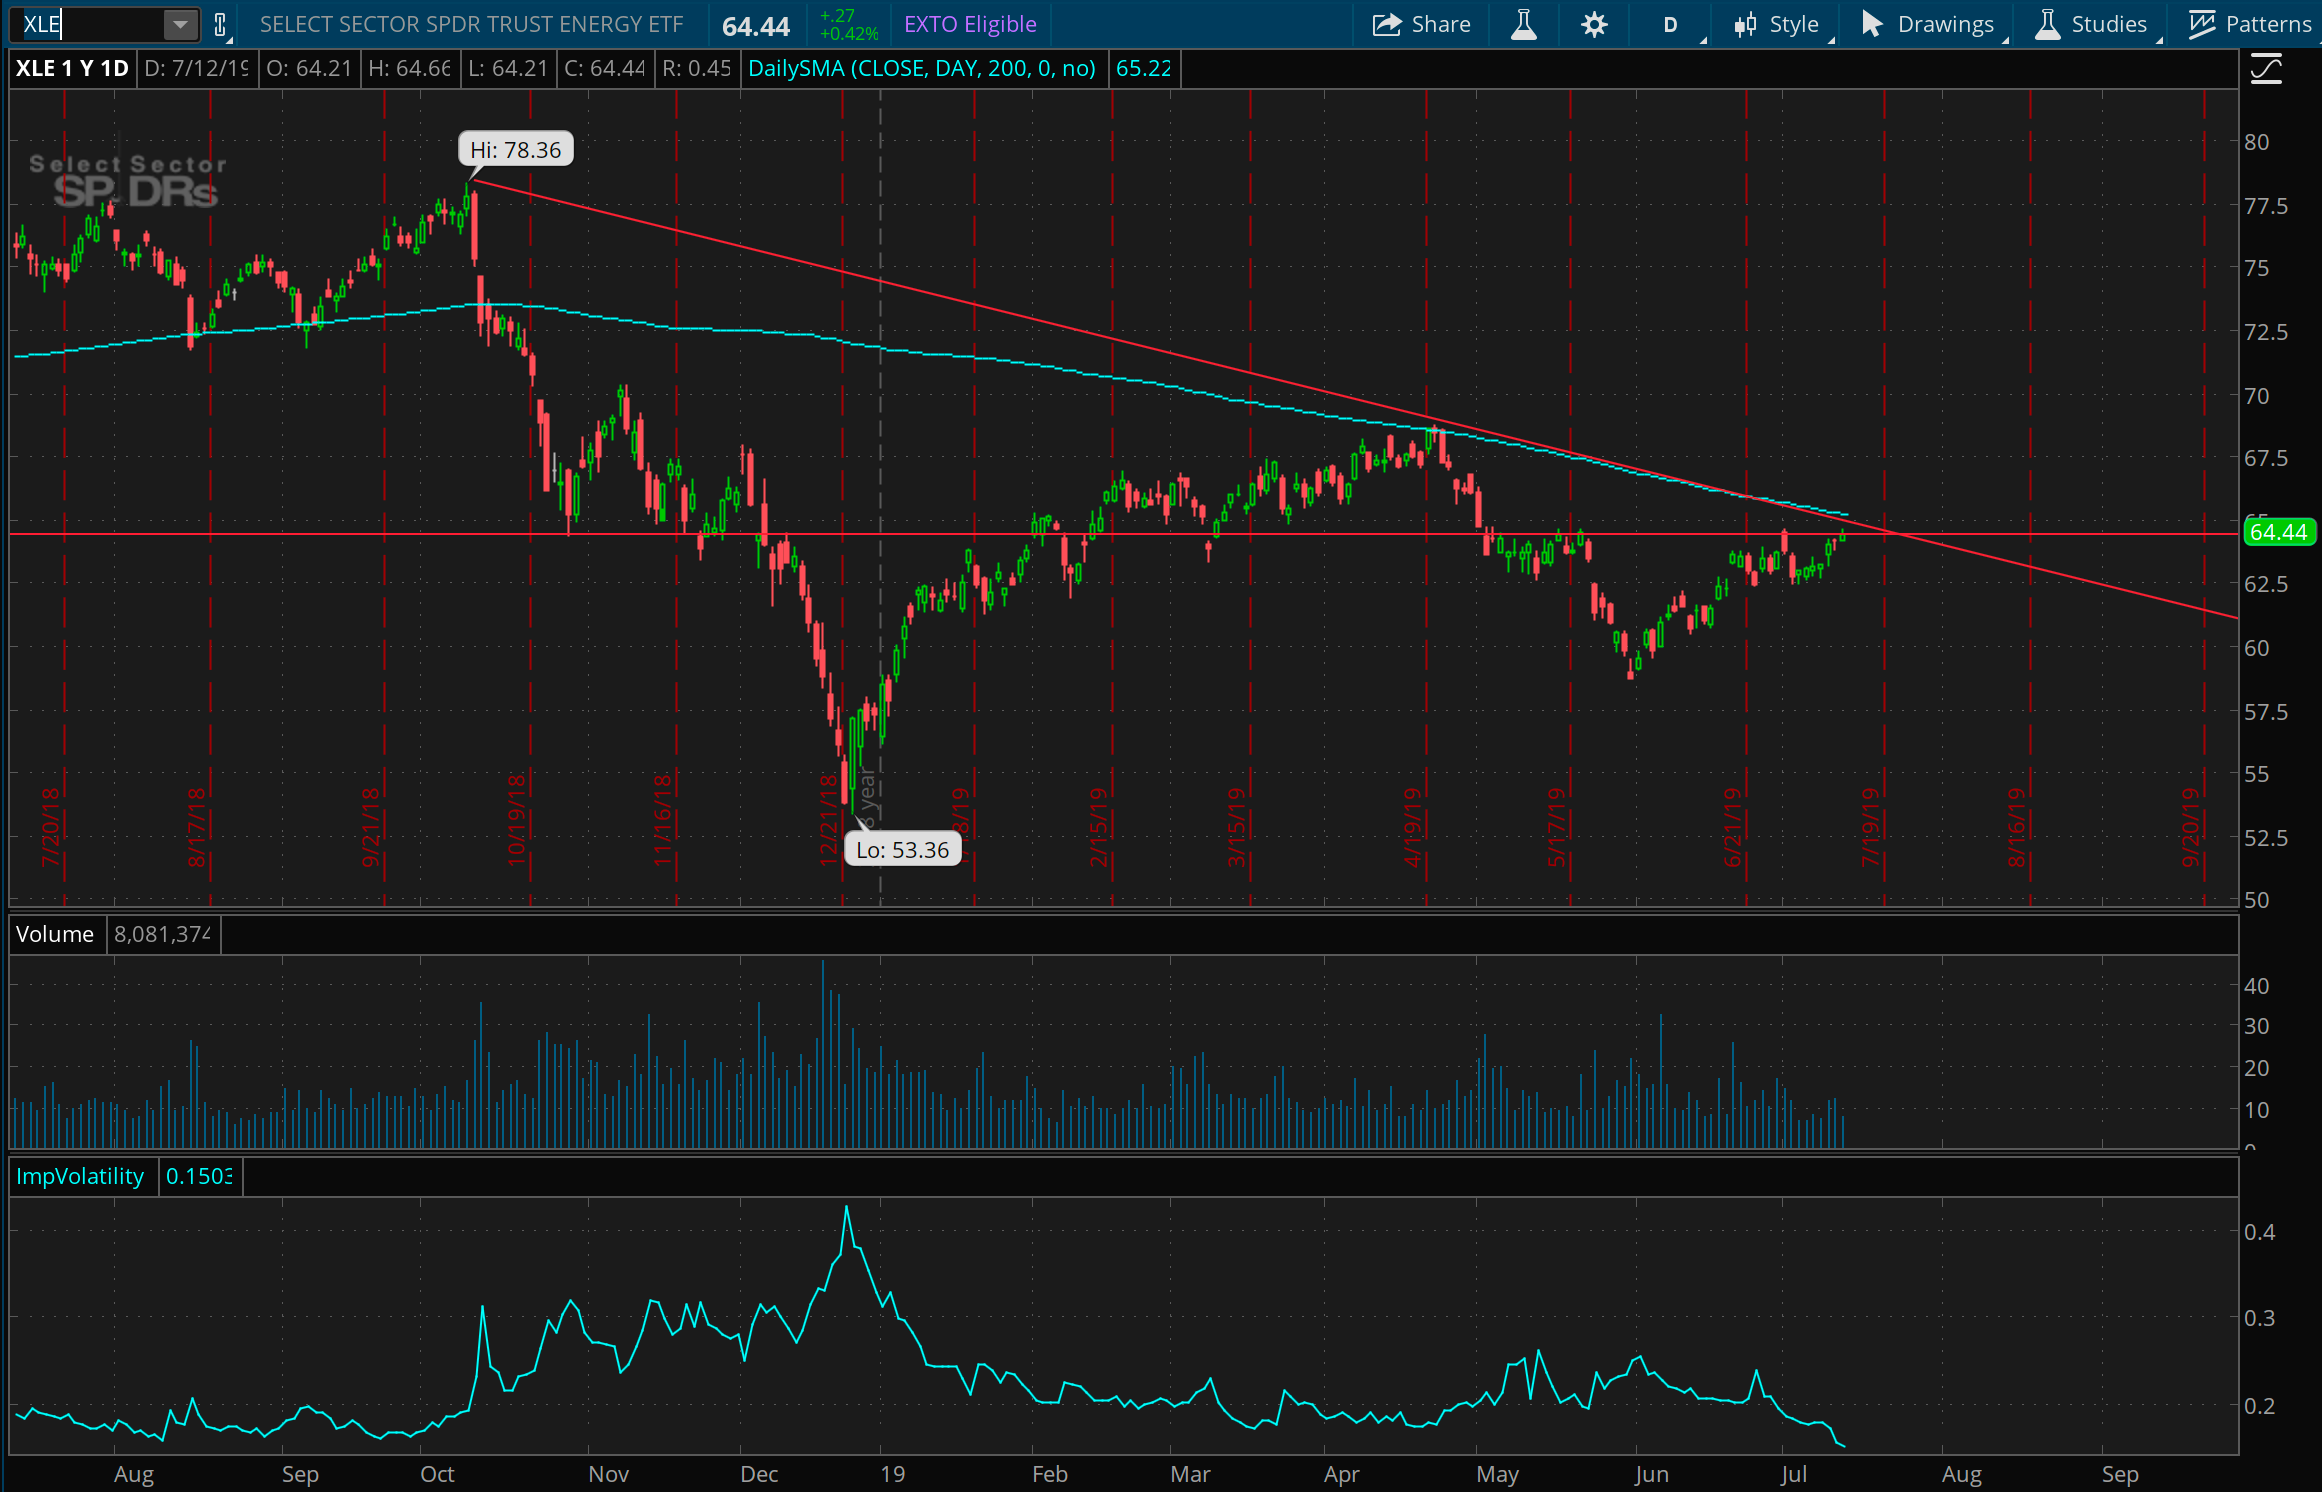
Getting a bit tired of staring at the same trades, I’m looking around for a few other things to put on. I just happened across what looks like a pretty solid resistance setup in XLE, between a downward trendline and 200 day moving average overhead. The stock is right there too, so I think this trade is imminent, and something I’m interested to put on Monday morning as long as the market doesn’t gap down and I miss my chance. Given some troubles I’ve had in XLB and XLF, I’ll be more aggressive with cutting this trade if it doesn’t work out quickly though.
Square on a tear
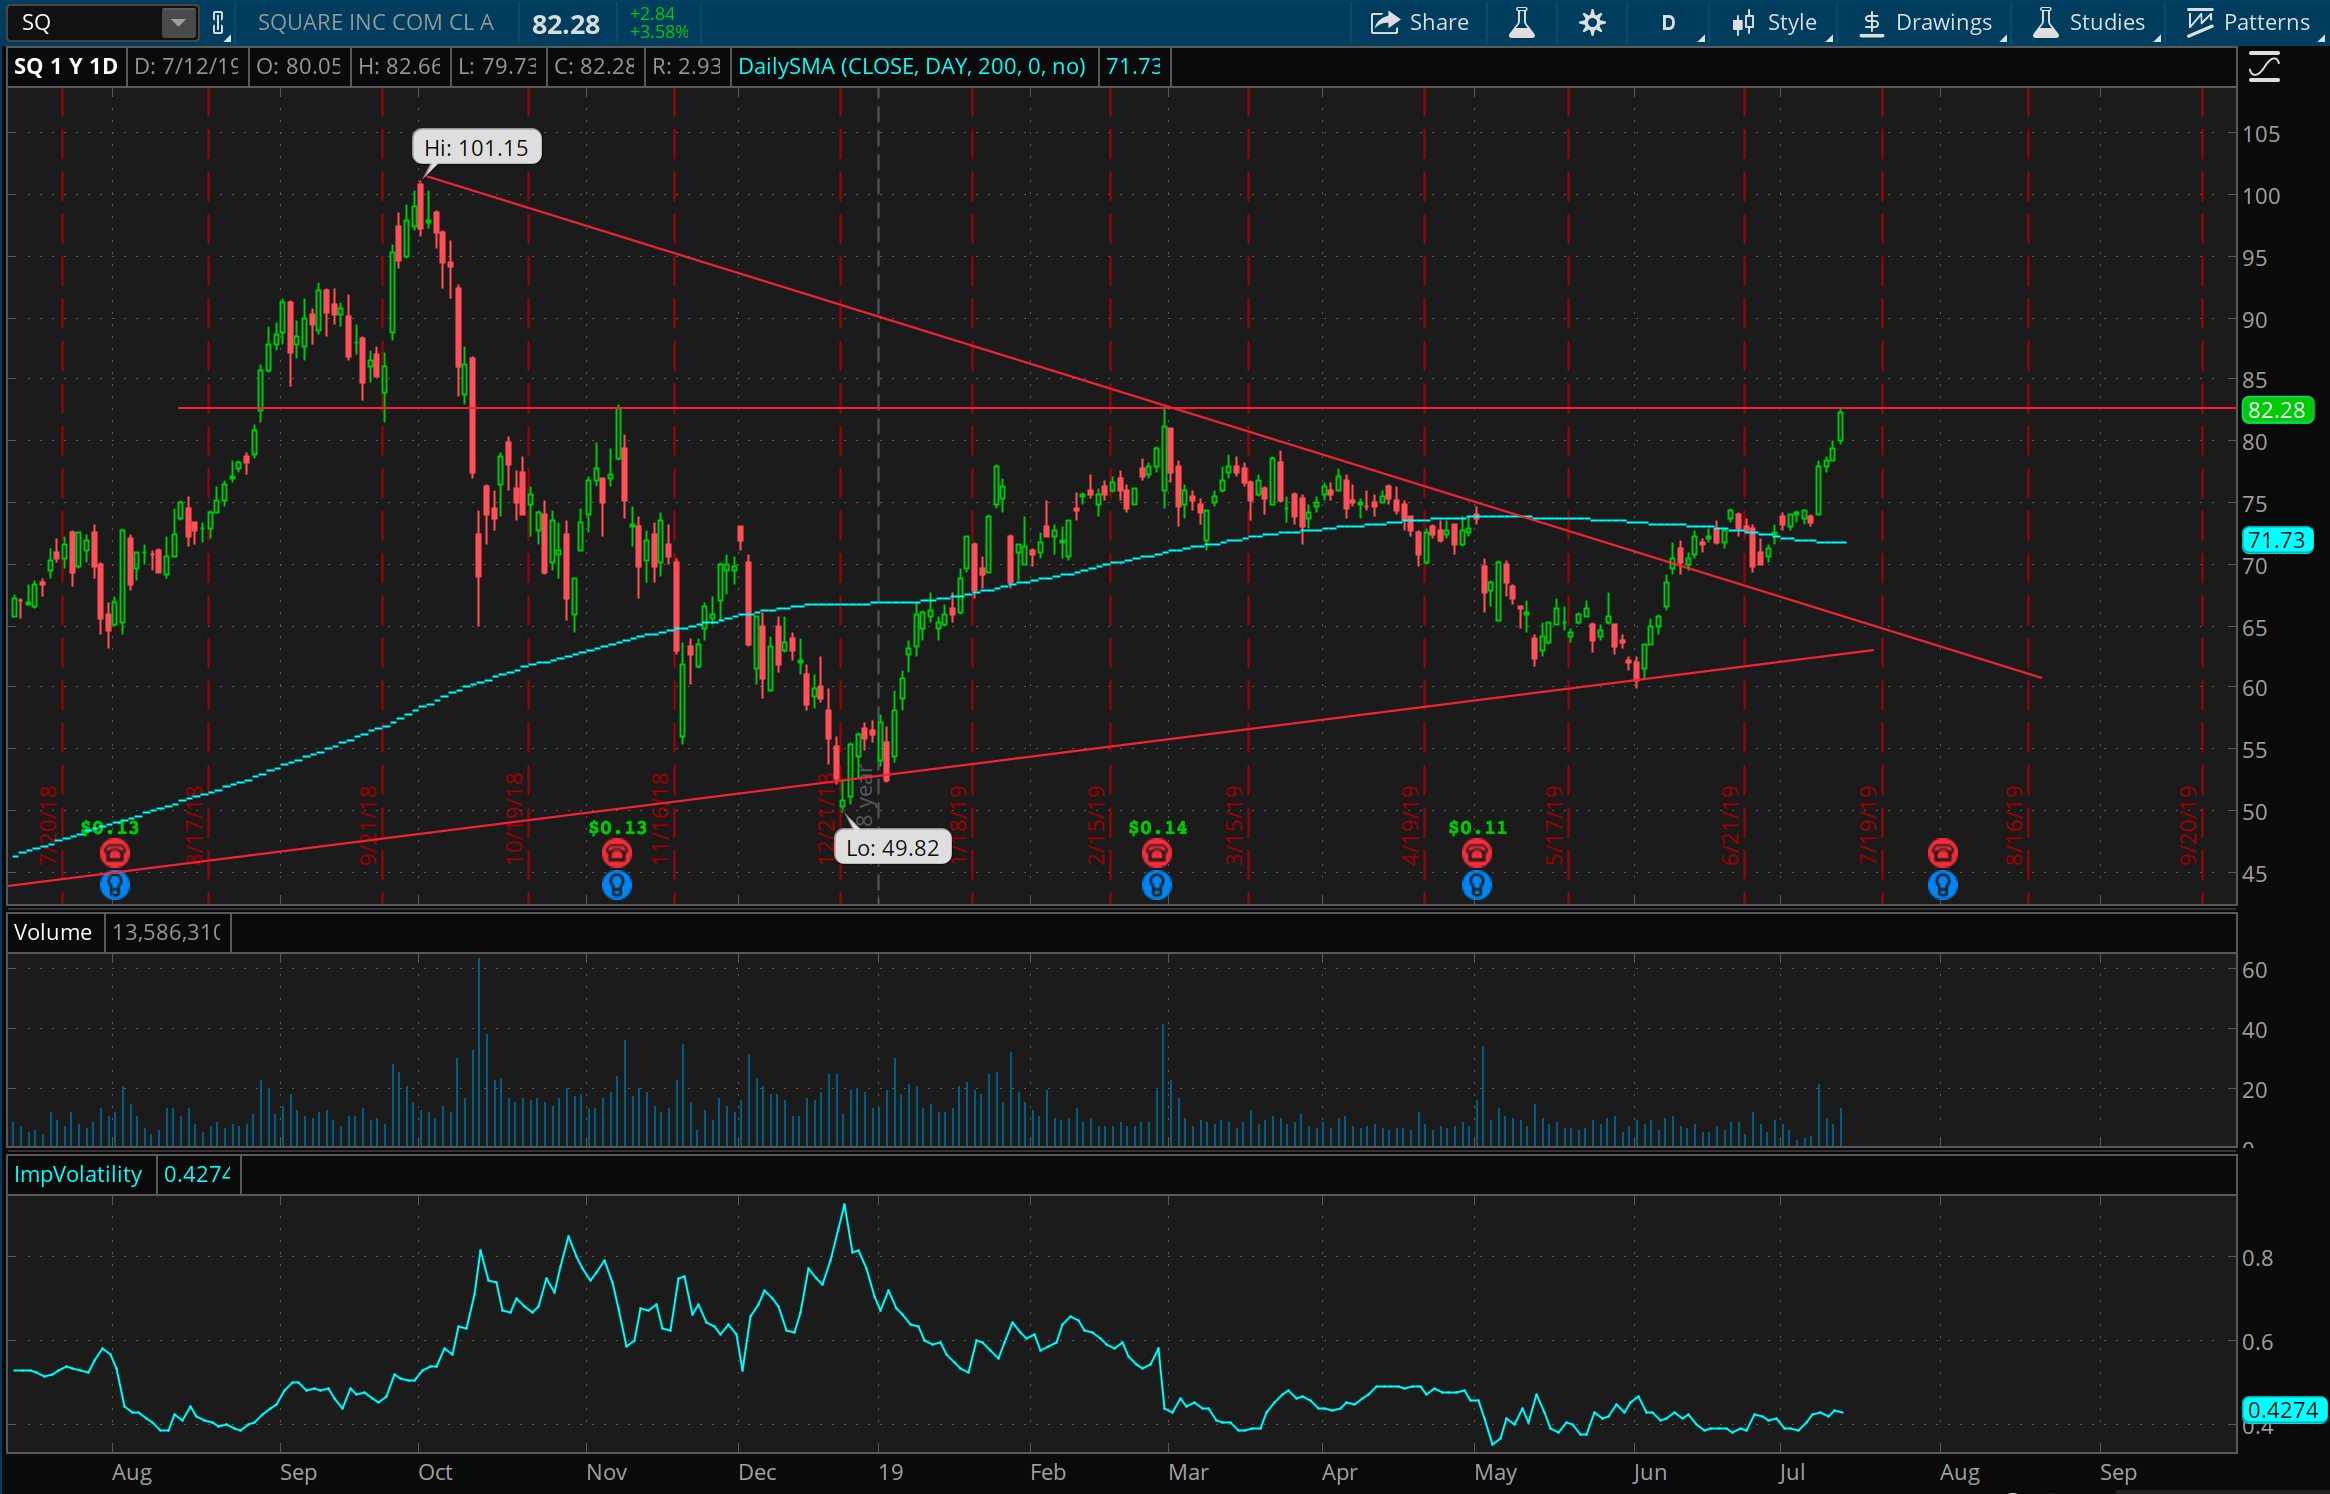
Good lord, look what Square did this week. It rose about 9% is what it did. That’s a jarring and dramatic run upward. But, it’s also stopped at a very interesting price level, here around 82 - 83. This is where prices tried and failed to get higher around November of last year and February this year. Still though, this thing ran up to it with some serious strength. It’s that strength though that makes this feel like a pretty good contrarian play, to sell a call spread at 85 and close your eyes. Sometimes it’s these trades that look scary to put on which actually turn out best.